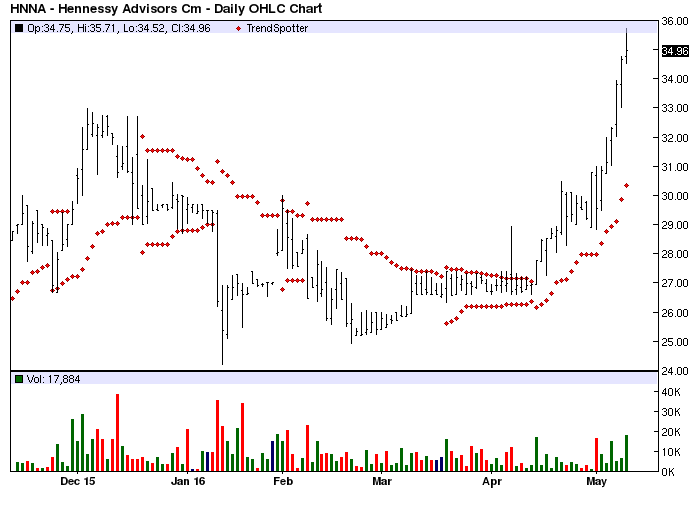
The Chart of the Day belongs to Hennessy Advisors (HNNA). I found the investment management stock by using Barchart to sort today's All Time High list first for the most frequent number of new highs in the last month then again for short term buy signals of 80% or better. Then I used the Flipchart feature to review the charts for consistency. Since the Trend Spotter signaled a buy on 3/18 the stock gained 27.59%.
Hennessy Advisors, Inc. is the investment manager of the Hennessy Funds, a family of six no-load mutual funds, satisfying a variety of investment objectives and risk tolerance levels. Each of the Hennessy Funds employs a unique mutual fund money management approach combining superb, time-tested stock selection formulas with unwavering discipline and consistency. Hennessy Advisors manages the Hennessy Cornerstone Growth Fund (HFCGX), the Hennessy Cornerstone Growth Fund, Series II (HENLX), the Hennessy Cornerstone Value Fund (HFCVX), the Hennessy Total Return Fund (HDOGX), the Hennessy Balanced Fund (HBFBX) and the Hennessy Focus 30 Fund (HFTFX). The company serves clients with integrity, honesty and candor. The Funds' strategies and performance are fully disclosed. Hennessy Advisors' strength lies in their disciplined investment style and commitment to managing their mutual funds for the benefit of their shareholders. (press release)
The status of Barchart's Opinion trading systems are listed below. Please note that the Barchart Opinion indicators are updated live during the session every 10 minutes and can therefore change during the day as the market fluctuates. The indicator numbers shown below therefore may not match what you see live on the Barchart.com web site when you read this report.
Barchart technical indicators:
- Short tern technical buy signals
- Trend Spotter buy signal
- Above its 20, 50 and 100 day moving averages
- 15 new highs and up 29.67% in the last month
- Relative Strength Index 79.35%
- Recently traded at 35.00 with a 50 day moving average of 28.07
Fundamental factors:
- Market Cap $177.42 million
- P/E 13.63
- Dividend yield .95%
- No Wall Street analysts is following this stock