
I REMEMBER when I was learning to drive a car. Taking a sharp curve in the road could be unsteady and even frightening, fighting it every inch; then I realized that if I didn't look at the close-up so much, and allowed my eyes to pull up out of the tense confrontation, I could let the car ease into the future more easily, as I looked up, a it out of the present.
So this weekend I decided to do the same thing, with stocks. And it was a nice relief. No question, a battle is happening in the markets. We are taking a sharp corner at a high speed. So I pulled up out of the daily charts, into the monthly. You may like what I saw.
We have also been testing a new trading system, called the DOUBLE PROP SYSTEM, which trades the combined PROP1 and PROPS2 (currency system) -- requiring that both Prop 1 and Prop 2 be bullish to place a long trade; selling when the TRADING PROP (Prop 2) fall into the SELLZONE. We have an alternative system which requires a sell when both PROPS fall into the TRADE ZONE. This we have been looking at with monthly charts.
The more I think of it, the less I trust what happened in the markets on the night of the election. A 180° turnaround from crashing stocks, crashing Dollar, soaring bonds, soaring gold and silver -- into its direct opposite in four hours. When it was possible Donald Trump might win the presidency, everything collapsed, US futures down 1,000 points. A few hours later, when it became clear he was going to be president, suddenly a change of heart, and a TRUMP RALLY instead --I think I see a grandmother's fingerprint in this, or at least one of their lackeys. Since 1987 the FED has been micro-managing markets for the sake of 'stability'. I think we saw more of that the night of the elections. I don't know how to investigate this; or how I might prove it. But I do have a gut feeling.
Another Trump Rally day today, six days in a row. But it is losing some steam. But the monthly charts are rather positive all the same.
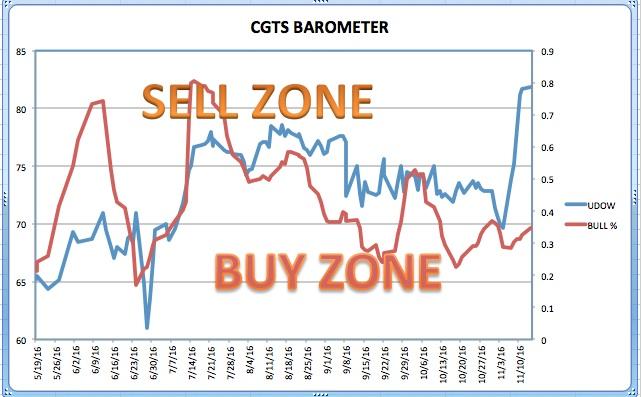
Today's BAROMETER shows the UDOW soaring -- and the BAROMETER remaining in the low-pressure zone. We want to try ready to take profits when the BAROMETER moves into overbought area -- so far modest BAROMETER gain.
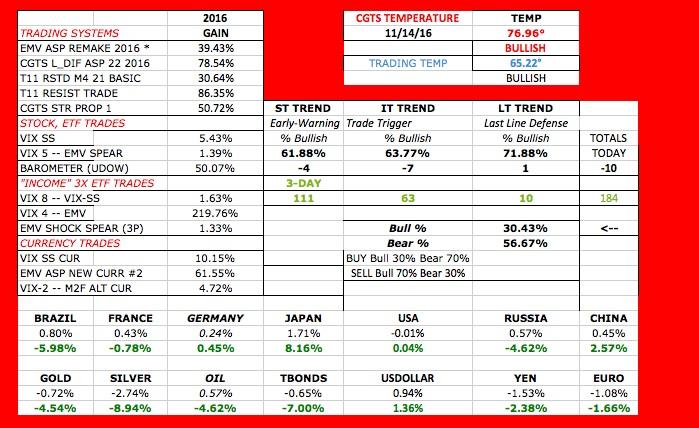
Our DASHBOARD shows positive TREND MOVEMENT-- although the daily Trend action moved backward. In fact, PROP1 lost 2 degrees as well, suggesting weak breadth.
As a change of pace, I wanted to show our DOUBLE PROP report, a system we are testing that uses our combined short- and long-term PROP indicators as trading instruments. A SHORTSELL has both PROP readings negative; a COVER reading has the short-term PROP back in the BUYZONE.
One can see quite ready that gold and silver stocks has shaken out much of their sentimental strength. There has been an earthquake; and the losers of this earthquake (Yellen's Last Stand?) have been Brazil, TBonds, Gold, Silver, Russia and Oil. The winners have been, well, the imperiled establishment: US stocks, US Dollar, Japan, Germany, France. Rates are pushing higher -- some story about Trump being a big spender, and igniting inflation. Interesting story.
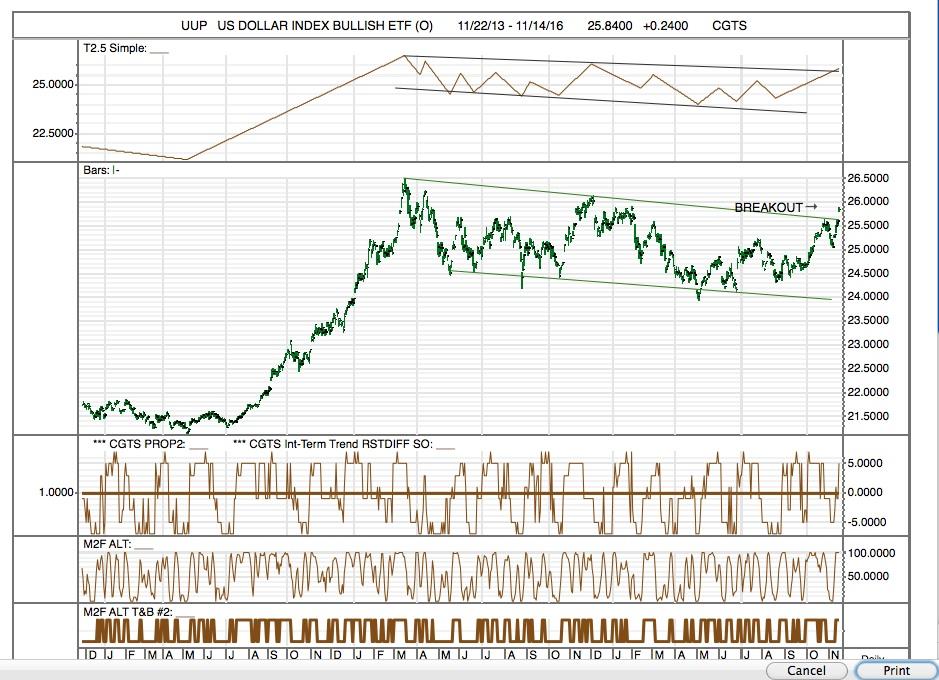
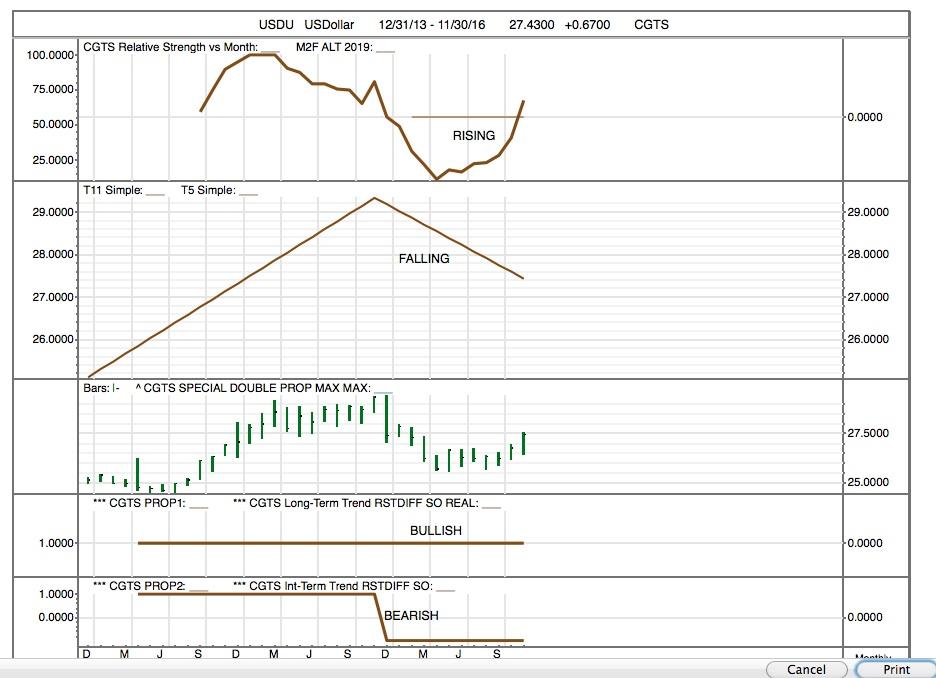
The US DOllar had a BIG day; the daily chart shows this, with UUP breaking up out of its trading channel. (Oddly, I looked at a surrogate US Dollar monthly chart, USDU; and it looked rather mixed.)
Here's today's DOUBLE PROP REPORT:
| Column1 | Column2 | Column3 | Column4 | Column5 | Column6 | Column7 | Column8 |
| 11/14/16 | |||||||
| DOUBLE PROP REPORT | |||||||
| NEW POS | NEW POS | ||||||
| SYMBOL | CLOSE | PROP2 | PROP1 | POSITION | TODAY | YESTERDAY | ISSUE |
| AG | 8.36 | -15 | -15 | Short | First Majestic Silver | ||
| SPWR | 6.88 | -19 | -19 | Short | Sunpower | ||
| SSRI | 9.5 | -21 | -21 | Short | Silver Standard Resources | ||
| USLV | 14.03 | -21 | -21 | Short | Enter Short | * Silver Stocks Bullish ETF 3x (NO) | |
| IAG | 3.72 | -23 | -23 | Short | I Am Gold | ||
| RGR | 50.75 | -23 | -23 | Short | Sturm Ruger | ||
| THC | 16.4 | -23 | -23 | Short | Tenet Healthcare | ||
| BRZU | 28.66 | -25 | -25 | Short | * Brazil Stocks Bullish ETF 3x (O) | ||
| KOF | 64.22 | -25 | -25 | Short | Coca-Cola Femsa | ||
| LBJ | 74.925 | -25 | -25 | Short | * Latin America Stocks Bullish ETF 3x | ||
| VNR | 0.51 | -25 | -25 | Short | Vanguard Natural Resources | ||
| AXPW | 0.014 | -19 | -1 | Flat | Exit Long | AXION | |
| CLAW | 35.33 | -21 | -3 | Flat | * Homebuilders Bearish ETF 3 x (NO) | ||
| DAKP | 0.04 | -21 | -3 | Flat | Dakota Plains Holdings | ||
| RGLD | 66.38 | -21 | -3 | Flat | Royal Gold Inc | ||
| ^UTY | 583.11 | -23 | -5 | Flat | Utility Index | ||
| ^XAU | 78.83 | -23 | -5 | Flat | Phila Gold/Silver Ind $ | ||
| HL | 5.95 | -23 | -5 | Flat | Hecla Mining | ||
| KORU | 22.25 | -23 | -5 | Flat | * South Korean Stocks Bullish ETF 3x (NO) | ||
| KSU | 85.1 | -23 | -5 | Flat | KANSAS CITY SOUTHERN | ||
| BZQ | 20.6 | 23 | -7 | Flat | Short Brazil Shares ETF | ||
| EDC | 48.7 | -25 | -7 | Flat | * Emerging Markets Bullish ETF 3x | ||
| EWZ | 32.39 | -25 | -7 | Flat | Brazil ETF $ | ||
| RGLS | 3.25 | 3 | -15 | Flat | Regulus Therapeutics | ||
| SAH | 20.8 | 3 | -15 | Flat | Sonic Automotive | ||
| ENDP | 18.19 | 1 | -17 | Flat | Endo Pharmaceuticals | ||
| EYES | 2.17 | 1 | -17 | Flat | Second Sight | ||
| NDLS | 4.5 | 1 | -17 | Flat | Noodles | ||
| TNP | 4.62 | 1 | -17 | Flat | Tsakos Energy Navigation LTD | ||
| TTI | 5.3 | 1 | -17 | Flat | Tetra Technologies | ||
| OREX | 2.47 | -1 | -19 | Flat | Orexigen Pharmaceuticals | ||
| VRX | 17.55 | -1 | -19 | Flat | Valeant Pharmaceuticals | ||
| EMES | 11.01 | -7 | -25 | Flat | Emerge Energy Services | ||
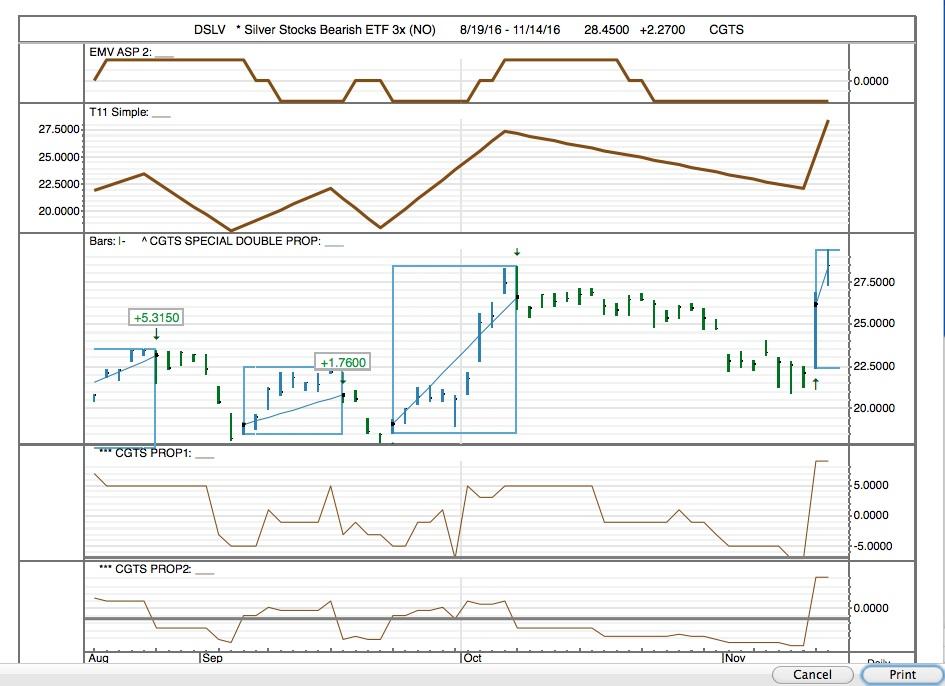
| DSLV | 28.45 | 21 | 9 | Long | Enter Long | * Silver Stocks Bearish ETF 3x (NO) | |
| AXAS | 1.77 | 5 | 5 | Long | Abraxis Petro | ||
| AXON | 13.38 | 3 | 3 | Long | Axovant | ||
| CLB | 105.93 | 3 | 3 | Long | Core Labs | ||
| FMCC | 2.69 | 3 | 3 | Long | Freddie Mac Daily | ||
| JCP | 9.52 | 3 | 3 | Long | JC Penney | ||
| KBR | 16.63 | 3 | 3 | Long | KBR INC | ||
| LOCO | 12.7 | 3 | 3 | Long | El Pollo Loco | ||
| OTIV | 1.07 | 3 | 3 | Long | On Track Innovations | ||
| QLTI | 1.74 | -1 | -1 | Long | QLT Inc (Biotech) | ||
| FLR | 51.51 | 25 | -5 | Long | Enter Long | Exit Long | Fluor Corp |
| EDZ | 28.35 | 23 | -7 | Lon | * Emerging Markets Bearish ETF 3x | ||
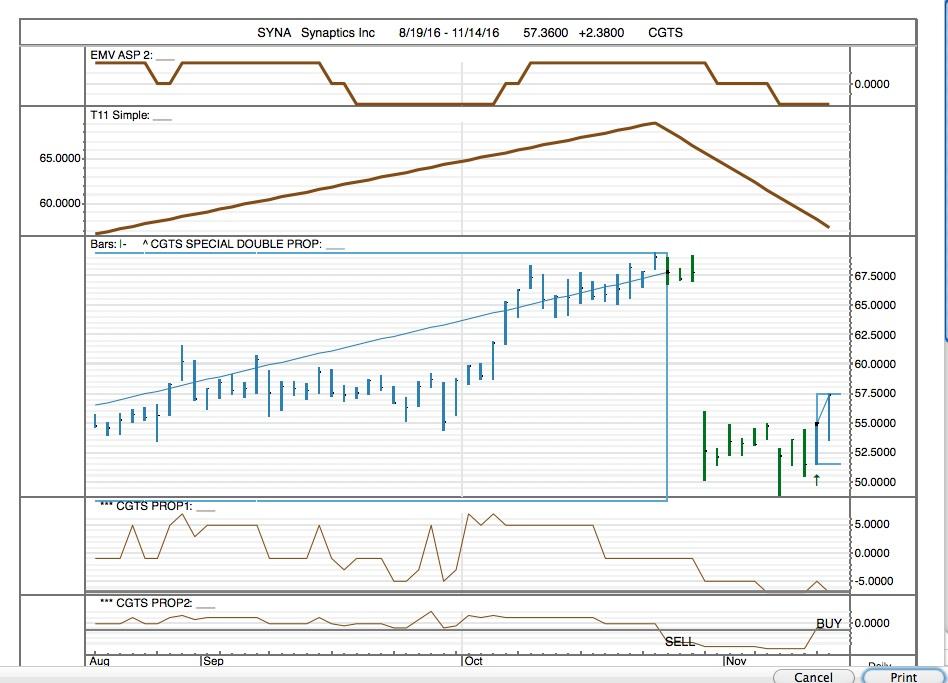
| SYNA | 57.36 | -7 | -7 | Long | Enter Long | Synaptics Inc | |
We will look at this system more carefully this week.
Here's our slide show. First, we had a few actual BUY SIGNALS given this month -- triggered, I am assuming by the BIG SHOW Donald Trump cast on commodities and developing bourses and especially curriencies.
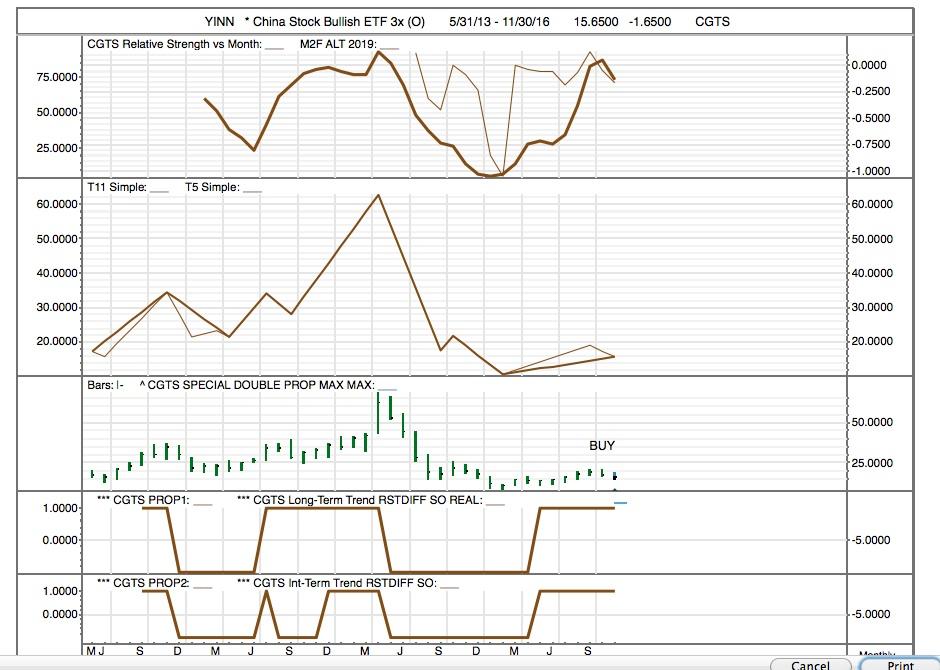
YINN, Bullish China Stocks ETF, is a monthly BUY in our modified DOUBLE PROP SYSTEM.
So is SOXL, Semiconductors Bullish ETF -- its inverse, SOXS, Seminconductors Bearish ETF, is a SHORTSELL
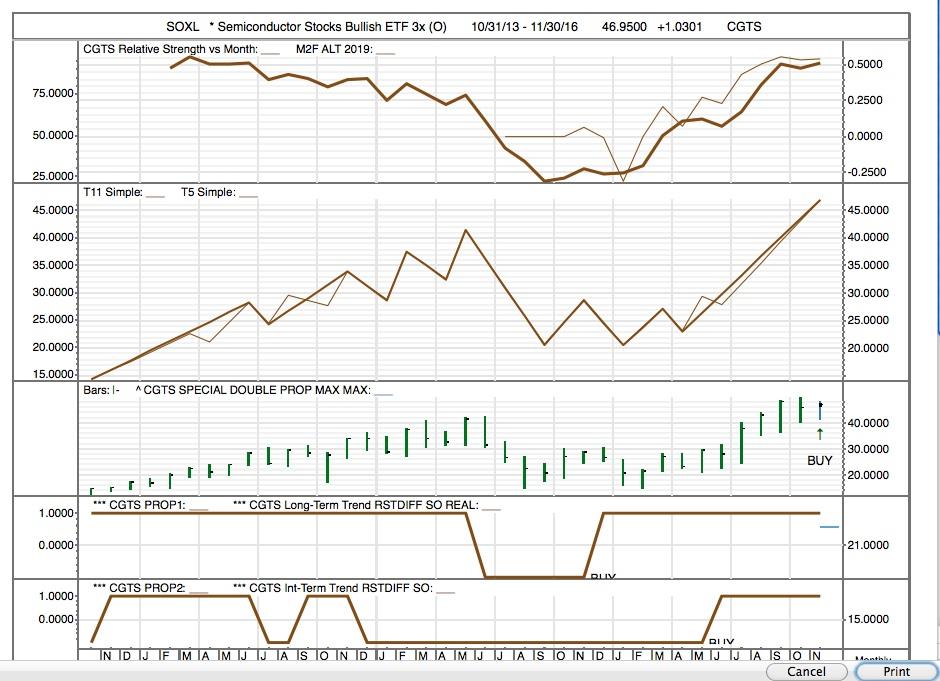
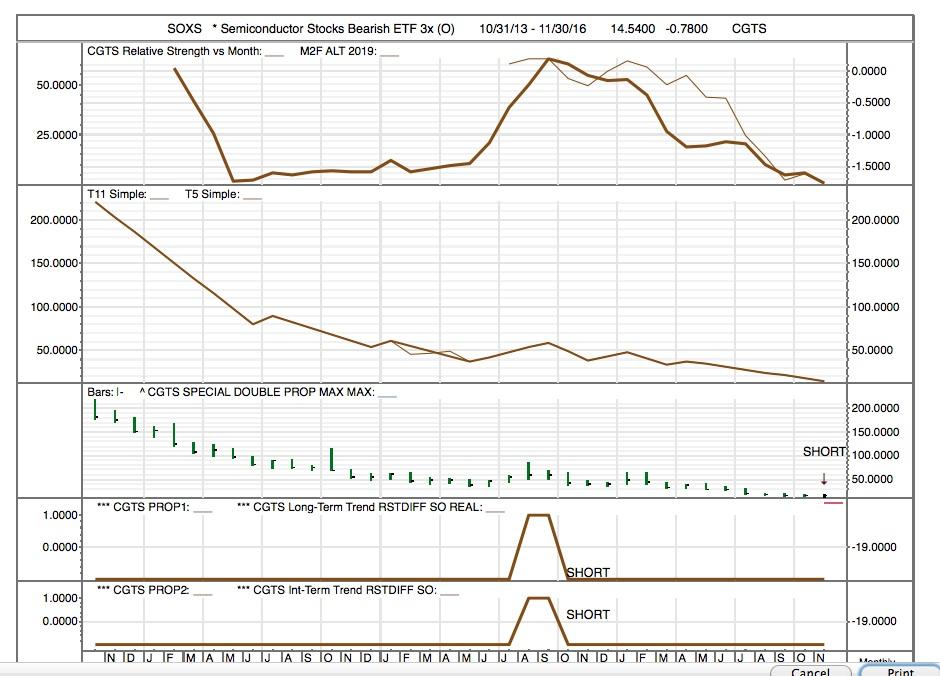
It's nice when the pair of bookends match. Sometimes they do -- not always.
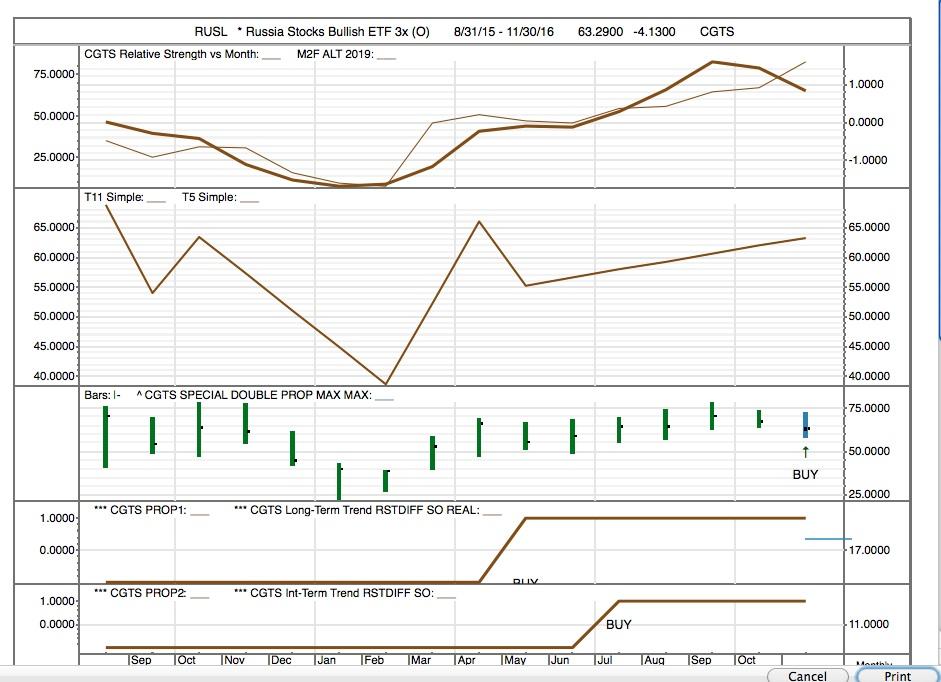
Another BUY SIGNAL is RUSL, Russian Stock Bullish. What is this saying? It is saying that the recent selloff is overdone.
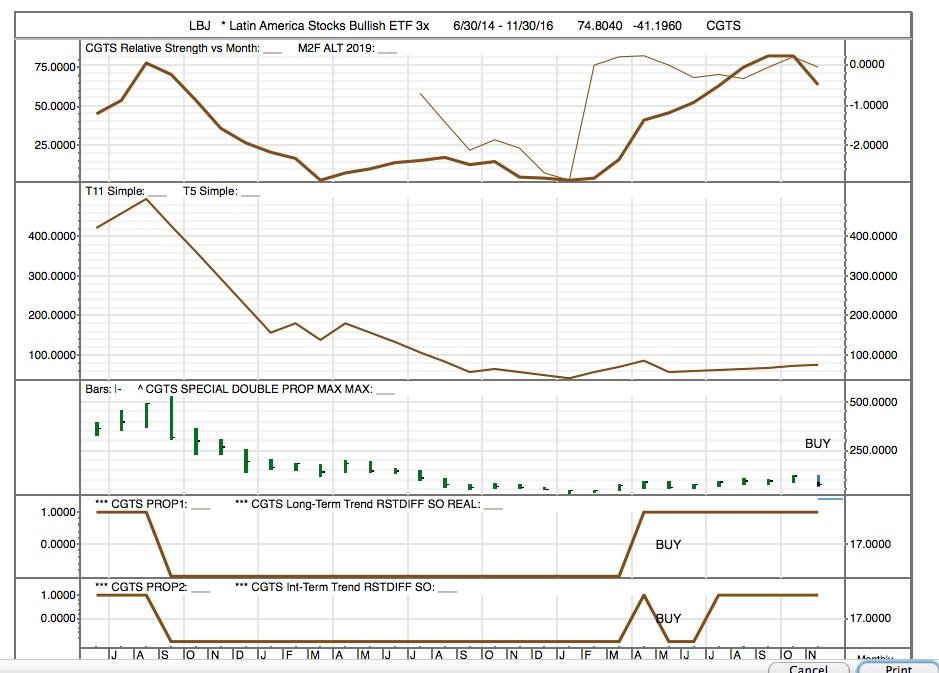
LBJ (Latin American Stock Bullish) and BRZU (Brazil Stocks Bullish) were annihilated this week. As 'luck' would have it, the LBJ selloff is leading to a monthly BUY SIGNAL.
EMES, one of our favorites, is also a monthly BUY.
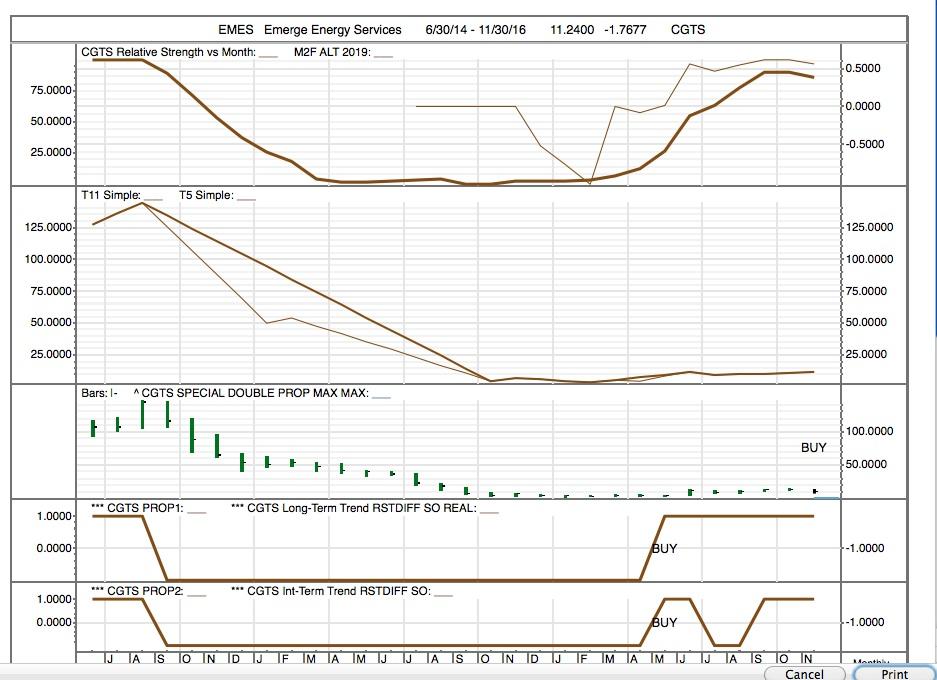
It is almost impossible to see the BUY ARROW on this chart, so we ran a close-up both to see the BUY ARROW AND the trend direction which does not show up clearly except in the close-up.
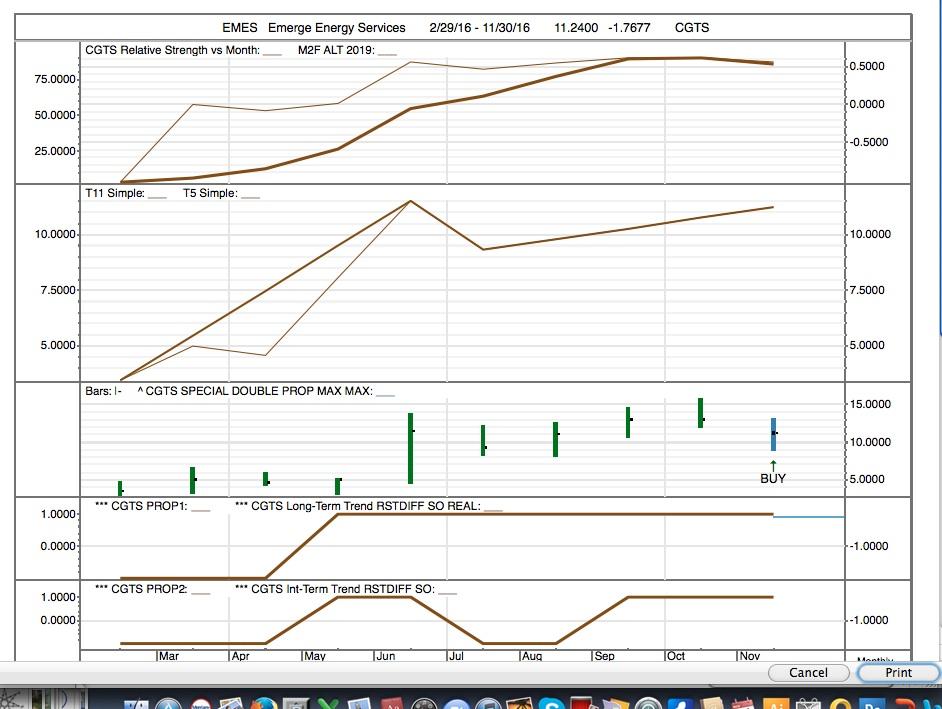
Clearly, the trend direction is positive.
We plan to show these monthly charts this week. We have a few favorites we would like to include tonight. LONG POSITIONS we love in the monthlies include:
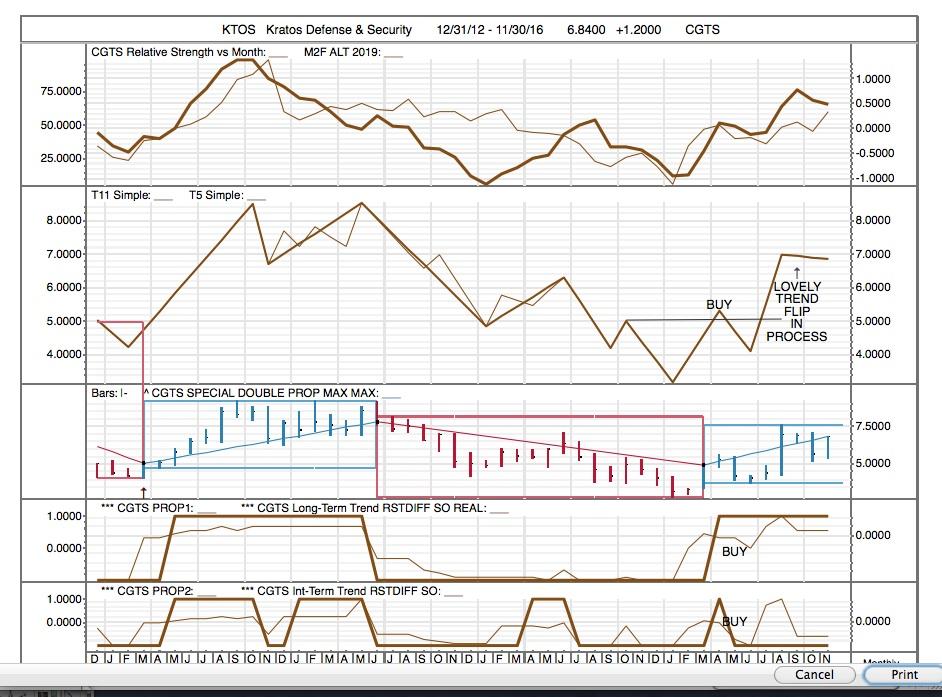
We think KTOS is a buy here, and we expect this stock to gain now because the trend line seems to be ready to flip up -- it is suggesting a surge of buying.
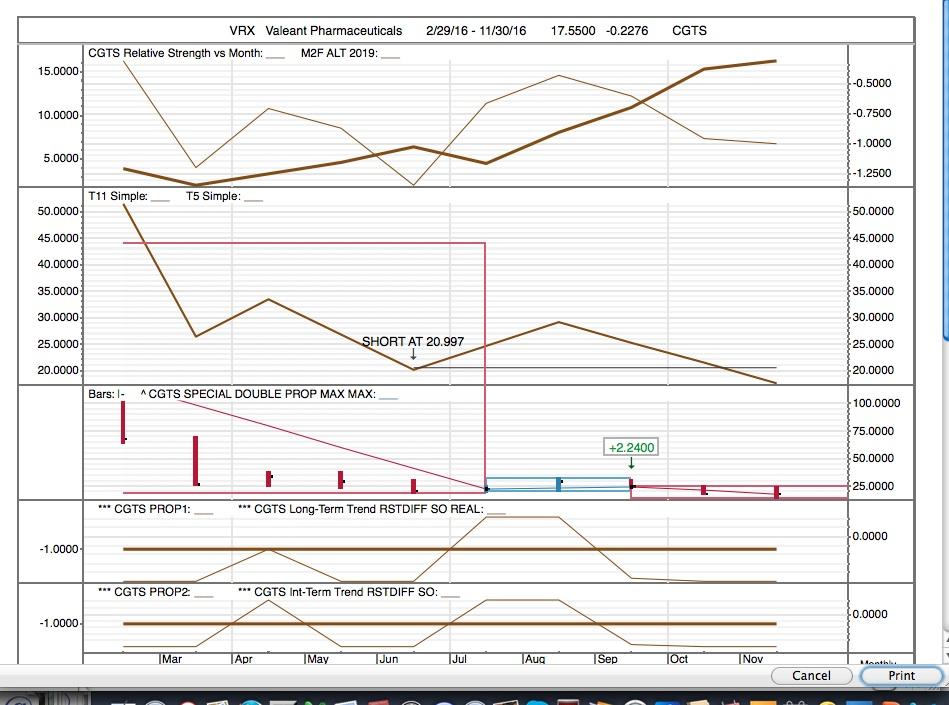
As a SHORT, we like our old favorite, VRX, Valeant Pharmaceuticals. The price broke through resistance on the downside at 20.997. We expect much lower prices.
I keep notes when I look at monthly charts, and construct a database for later use. I will share that with our readers later this week.
Best to everyone.
MJC, CGTS