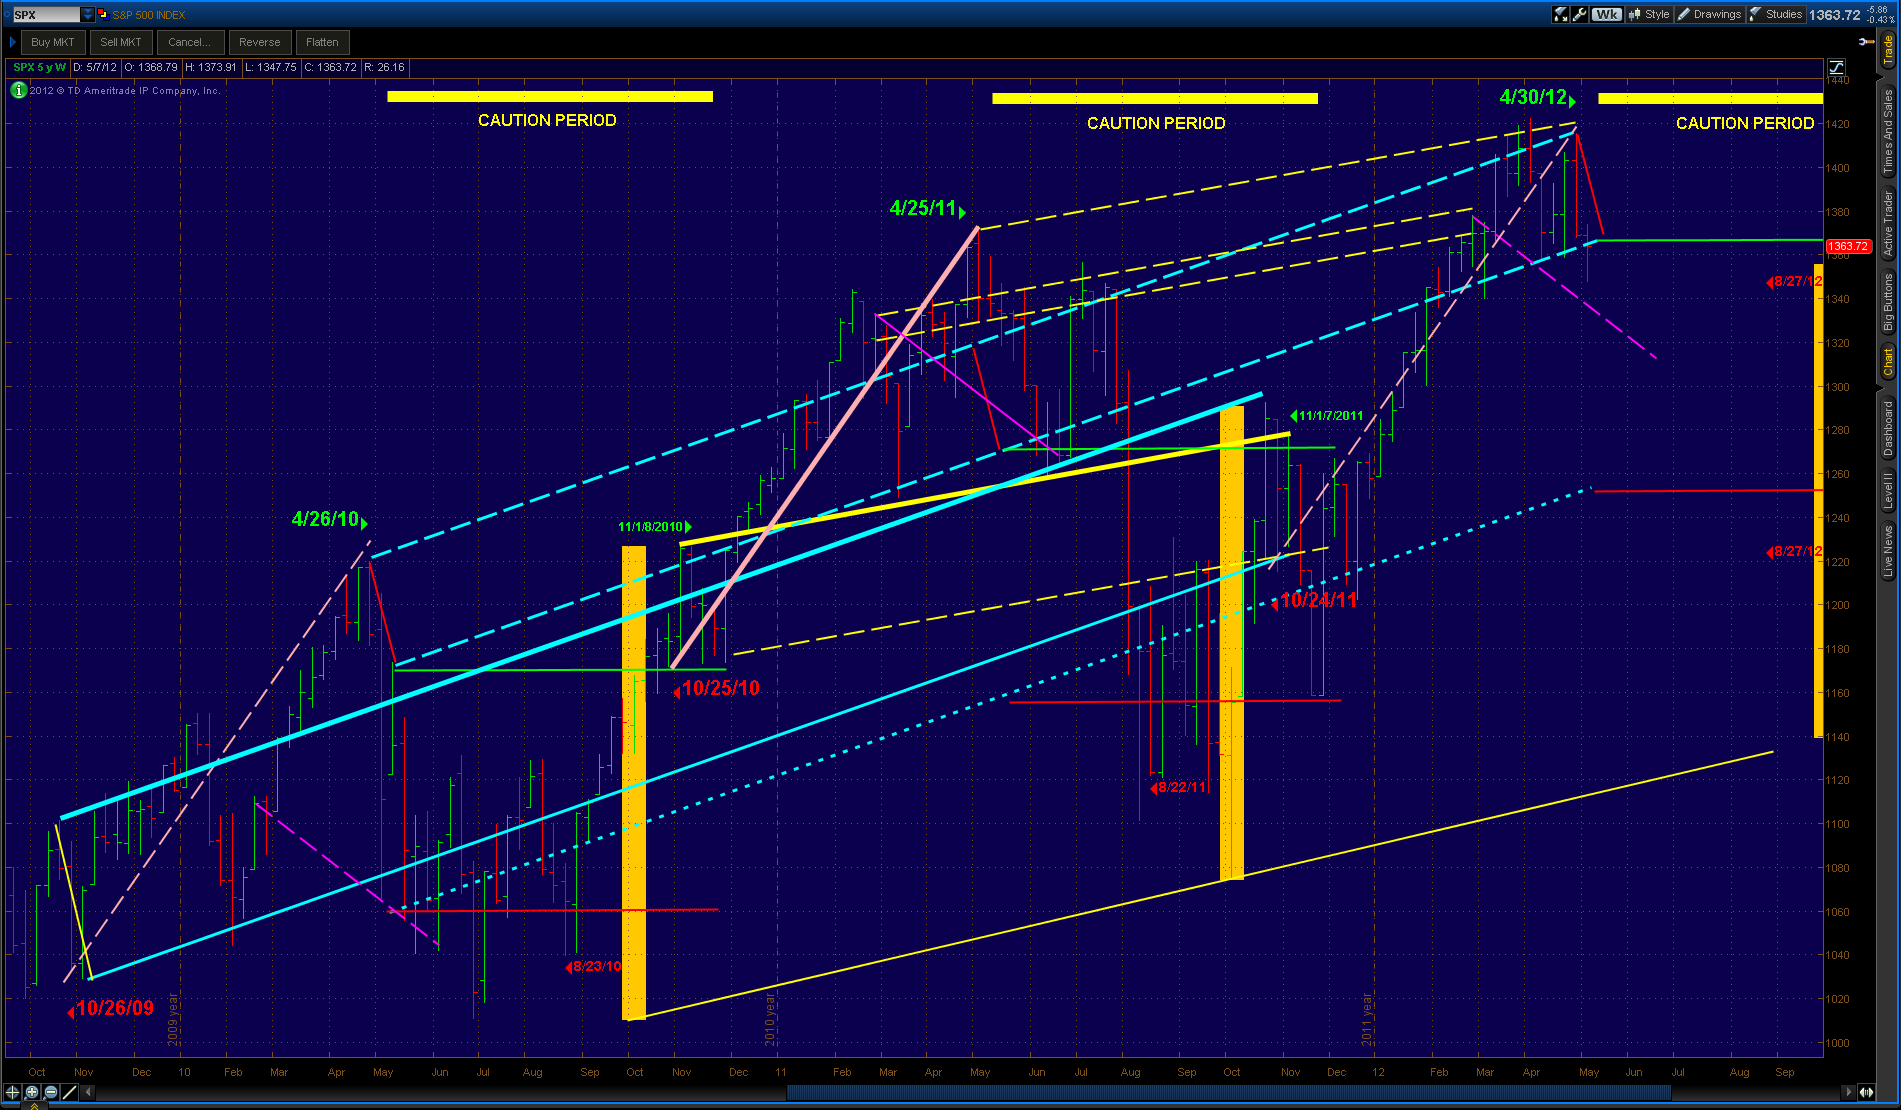
Provided below is a current ProtectVEST Two-Year Daily OHLC EasyGuideChart for Swing Traders of the SPX and SPY ETF.
WE HOPE THIS CHARTS PROVIDES HIGHER VISIBILITY TO YOU AS YOU ASSESS CURRENT SPX and SPY ETF MARKET PRICE LEVEL POTENTIALS AND STRATEGIES GOING FORWARD
Note: because of the precision involve in the MDPP forecast model, and the multi-layers of aggregated echovectors of various time-frames and Fourier transformations dynamically included, newly generated guidecharts with increased resolution and adjusted key highlights within the two year time frame perspective can be generated hourly. This particular guidechart is provided for basic informational and educational purposes only.
Key two-year echovectors (congressional) are highlighted in aquablue.
Key annual echovectors are highlighted in yellow.
Key bi-quarterly echovectors are highlighted in peach.
Key timely quarterly-plus length downvectors are highlighted in pink.
Key timely quarterly-minus length downvectors are highlighted in red.
Key equilibrium support echovectors and echolevels (horizontal) are highlighted in green and red.
Key EchoBackDates are highlighted in green and in red.
Key price level CHANGE ranges are highlighted in vertical yellow bars.
Key CAUTION time-frames are highlighted in horizontal yellow bars.
SPX AND SPY SWING TRADER'S PROTECTVEST EASYGUIDECHART