25 Jan 2013
Being a contrarian I'm interested in market sentiment, so recent TD Ameritrade's Investor Movement Index (IMX) attracts my attention. The index measures the actual behavior of the largest pool of retail investors in the world, especially the firm's most active customers, rather than relying on questionnaires or old fund flow data like other sentiment indicators do.
So I looked on data /imx.tdameritrade.com/IMX/index.jsp/ and unfortunately they are not comprehensive. TD Ameritrade says in FAQ that IMX scores going back to January 2010 if you click on the chart.
The chat X axis (time) is a bit tricky (compare ALL or 3 year with 1 year and 2 year graphs) but seems consistent, so I reproduce 3 year chart in Fig. 1 below:
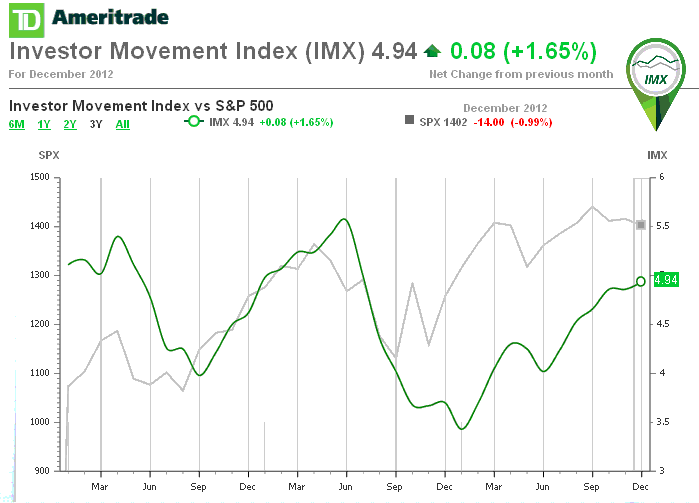
Fig. 1
It seems that IMX is a lagged indicator and therefore it value IMO is close to zero. Again IMO, this graph shows that average small investor underperformed the market during at least last 3 years which is consistent with many academic studies (for longer and earlier periods).
On the first glance the conclusion should be that so-called Institutional Movement Index might be more useful as a leading indicator. But several research shows that most mutual funds that rely on institutional analysts UNDERPERFORM the market but fees are one of drag down factor. So lets turn to predictions of finance advisers The predictions are also not often free from fees but these charges should not affect the graph shown in Fig. 2 below (footnote 1).
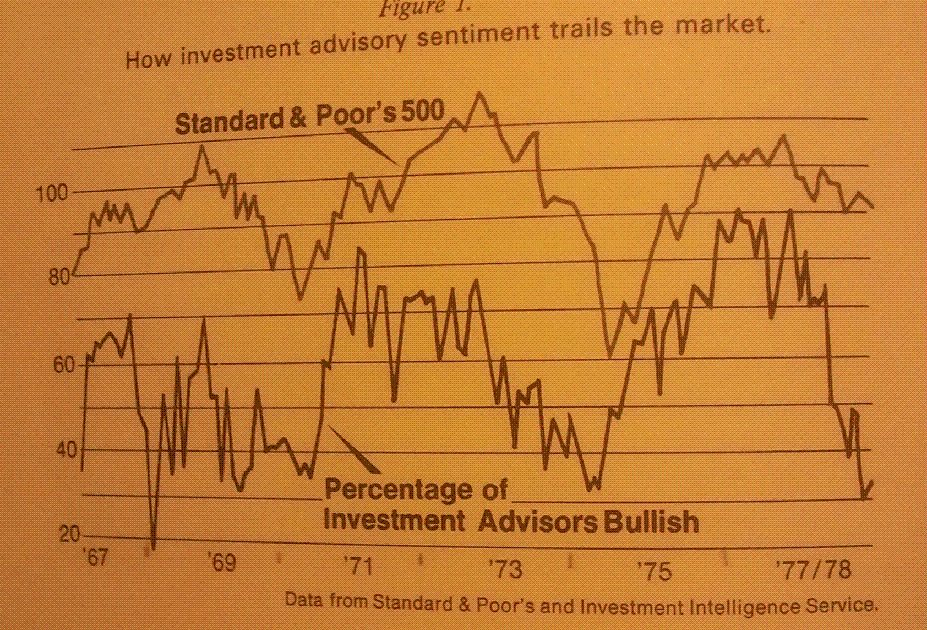
Fig. 2
As we can see this so-called "Investment Advisors Index" is also lagged indicator.
So, can anybody predict the market? I know only one answer: "Not me!".
Footnotes:
1. I took the Fig. 2 from the book "Contrarian Investment Strategy: The Psychology of Stock Market Success" by David Dreman, although I think his later book "Contrarian Investment Strategies: The Psychological Edge" is better.