AXPW: Intra-Day Trade & Buy:Sell Inflection Point Charting 3/1/2013
I've been manually collecting this data for a year now while volume was low and it was therefore reasonable to do so. I'll stop when it gets too large unless I can craft a mechanized capture of most of the stuff.
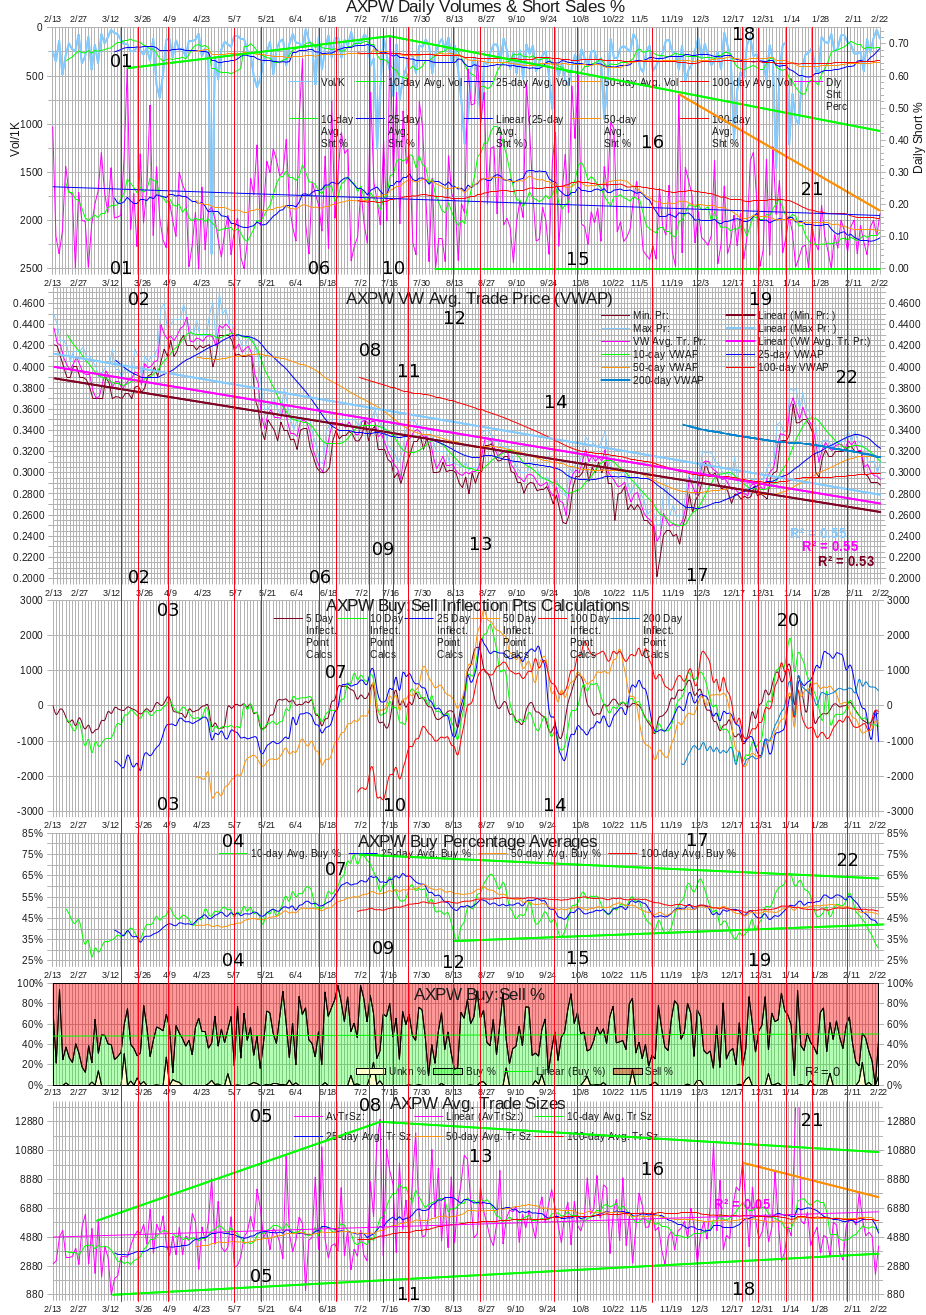
I've captured enough data now that I can reasonably expect to be able to detect patterns on the charts that may signal, somewhat reliably, when price moves are about to occur. To help more easily identify any useful patterns, I've made an instablog,
Axion Power International (AXPW) 2/13/2012 And Forward One Year Experimental Charts Snapshots. I've also added some lines to them that may assist in this. For anybody with an interest, I welcome any suggestions and/or help.I've also put up AXPW Fails-to-deliver Charts 2/11/2013, which I hope will convince folks that John has been correct in asserting the "big uglies" are out of our lives, at least for now.
I'll update this instablog daily as long as I can for anybody that might find it useful. The charts will stay near the top and the text updates expressing my most recent thoughts will follow after the charts.
I've arranged the chart segments in this instablog to put what I think are related stuff close together.
This is the eighth installment of the original "AXPW: Some Intra-Day Trade Charting" instablogs I've started doing on Seeking Alpha. The others grew, as I added daily commentary and FINRA data, to the point I was afraid the load time might become an irritant for folks that have less internet bandwidth or older computing equipment so I've started rolling to a new one aperiodically.
Versions subsequent to the original (latest to oldest) can be found here.
AXPW: Intra-Day Trade & Buy:Sell Inflection Point Charting 02/01/2013
AXPW: Intra-Day Trade & Buy:Sell Inflection Point Charting 12/15/2012
AXPW: Intra-Day Trade & Buy:Sell Inflection Point Charting 11/14/2012
AXPW: Intra-Day Trade & Buy:Sell Inflection Point Charting
AXPW: Intra-Day Trade Charting 9/6/2012 - Xx/xx/2012
AXPW: Intra-Day Trade Charting 7/7/2012 - 9/5/2012
In the below chart note that the volume is inverted to enhance readability! Be aware when you view it!
(right-click and open in new tab, position cursor over image to be able to zoom and scroll)
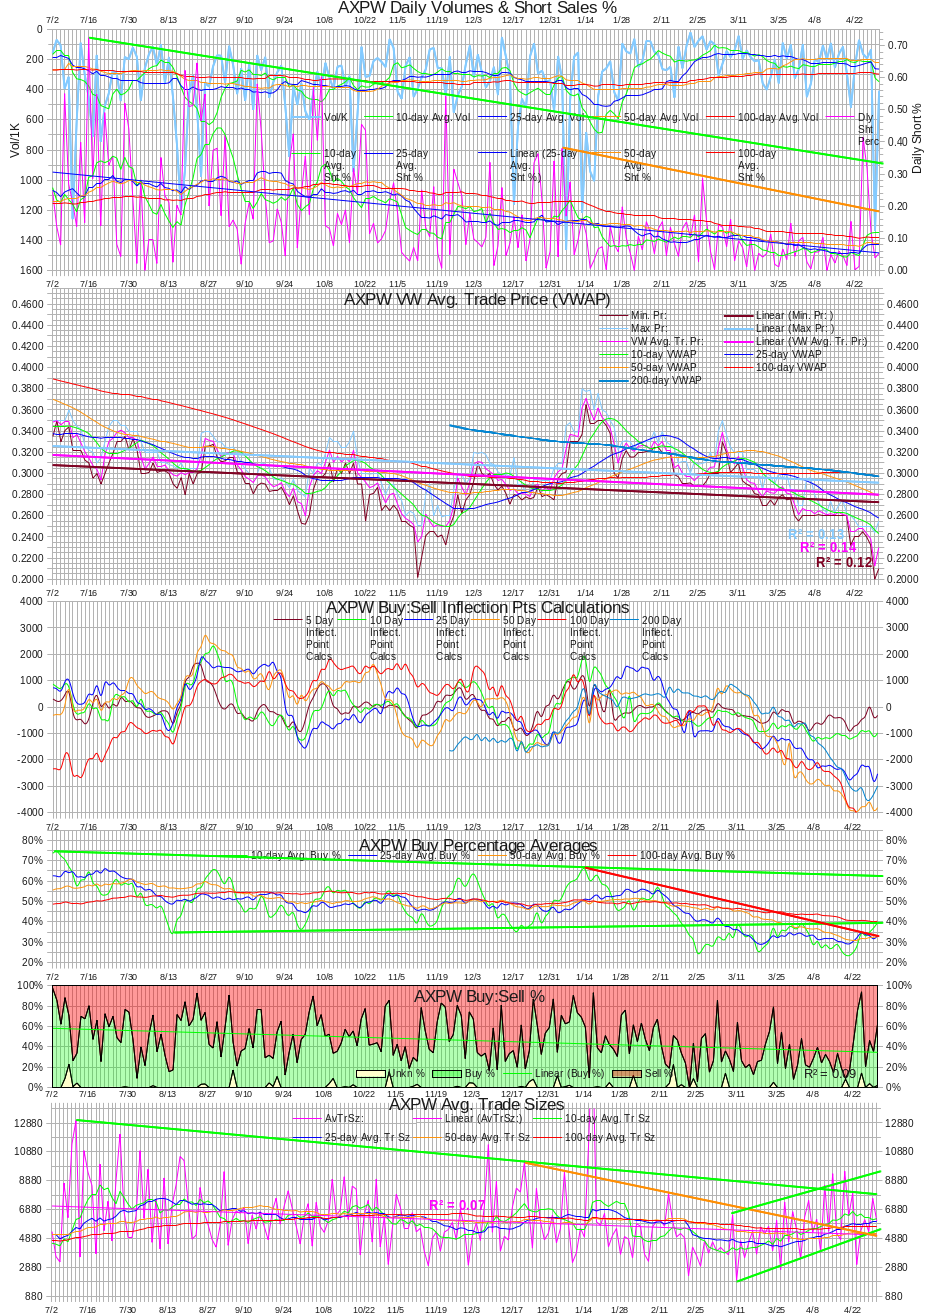
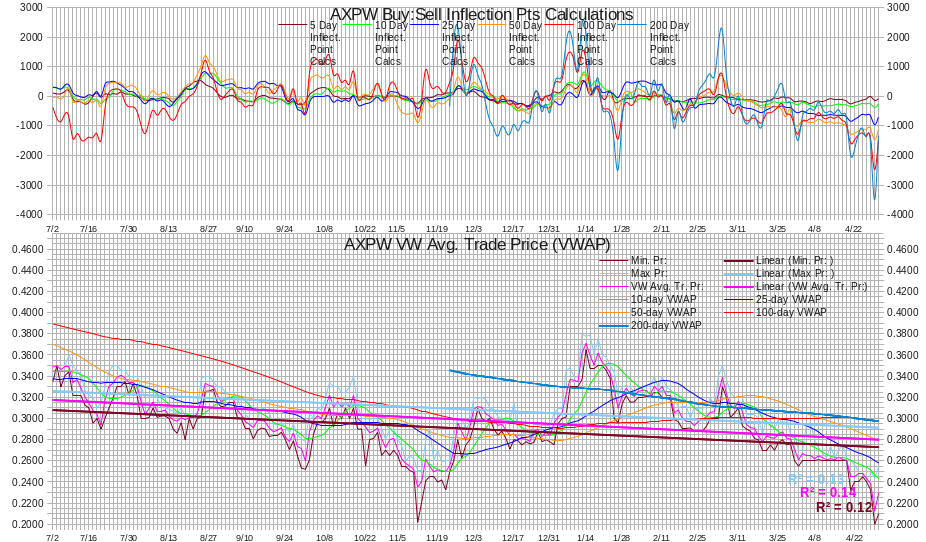
The following is a modified inflection point calculation with a price chart for comparison. Note that the false bullish moves and contrary moves of the 5-day on my original has been eliminated.
The inflection points are calculated differently from the original above. More work to do, this is a start, hopefully.
I've identified some changes I want to try on the new inflection point calculations but haven't had time to implement them yet. I'll work them in over time after a little experimentation.
Comments and further suggestions welcome.
(right-click and open in new tab, position cursor over image to be able to zoom and scroll)
In all the charts above I had to:
- estimate 3/27 buy:sell ratio because I couldn't get ADVFN screen-shots that day,
- omit 3/28 data due to garbage from the ADVFN feed.
- estimate the buy:sell for the first 28 trades of 11/26 as the ADVFN feed did not properly classify then because the bid/ask was missing. I put all the $0.26xx trades below $0.2650 as sells and ones at or above $0.2650 as buys. This was 41% of the days volume, 227,698 shares.
Continuing tracking the "Dly Sht % of 'sells'" and inflection point calculations values are now only in the latest daily comment - attempting to keep things shorter for faster loading.
04/30/2013: EOD stuff partially copied to the concentrator.
# Trds: 67, MinTrSz: 200, MaxTrSz: 101000, Vol 407902, AvTrSz: 6088
Min. Pr: 0.2101, Max Pr: 0.2549, VW Avg. Tr. Pr:0.2300
# Buys, Shares: 39 244035, VW Avg Buy Pr: 0.2312
# Sells, Shares: 25 155867, VW Avg Sell Pr: 0.2287
# Unkn, Shares: 3 8000, VW Avg Unk. Pr: 0.2210
Buy:Sell 1.57:1 (59.8% "buys"), DlyShts 21880 (5.36%), Dly Sht % of 'sells' 14.04%
Well, a good day for several reasons. First, it appears that the combination of the quarterly reporting announcement, apparent near exhaustion of the bigger sellers and low price encouraged investors and/or traders to buy as prices began to recover, being up as much as ~20% intra-day. Even with some typical late-day weakness and maybe at least one big seller (a 101K "buy" made from that seller at $0.23), we saw decent volume, decent buy:sell, decent activity in "negotiation" on the bid/ask and a close of +12.79%.
Along with the 101K "buy", we had a 50K "sell" at $0.24. These two order combined skewed several metrics. The average trade size without them would be 3,834, at the lower range of what I think is retail trading areas. The buy:sell would drop to 1.35:1 (55.7% "buys") and my VWAP would hit $0.2281. But all this is just for a little context and doesn't change my view of a good day. One reason is ...
I captured 24 peeks at changes in the bids and 16 looks at the asks. Nineteen bids were moves up, some due to one price level exhaustion uncovering hidden ones from a particular market-maker. Only 4 were moves lower. On the asks eight were up and 4 were moves lower. In aggregate, a nice change from so many recent days.
The other thing that made it nice is that we got what I expected, which always gives me the "warm fuzzies". Price rebounded to hit above $0.25 during the day and the evidence of big sellers was, at least temporarily, reduced. We still have someone either taking profits or cutting losses or ... but the daily short sales moved back down to what's been more common recently. Since I believed the spike in that during the last few days was linked to one particular seller, I think this says at least that one was not active today.
Another "as expected" (or at least should've been) is topping at previous points of significance during down trends and during churn - $0.25 (12/29/11) , $0.253 (9/28/12), $0.252 (10/1/12), $0.255 (10/22/12, 4/2/13). This tells us that we do have some traders in the market. I'll be looking for signs of more investors in the market going forward.
I'm running late, so I'll stop here and get this and the charts up in the instablog later today.
Details of "Dly Sht % of 'sells'" and inflection points omitted from the concentrator.
Rolling 5-day inflection point calculation aggregate percentage change (now abbreviated):
******* ******* *5 Day** *10 Day * * 25Day ** 50 Day **100Day* 200 Day
04/02 5 Day -0272.87 -0013.47 -0289.62 -1136.10 -0560.90 -0324.10
04/03 5 Day -0459.16 +0049.98 -0390.46 -0597.84 -0417.88 -0260.85
04/04 5 Day -0524.33 -0105.07 -0582.60 -0603.25 -0349.86 -0122.43
04/05 5 Day -0678.86 -0440.28 -0751.67 -1530.15 -0400.68 -0508.48
04/08 5 Day -0112.76 -0515.05 -0542.01 -0370.79 -0068.54 -0383.27
04/09 5 Day -0051.64 -0324.51 -0723.52 -0184.13 +0174.38 -0700.78
04/10 5 Day -0090.99 -0550.15 -0663.32 -0363.83 -0276.88 -0818.75
04/11 5 Day +0217.47 -0306.86 -0415.28 -0254.67 -0174.37 -1000.07
04/12 5 Day +0592.58 -0086.28 -0214.43 -0070.91 -0084.02 -0855.51
04/15 5 Day +0307.69 +0194.93 -0262.98 -0278.18 -0329.85 -0953.90
04/16 5 Day +0197.89 +0146.25 -0064.73 -0434.10 -0615.84 -0938.44
04/17 5 Day +0231.94 +0140.95 -0103.53 -0467.08 -0620.02 -0882.06
04/18 5 Day -0146.72 +0070.75 -0278.12 -0585.89 -1042.04 -1017.25
04/19 5 Day -0613.33 -0020.75 -0553.59 -0911.74 -1351.48 -1101.66
04/22 5 Day -0359.22 -0051.53 -0331.69 -0772.92 -1252.81 -1062.81
04/23 5 Day -0261.83 -0063.94 -0129.06 -0778.07 -1350.62 -0886.95
04/24 5 Day -0053.44 +0178.49 +0137.49 -0482.27 -1148.30 -0722.72
04/25 5 Day +0298.25 +0151.54 +0263.94 -0187.49 -0641.81 -0796.42
04/26 5 Day +0915.23 +0301.90 +0454.21 +0277.98 -0383.99 -0542.97
04/29 5 Day +0388.09 +0028.87 -0178.50 +0026.88 -0829.93 -0157.20
04/30 5 Day +0349.95 +0088.12 -0038.51 +0144.53 -0463.40 +0170.18
Average % change/day, 5 days
____ **5 Day *10 Day *25 Day *50 Day 100 Day 200 Day
03/26 +160.72 +167.40 +203.92 -483.04 +114.61 -187.97
03/27 +132.61 +140.63 +139.70 -511.08 +125.85 -195.90
03/28 +066.23 +102.55 +046.37 -328.58 +061.72 -184.64
04/01 -127.44 -022.35 -118.79 -094.56 -085.50 -191.34
04/02 -106.45 -015.07 -094.53 -004.99 -035.75 -128.62
04/03 -193.66 -032.94 -158.06 +132.16 -062.88 -025.01
04/04 -188.72 -056.10 -165.93 +098.00 -041.49 +032.74
04/05 -183.49 -117.26 -161.45 -255.93 -024.44 -040.47
04/08 +057.91 -069.53 -030.69 +195.60 +114.66 +072.11
04/09 +044.25 -062.21 -086.78 +190.39 +147.05 -075.34
04/10 +073.64 -120.03 -054.57 +046.80 +028.20 -111.58
04/11 +148.36 -040.36 +033.46 +069.71 +035.10 -175.53
04/12 +254.29 +070.80 +107.45 +291.85 +063.33 -069.41
04/15 +084.09 +141.99 +055.81 +018.52 -052.26 -114.13
04/16 +049.90 +094.15 +131.76 -049.99 -158.04 -047.53
04/17 +064.58 +138.22 +111.96 -020.65 -068.63 -012.66
04/18 -072.84 +075.52 +027.43 -066.24 -173.54 -003.44
04/19 -241.18 +013.11 -067.83 -168.17 -253.49 -049.23
04/22 -133.38 -049.29 -013.74 -098.95 -184.59 -021.78
04/23 -091.94 -042.04 -012.86 -068.79 -146.96 +010.30
04/24 -057.08 +007.51 +048.20 -003.04 -105.66 +031.87
04/25 +088.99 +016.16 +108.41 +079.68 +080.05 +044.17
04/26 +305.71 +064.53 +201.56 +237.94 +193.50 +111.74
04/29 +149.46 +016.08 +030.64 +159.96 +084.58 +181.12
04/30 +122.35 +030.41 +018.11 +184.52 +177.44 +211.43
I encourage those with an interest to look at the charts and notice the prior patterns similar to the current one and the resulting price activity.
Dly Sht % of 'sells' values JIC it turns out to be useful...
Wed., 8/01: 2.37% 46.91% 0.00%
Mon., 8/06: 19.99% 33.11% 3.34% 73.89% 33.88%
Mon., 8/13: 25.13% 3.06% 71.64% 50.47% 393.87%
Mon., 8/20: 129.14% 155.71% 899.39% 137.13% 209.19%
Mon., 8/27: 34.71% 61.1% 107.48% 24.28% 104.22%
Tue., 9/4 148.07% 28.40% 16.32% 3.01%
Mon. 9/10: 23.65% 50.20% 26.05% 252.39% 185.99%
Mon. 9/17: 32.74% 12.62% 12.85% 42.25% 42.89%
Mon. 9/24: 5.08% 50.67% 89.56% 9.24% 44.74%
Mon. 10/1: 74.24% 67.10% 517.63% 102.93%
Mon. 10/8: 28.10% 27.40% 11.45% 27.48% 25.32%
Mon. 10/15: 44.06% 17.09% 71.49% 40.64% 139.27%
Mon. 10/22: 194.20% 19.54% 25.53% 15.21% 15.17%
Wed. 10/31: 62.24% 149.46% 39.90%
Mon. 11/05: 30.92% 7.61% 6.98% 3.53% 10.10%
Mon. 11/12: 4.01% 116.57% 30.19% 16.71% 39.58%
Mon. 11/19: 14.90% 3.88% 259.67% T'gvg Day 8.97% (1/2 day)
Mon. 11/26: 65.57% 142.31% 59.83% 11.20% 69.26%
Mon. 12/03: 29.97% 13.19% 10.55% 15.57% 40.42%
Mon. 12/10: 3.59% 9.24% 135.35% 6.19% 12.73%
Mon. 12/17: 26.17% 8.82% 44.97% 3.63% 15.11%
Mon. 12/24: 258.33% 92.71% 31.98% 1.54%
Mon. 12/31: 14.36% H'lday 262.58% 6.39% 131.03%
Mon. 01/07: 45.09% 77.18% 52.53% 36.35% 52.72%
Mon. 01/14: 27.99% 0.70% 48.48% 11.09% 11.21%
Tues. 01/22: 00.26% 23.79% 12.89% 8.36%
Mon. 01/28: 69.26% 42.03% 7.96% 0.00% 28.33%
Mon. 02/04: 17.36% 28.73% 18.53% 12.68% 39.65%
Mon. 02/11: 25.67% 5.99% 16.57% 17.04% 8.23%
Tues. 02/19: 19.57% 19.88% 10.17% 30.54%
Mon. 02/25: 2.88% 55.65% 28.57% 6.95% 0.28%
Mon. 03/04: 100.79% 18.46% 11.55% 21.97% 3.61%
Mon. 03/11: 25.81% 9.64% 1.35% 13.40% 0.00%
Mon. 03/18: 7.10% 5.65% 9.26% 25.15% 9.02%
Mon. 03/25: 1.47% 14.69% 4.15% 25.64%
Mon. 04/01: 4.74% 11.82% 19.85% 3.42% 0.59%
Mon. 04/08: 8.01% 9.51% 13.54% 0.00% 6.62%
Mon. 04/15: 2.68% 8.94% 5.64% 1.67% 18.45%
Mon. 04/22: 0.42% 4.90% 690.95% 39.86% 22.22%
Mon. 04/29: 5.98% 14.04%
Feb Avg: 54.68%, min: 0.35%, max: 200.89%
Mar Avg: 49.86%, min: 0.70%, max: 252.30%
Apr Avg: 31.50%, min: 0.00%, max: 74.35%
May Avg: 62.73%, min: 0.00%, max: 398.94%
Then the Mega-C shares entered market? Note the hefty change in both the averages and maximums.
Jun Avg: Avg: 183.48%, min: 5.05%, max: 1607.50%
Jul Avg: 176.07%, min: 7.75%, max: 1273.20%
Sometime in August I began stating that I thought the larger sellers might be getting exhausted.
Aug Avg: 113.91%, min: 0.00%, max: 899.39%
Sep Avg: 56.67%, min: 3.01%, max: 252.39%
Oct Avg: 85.05%, min: 11.45%, max: 565.73%
Nov Avg: 51.96%, min: 3.53%, max: 259.67%
Dec Avg: 38.72%, min: 1.54%, max: 258.33%
============ 2013 ===============
Jan Avg: 44.20%, min: 0.00%, max: 262.58%
Feb Avg: 20.90%, min: 2.88%, max: 55.65%
Mar Avg: 15.42%, min: 0.00%, max: 100.79%
Apr Avg: 40.63%, min: 0.00%, max: 690.95%
0430 Vol 0407902, Sht 0021880 05.36% LHC 0.2101 0.2549 0.2390 b:s 1.57:10
0429 Vol 1332379, Sht 0051500 03.87% LHC 0.2001 0.2440 0.2119 b:s 1:1.83
0426 Vol 0133648, Sht 0016000 11.97% LHC 0.2324 0.2499 0.2449 b:s 1:1.27
0425 Vol 0191550, Sht 0061000 31.85% LHC 0.2400 0.2500 0.2400 b:s 1:3.97
0424 Vol 0161622, Sht 0067022 41.47% LHC 0.2450 0.2500 0.2500 b:s 13.29:1
0423 Vol 0070533, Sht 0000833 01.18% LHC 0.2401 0.2500 0.2500 b:s 3.15:1
0422 Vol 0240850, Sht 0000550 00.23% LHC 0.2400 0.2559 0.2401 b:s 1:1.20
0419 Vol 0515507, Sht 0078791 15.28% LHC 0.2321 0.2603 0.2450 b:s 1:4.83
0418 Vol 0375500, Sht 0004500 01.20% LHC 0.2600 0.2625 0.2600 b:s 1:136.86
0417 Vol 0115060, Sht 0005275 04.58% LHC 0.2600 0.2750 0.2600 b:s 1:4.35
0416 Vol 0161636, Sht 0009600 05.94% LHC 0.2601 0.2700 0.2601 b:s 1:1.98
0415 Vol 0253015, Sht 0005800 02.29% LHC 0.2600 0.2629 0.2601 b:s 1:5.89
0412 Vol 0091300, Sht 0004500 04.93% LHC 0.2601 0.2739 0.2622 b:s 1:2.92
0411 Vol 0146890, Sht 0000000 00.00% LHC 0.2600 0.2629 0.2604 b:s 1:2.08[60]
0410 Vol 0106016, Sht 0010900 10.28% LHC 0.2605 0.2669 0.2639 b:s 1:3.15
0409 Vol 0217371, Sht 0012500 05.75% LHC 0.2611 0.2725 0.2650 b:s 1:1.53
0408 Vol 0196151, Sht 0011200 05.71% LHC 0.2600 0.2800 0.2600 b:s 1:2.48
0405 Vol 0360500, Sht 0001700 00.47% LHC 0.2600 0.2960 0.2648 b:s 1:4.04
0404 Vol 0446792, Sht 0011884 02.66% LHC 0.2602 0.2950 0.2855 b:s 1:3.52
0403 Vol 0100000, Sht 0010300 10.30% LHC 0.2600 0.2699 0.2675 b:s 1:1.08
0402 Vol 0262385, Sht 0024245 09.24% LHC 0.2550 0.2699 0.2650 b:s 1:3.58
0401 Vol 0323220, Sht 0014100 04.36% LHC 0.2600 0.2849 0.2800 b:s 1:11.63
0328 Vol 0101815, Sht 0015000 14.73% LHC 0.2760 0.2850 0.2849 b:s 1:1.35
0327 Vol 0192540, Sht 0006500 03.38% LHC 0.2751 0.3000 0.2889 b:s 1:4.37
0326 Vol 0089377, Sht 0005977 06.69% LHC 0.2800 0.2950 0.2899 b:s 1.20:1
0325 Vol 0355680, Sht 0004000 01.12% LHC 0.2771 0.3000 0.2800 b:s 1:3.26
0322 Vol 0197489, Sht 0003700 01.87% LHC 0.2700 0.2895 0.2890 b:s 3.57:1
0321 Vol 0314345, Sht 0035494 11.29% LHC 0.2750 0.2979 0.2750 b:s 1.23:1
0320 Vol 0399349, Sht 0021150 05.30% LHC 0.2700 0.3000 0.2939 b:s 1:1.34
0319 Vol 0357598, Sht 0014793 04.14% LHC 0.2700 0.2851 0.2750 b:s 1:2.74
0318 Vol 0204330, Sht 0010830 05.30% LHC 0.2800 0.2999 0.2894 b:s 1:2.94
0315 Vol 0210470, Sht 0000000 00.00% LHC 0.2810 0.3039 0.2950 b:s 1:7.02
0314 Vol 0183300, Sht 0019000 10.37% LHC 0.2880 0.3040 0.2880 b:s 1:3.42
0312 Vol 0193325, Sht 0013720 07.10% LHC 0.2931 0.3194 0.3000 b:s 1:2.79
0311 Vol 0043325, Sht 0004000 09.23% LHC 0.3100 0.3197 0.3195 b:s 1.80:1
0308 Vol 0136805, Sht 0004160 03.04% LHC 0.3050 0.3198 0.3198 b:s 1:5.39
0307 Vol 0170660, Sht 0029125 17.07% LHC 0.3010 0.3250 0.3050 b:s 1:2.62[59]
0306 Vol 0143208, Sht 0010604 07.40% LHC 0.3200 0.3369 0.3200 b:s 1:2.92
0305 Vol 0225324, Sht 0030291 13.44% LHC 0.3300 0.3500 0.3345 b:s 1:2.68
0304 Vol 0304233, Sht 0043363 14.25% LHC 0.3000 0.3100 0.3099 b:s 1:2.80
0301 Vol 0097540, Sht 0000200 00.21% LHC 0.3002 0.3400 0.3350 b:s 6.07:1
0228 Vol 0077100, Sht 0004550 05.90% LHC 0.3000 0.3200 0.3001 b:s 1:5.65
0227 Vol 0132545, Sht 0020429 15.41% LHC 0.2926 0.3109 0.3100 b:s 1:1.17
0226 Vol 0044241, Sht 0012740 28.80% LHC 0.2880 0.3095 0.2926 b:s 1:1.07
0225 Vol 0073600, Sht 0002000 02.72% LHC 0.2890 0.3089 0.2900 b:s 1:17.38
0222 Vol 0115700, Sht 0020000 17.29% LHC 0.2880 0.3108 0.2990 b:s 1:1.63
0221 Vol 0020650, Sht 0002100 10.17% LHC 0.2911 0.3001 0.3001 b:s 0:20650
0220 Vol 0108250, Sht 0016350 15.10% LHC 0.2910 0.3109 0.2910 b:s 1:3.16
0219 Vol 0255826, Sht 0033217 12.98% LHC 0.2910 0.3109 0.3000 b:s 1:2.14
0215 Vol 0114625, Sht 0005030 04.39% LHC 0.2970 0.3100 0.3100 b:s 1:1.14
0214 Vol 0450402, Sht 0037600 08.35% LHC 0.2990 0.3240 0.3000 b:s 1:1.71
0213 Vol 0247690, Sht 0033300 13.44% LHC 0.3200 0.3270 0.3200 b:s 1:5.48
0212 Vol 0269141, Sht 0012439 04.62% LHC 0.3200 0.3300 0.3200 b:s 1:3.37
0211 Vol 0262950, Sht 0039950 15.19% LHC 0.3200 0.3395 0.3300 b:s 1:1.45
0208 Vol 0170389, Sht 0022205 13.03% LHC 0.3246 0.3289 0.3260 b:s 2.04:1
0207 Vol 0147700, Sht 0007700 05.21% LHC 0.3250 0.3395 0.3269 b:s 1.43:1
0206 Vol 0078900, Sht 0009350 11.85% LHC 0.3210 0.3300 0.3300 b:s 1:1.77
0205 Vol 0075565, Sht 0011465 15.17% LHC 0.3204 0.3300 0.3235 b:s 1:1.12
0204 Vol 0211835, Sht 0013500 06.37% LHC 0.3200 0.3289 0.3288 b:s 1.72:1
0201 Vol 0247850, Sht 0026400 10.65% LHC 0.3200 0.3295 0.3245 b:s 1.66:1
0131 Vol 0063453, Sht 0000000 00.00% LHC 0.3156 0.3240 0.3200 b:s 1.29:1
0130 Vol 0159470, Sht 0008500 05.33% LHC 0.3155 0.3300 0.3199 b:s 1:2.02
0129 Vol 0145105, Sht 0014627 10.08% LHC 0.3216 0.3311 0.3290 b:s 3.17:1
0128 Vol 0094400, Sht 0018700 19.81% LHC 0.3140 0.3300 0.3250 b:s 2.50:1
0125 Vol 0473350, Sht 0027500 05.81% LHC 0.2960 0.3220 0.3140 b:s 1:2.28
0124 Vol 0416640, Sht 0033450 13.76% LHC 0.3000 0.3440 0.3222 b:s 1:1.67
0123 Vol 0210763, Sht 0029000 13.76% LHC 0.3380 0.3500 0.3440 b:s 1:1.55
0122 Vol 0257760, Sht 0000660 00.26% LHC 0.3456 0.3579 0.3500 b:s 1.04:1
0118 Vol 0278075, Sht 0020530 07.38% LHC 0.3500 0.3600 0.3585 b:s 1:1.93
0117 Vol 0439978, Sht 0029800 0.0677% LHC 0.3505 0.3757 0.3600 b:s 1:1.60
0116 Vol 1005050, Sht 0033500 03.33% LHC 0.3475 0.3600 0.3550 b:s 13.5:1
0115 Vol 0943341, Sht 0005957 05.96% LHC 0.3470 0.3789 0.3551 b:s 1:9.74
[59] Two pre-market trades totaling 12.5K are not included in FINRA-reported data. Adding these to the day's volume yields a short percentage of 15.9%. If it's also added to the short sales, the percentage goes to 22.73%.
[60] An AH 50K trade is not included in the FINRA data. Including that in the volume has no effect because reported short sales were zero. If we also include it in short sales, the short percentage moves to 25.39%. However, with the recent daily short sales so low, there's no reason to believe these were a short sale.
04/29/2013: EOD stuff partially copied to the concentrator.
# Trds: 174, MinTrSz: 300, MaxTrSz: 185191, Vol 1332379, AvTrSz: 7657
Min. Pr: 0.2001, Max Pr: 0.3440, VW Avg. Tr. Pr: 0.2125
# Buys, Shares: 78 470674, VW Avg Buy Pr: 0.2149
# Sells, Shares: 96 861705, VW Avg Sell Pr: 0.2112
# Unkn, Shares: 0 0, VW Avg Unk. Pr: 0.0000
Buy:Sell 1:1.83 (35.3% "buys"), DlyShts 51500 (3.87%), Dly Sht % of 'sells' 5.98%
Daily short sales were again relatively high, compared to the trend of the last couple months, at 51.5K. Because of the high trade volume, the percentage was quite low though. I'm guessing that the source of the daily short sales were what I guessed previously - some shares from a bigger seller that were traded through a market-maker not controlled by the broker at which the shares were held.
Just for some context, average trade size, which is near the high end of what I believe is typical retail trading, was influenced by a single trade of ~185.2K (13.9%, ~1/7th, of day's volume). Removing this trade would give us 6,631 average trade size, which I think is at the high side of the retail mid-range. That would also put the buy:sell to 1:1.44 (41% "buys") and move average trade price to $0.2143.
We managed to penetrate the low from 11/12/12, $0.2018. We also had more than triple the volume. In November, we had an immediate rebound and began our grind up. But this time we do have concerns about financing, the possibility that our big sellers are not yet done, and disgruntlement with managements (lack of) managing investors' expectations.
Thinking of the larger offers seen recently, the volume spike today, the price action and EOM, I suspect the selling pressure will abate today or tomorrow. I could be wrong, but the likelihood seems high to me.
With today's exceptional volume, there's no point in looking at my experimental stuff - weakness shown all around on the experimental inflection point calculations. The only positive is that average trades size, using either number above, is still within the up trend.
Details of "Dly Sht % of 'sells'" and inflection points included in the latest daily post above.
04/26/2013: EOD stuff partially copied to the concentrator.
# Trds: 25, MinTrSz: 448, MaxTrSz: 16000, Vol 133648, AvTrSz: 5346
Min. Pr: 0.2324, Max Pr: 0.2499, VW Avg. Tr. Pr:0.2382
# Buys, Shares: 14 56648, VW Avg Buy Pr: 0.2400
# Sells, Shares: 10 72000, VW Avg Sell Pr: 0.2366
# Unkn, Shares: 1 5000, VW Avg Unk. Pr: 0.2400
Buy:Sell 1:1.27 (42.4% "buys"), DlyShts 16000 (11.97%), Dly Sht % of 'sells' 22.22%
As we know from recent comments in the APC, assuming no subterfuge, one of our bigger sellers (apparently) was out Friday and will be out today (update: maybe not out today - posted a comment in the APC). As I suggested, the short volume and percentage dropped. I suspect this is because those shares that caused the spike in the daily short sales were sold through a market-maker that was not affiliated with the broker that held the shares. So I expect low daily short sales again today, maybe along with continued-low volume. A nice side-effect was seeing the buy percentage come somewhere near normal again although I suspect it will again plummet Tuesday, unless there's some nice PR issued.
Meanwhile, the average trade size continues its trend of creeping up and "trying" to stay in the trend of increasing back to normal ranges. Today finished within the up trend and right in the middle of what I think is retail sizes.
Since we have at least one apparently known big seller that will return tomorrow and one (at least?) still active through ATDF (and maybe other MMs), I don't see much value in even commenting beyond what I stated above, so no more today.
Details of "Dly Sht % of 'sells'" and inflection points are in the latest daily post above.
04/25/2013: EOD stuff partially copied to the concentrator.
# Trds: 31, MinTrSz: 500, MaxTrSz: 50000, Vol 191550, AvTrSz: 6179
Min. Pr: 0.2400, Max Pr: 0.2500, VW Avg. Tr. Pr: 0.2431
# Buys, Shares: 17 38527, VW Avg Buy Pr: 0.2482
# Sells, Shares: 14 153023, VW Avg Sell Pr: 0.2418
# Unkn, Shares: 0 0, VW Avg Unk. Pr: 0.0000
Buy:Sell 1:3.97 (20.1% "buys"), DlyShts 61000 (31.85%), Dly Sht % of 'sells' 39.86%
As we all know by know, there's one or more sellers with a relatively large position they are trying to exit. Today saw continued evidence of this in both a normal and somewhat abnormal (relative to prior recent behavior) behavior.
The abnormal behavior was that on ATDF we saw the 100K seller jostling with another seller that works in 10K increments to be first on the ask. This had the predictable effect of acting like yesterday (4/24): pushing the asks lower throughout the day until finally the bids began to respond to that. Ask started the day at $0.25 and eventually worked down to $0.245 at 14:17, where it stayed until after 15:00 when it was back up to $0.25 at 15:39 when I took another peek. The bids yesterday responded appropriately, starting in the $0.245x range and hit $0.2402 at 12:37, when I peeked, rose back into the $0.245-$0.246 area, where they stayed until my peeks at 14:17 ($0.2401) and 15:39 ($0.2401). Recall that at 15:39 we had 98.8K @ VWAP of $0.2488, all "sells" or "unknowns".
Today the asks began better, starting at $0.2499 and holding there (likely due to the very low volume until ...), rising to $0.2573 around 14:10 (very briefly) and dropped to $0.2498 when I peeked at 14:53. The the battle of the offers began in earnest with $0.2497 offered at 15:05 followed by steps down relatively quickly to hit $0.245 and $0.246 around 15:30, after which it held at $0.2489 for the last 15 minutes of the day. In 15 seconds, 15:45:52 to 15:46:07, 106.7K shares traded at a VWAP of $0.2402, just off the day's low of $0.24.
The normal behavior, regardless of the presence of the 100K seller, was the late-day weakness in price. We've been seeing this for months now. A lack of this for a few days running might signal some chance for appreciation, as would not seeing ATDF constantly battling for a front row seat on the offering side.
This is also the second day with a much larger than recently normal volume, and percentage, of daily short sales. Me current belief is that the 100K seller has shares at a broker that feeds them to ATDF, likely because they don't have their own captive MM desk or ...
When will it end? Here's a swag if you want to get some shares while the price is low. Recall that recently (last week?) we had an early glimpse of 400K on the offer side (at much higher prices then too!) on ATDF. We can't tell if this was a single seller or an aggregate of multiple sellers that had the same price. I'm assuming that there's at least 400K still in one or more hands that want to be out around EOM. So I think there's a good chance that it ends next week (maybe Tuesday or Wednesday?). One of the acknowledged sellers stated they would be out of pocket until Tuesday, at which time I assume his selling would resume. There's also an emotional component now, if his commentary is reflecting how he will behave. So that could bring even lower prices.
I have a little dry powder not working other areas and I will pull the trigger if I see the mentioned $0.15. I consider that unlikely unless the bottom-feeders here enter a near-hibernation state. There's just too many folks that will see excellent risk/reward with prices down in these areas and hibernators will be stepped over on the way to the buying window. But it will not be a rush while the sellers remain relatively undisciplined.
Meanwhile, back at the ranch. Average trade size remains up in the middle of what I think is retail (two days in a row near the middle) and buy:sell dropped as buyers recognized the sellers' fingerprints and properly worked the "crime scene".
My original experimental inflection point calculations still suggest that downward pressure is slowly weakening (but based on the above, you can see that could change rapidly) and the newer version is still suggesting "flat", but with some weakness in the longer-term calculations as the volume weakens in combination with other things and can't influence the longer-term trends as strongly. This could break the pattern that suggested "flat". So keep an eye out for that.
Details of "Dly Sht % of 'sells'" and inflection points are in the latest daily post above.
04/24/2013: EOD stuff partially copied to the concentrator.
# Trds: 30, MinTrSz: 200, MaxTrSz: 64522, Vol 161622, AvTrSz: 5387
Min. Pr: 0.2450, Max Pr: 0.2500, VW Avg. Tr. Pr: 0.2478
# Buys, Shares: 23 128922, VW Avg Buy Pr: 0.2485
# Sells, Shares: 4 9700, VW Avg Sell Pr: 0.2453
# Unkn, Shares: 3 23000, VW Avg Unk. Pr: 0.2450
Buy:Sell 13.29:1 (79.8% "buys"), DlyShts 67022 (41.47%), Dly Sht % of 'sells' 690.95%
Things of note today, other than we indeed seem to be doing "flat": short volume and percentage; buy:sell says lots of folks see this as low-risk entry point and/or expect very good news; "Dly Sht % of 'sells'" is in an area not seen for months (the "big seller(s)" today were shorting to buyers, not hitting the bid), the short volume was very close to the largest block trade today of 64.5K (a "buy" @ $0.25); price spread is very narrow; volume more than doubled yesterday's; average trade size (affected by that big trade) moved back into the rising trend range I've been noting, today it's at mid-range of what I think is retail.
The fourth consecutive day of improving buy percentage has begun to affect the 5 and 10-day averages. I'm expecting this to continue, likely haltingly.
My original experimental inflection point calculations continue to show a reduction in the weakness. Patterns are starting to form that may lead to an indication of price moving up. As usual, it's early though and the patterns haven't formed up yet. On the newer version, which considers additional factors, it's even more so. However, it's still just a "flat" indication until the patterns form up a bit better over time.
Details of "Dly Sht % of 'sells'" and inflection points are in the latest daily post above.
04/23/2013: EOD stuff partially copied to the concentrator.
# Trds: 23, MinTrSz: 150, MaxTrSz: 9300, Vol 70533, AvTrSz: 3067
Min. Pr: 0.2401, Max Pr: 0.2500, VW Avg. Tr. Pr: 0.2484
# Buys, Shares: 18 53533, VW Avg Buy Pr: 0.2499
# Sells, Shares: 5 17000, VW Avg Sell Pr: 0.2437
# Unkn, Shares: 0 0, VW Avg Unk. Pr: 0.0000
Buy:Sell 3.15:1 (75.9% "buys"), DlyShts 833 (01.18%), Dly Sht % of 'sells' 4.90%
Average trade size dropped to the very lower end of what I think is retail today, but after the price and volume action of the prior two days, I wouldn't consider this a break in the generally rising trend ... yet. This seems reasonable, too, in light of what I think is relatively good price and buy:sell action after the step down we just came through.
I also see support in the movement of the bids and asks throughout the day. Yes, the trades were few and the volume was low, but the tendency looked quite positive to me. Of the ten changes in bids that I caught from pre-market (8:02) to the close, seven were increases in the bid and three were down (keep in mind that at the close many bids are withdrawn and lower bid are exposed - maybe two reduced instances would be a better number). The asks were really very stable today. Only three changes were noted in the same period, with one an increase in ask price, one a decrease and one unchanged.
Buy:sell has made enough of a recovery over the last three days such that the 10 and 25-day buy percentage averages have begun to show improvement. Of course, those values were so low and far out of trend that we shouldn't start doing any handsprings yet. Small improvement have out-sized effects under these conditions.
If this sort of behavior in the bids and asks continues, and the buy:sell stays in more normal ranges, I think we can look forward to some price increase. However, I would not make that judgment on one day's action and low number of trades and volume, especially since my newer inflection point calculations began formation of a pattern yesterday that, if it continues, suggested "flat" action in the past. I think today is just a start of some consolidation. But it's still positive compared to what we've been seeing. The key will be the action as we exit it, of course. And there's a possibility we won't exit it until some announcement from Axion appears. In light of recent action, having the fire doors locked may be a really good thing.
My original inflection point calculations, as we could expect from the above, has the three shortest periods indicating a reduction in weakness while the longer ones just go "ho-hum - keep on keepin' on". The newer version, as mentioned, shows the same and continues a pattern formation that has suggested flat action in the past.
Details of "Dly Sht % of 'sells'" and inflection points are in the latest daily post above.
04/22/2013: EOD stuff partially copied to the concentrator.
# Trds: 30, MinTrSz: 500, MaxTrSz: 84500, Vol 240850, AvTrSz: 8028
Min. Pr: 0.2400, Max Pr: 0.2559, VW Avg. Tr. Pr: 0.2448
# Buys, Shares: 15 109550, VW Avg Buy Pr: 0.2499
# Sells, Shares: 15 131300, VW Avg Sell Pr: 0.2405
# Unkn, Shares: 0 0, VW Avg Unk. Pr: 0.0000
Buy:Sell 1:1.20 (45.5% "buys"), DlyShts 550 (00.23%), Dly Sht % of 'sells' 0.42%
Average trades size was influenced by an 84.5K trade, 31.5% of day's volume. With this trade, it put us in what I think is the upper range of retail. Without it, we would have been at 5391, what I think is mid-range of retail. Even with this latter value, it continues the trend of generally increasing average trade size within the trend lines on my chart, which may bode well for price appreciation a bit down the road.
Since this trade, and the other two associated with it (they were RuggedDC's trades) were "sells", they also influenced the buy:sell ratio. Just removing them from the "sell" total moves buy:sell to 3.50:1. Nice to think about, but I don't think a one-day improvement of that magnitude for that reason should be given any weight. Just nice to know some context is all.
On my original experimental inflection point calculations, nothing to comment on, really. As we could expect from today's action, the five-day stops it's descent while the longer-term ones, except one, continue to show weakness, Interestingly, to me, is that the newer version, which was intended to ameliorate the "flakiness" of the original and consider other factors to get better reliability, has all periods making a "flip up". In this particular configuration it doesn't, based on minimal experience so far, suggest an up trend, but does suggest going sideways. My quick perusal of that chart suggests it is fairly reliable in this suggestion. It doesn't suggest duration though, AFAICT.
Details of "Dly Sht % of 'sells'" and inflection points are in the latest daily pot above.
04/19/2013: EOD stuff partially copied to the concentrator.
# Trds: 80, MinTrSz: 150, MaxTrSz: 57165, Vol 515507, AvTrSz: 6444
Min. Pr: 0.2321, Max Pr: 0.2603, VW Avg. Tr. Pr: 0.2455
# Buys, Shares: 22 88495, VW Avg Buy Pr: 0.2455
# Sells, Shares: 58 427012, VW Avg Sell Pr: 0.2456
# Unkn, Shares: 0 0, VW Avg Unk. Pr: 0.0000
Buy:Sell 1:4.83 (17.2% "buys"), DlyShts 78791 (15.28%), Dly Sht % of 'sells' 18.45%
Yesterday I said "If I was doing good old traditional TA, which I'm not. I would be watching to see if this was "end of trend" suggested by the volume and long flat price trend. But in light of recent behavior, no such guess is forthcoming from me right now".
Well, missed my chance to look like a genius I guess because the flat trend was decisively broken today. With "feeling" too - volume was above all my averages, 10, 25, 50 and 100-day, in thousands: 215, 243, 204 and 292 respectively. And just for fun, I did a 200-day SMA which came in at ~324.6K. Today's volume is the highest since the 1MM+ of 1/16!
Average trades size was right in the high-middle of what I think is retail and above all but the 10-day average, where it was almost exactly a match to that 6,473. This was influenced by six larger trades accounting for 175,257 shares, 34% of the days volume. Excluding those yielded an average size of 4,598, what I think is mid-range for retail.
Since our peak VWAP of $0.3710 1/14 at the end of our grind up, and the start of our grind down, we have traded 15,305,660 shares. Interesting is that the number of shares traded during our grind up, which began when the VWAP nadir of $0.2352 on 11/12/2012 occurred, is 15,899,640.
Hm? Coinky-dink? 15.3MM vs 15.9MM? Methinks no coinky-dink exists there!
Anybody got the guts to call the start of a grind up now? I don't! How 'bout the near-term bottom? Anyone? From this I draw the conclusion that we had lots of traders in the stock and/or not near as many "strong hands" as we had envisioned. Makes me feel somewhat foolish for only trading a few small trading blocks I had allocated. And maybe for sharing my data and thoughts so easily too.
I'm going to have to consider that last item.
Another interesting, to me, item is the start of the reduced daily short sales. This was brought to mind by today's relatively large (compared to recent values) percentage. Looking at my charts we see the drop off in daily short sales appeared around the 1/14 time-frame. Another coinky-dink? Maybe. But I tend to side with Leroy Jethro Gibbs here too. It may be nothing, but ...
Wrapping up, my original inflection point calculations which I mentioned were suggesting flat and/or weakening and were disorganized, are no longer disorganized. They achieved the state now where I watch for signals of an uptrend to start. My newer version is in the same state - now I watch for a turn.
Details of "Dly Sht % of 'sells'" and inflection points in the latest daily post above.
04/18/2013: EOD stuff partially copied to the concentrator.
# Trds: 31, MinTrSz: 80, MaxTrSz: 30000, Vol 295580, AvTrSz: 9535
Min. Pr: 0.2600, Max Pr: 0.2625, VW Avg. Tr. Pr: 0.2604
# Buys, Shares: 1 1970, VW Avg Buy Pr: 0.2600
# Sells, Shares: 29 269610, VW Avg Sell Pr: 0.2602
# Unkn, Shares: 1 24000, VW Avg Unk. Pr: 0.2625
Buy:Sell 1:136.86 (00.67% "buys"), DlyShts 4500 (1.20%), Dly Sht % of 'sells' 1.67%
One trade today was a "buy". Three of the last six days have had increasingly larger average trade sizes. We are still in a trend of increasing sizes, as evident on my chart. Today the average trade size is at the high side of what I consider to be typical retail range. This is explained by the following trades, all but the one priced at $0.2625 being "sells" and that one being "unknown". All after 11:56 A.M.:
$0.2600 10000, $0.2600 16920, $0.2602 22500, $0.2600 23030, $0.2600 23100, $0.2625 24000, $0.2602 24900, $0.2602 24900, $0.2605 25000, $0.2600 25000 and $0.2610 30000.
These trades were 84.36% of the day's volume and 35.5% of the number of trades for the day. You can see this also explains the "buy" percentage being less than 1%. All but two trades "hit the bid", representing 269,610 shares released into and taken from the market. Under this scenario I assume price was not a major factor in the sellers' decisions, continuing the trend we've been watching.
The movement of bids and asks during the day were balanced with about half up and half down on both at the times I peeked.
If I was doing good old traditional TA, which I'm not. I would be watching to see if this was "end of trend" suggested by the volume and long flat price trend. But in light of recent behavior, no such guess is forthcoming from me right now.
Details of "Dly Sht % of 'sells'" and inflection points omitted from the concentrator.
04/16/2013: EOD stuff partially copied to the concentrator.
# Trds: 31, MinTrSz: 371, MaxTrSz: 40000, Vol 161636, AvTrSz: 5214
Min. Pr: 0.2601, Max Pr: 0.2700, VW Avg. Tr. Pr:0.2634
# Buys, Shares: 16 54196, VW Avg Buy Pr: 0.2659
# Sells, Shares: 15 107440, VW Avg Sell Pr: 0.2621
# Unkn, Shares: 0 0, VW Avg Unk. Pr: 0.0000
Buy:Sell 1:1.98 (33.5% "buys"), DlyShts 9600 (05.94%), Dly Sht % of 'sells' 8.94%
Average trade size continues to be in an upward trend and with only one larger trade today - our 3 largest trades were 40K, 23K and 10K. Today we're smack in the middle of what I think is retail size and in the area of all the averages and the long-term calculated trend. If this keeps up, I might have to read something into it.
You can see from the number of buy and sell trades, and their VWAPs and volumes, that the sellers and buyers were not far out of balance today. This seems supported by the bid ticks up and down, at the times I checked today, being fairly balanced - 4:3 in favor of up ticks. Asks favored down ticks - five down, three up and one unchanged.
VWAP is holding steady: $0.2647, $0.2630, $0.2610, $0.2620, $0.2610 and $0.2634. Our five and 10-day averages are $0.2621 and $0.2635 respectively. Note too the buy and sell five-day VWAPs vs. their averages: $0.2642 and $0.2613 respectively. The daily values have been hanging right around their five-day averages, slightly up and down, for the last week or so.
All of the above, combined with low volume, makes me think of "basing". The trouble is we don't yet see strong trend evidence of the sellers being exhausted with the buy and sell five-day average percentages running at 26.02% and 73.98% respectively.
Details of "Dly Sht % of 'sells'" and inflection points are in the latest daily post above.
04/15/2013: EOD stuff partially copied to the concentrator.
# Trds: 27, MinTrSz: 100, MaxTrSz: 67000, Vol 253015, AvTrSz: 9371
Min. Pr: 0.2600, Max Pr: 0.2629, VW Avg. Tr. Pr:0.2610
# Buys, Shares: 5 36700, VW Avg Buy Pr: 0.2629
# Sells, Shares: 22 216315, VW Avg Sell Pr: 0.2607
# Unkn, Shares: 0 0, VW Avg Unk. Pr: 0.0000
Buy:Sell 1:5.89 (14.5% "buys"), DlyShts 5800 (2.29%), Dly Sht % of 'sells' 2.68%
Since today's average trade size is above what I believe to be "retail", I wanted to highlight that we had one really abnormally large trade and a few more abnormally large trades today, just to provide a little context. If you don't want to read the comments, we had 5 trades (out of 27 for the day) totaling 169.1K, 66.8% of day's volume, at a VWAP of $0.2609. Excluding those, which is not reasonable of course, we had 83915 shares traded at a VWAP of $0.2613.
I wanted to note that our asks and bids have been holding fairly steady, overall, the last many days and the price weakness is almost exclusively the result of sellers hitting the bids. This can be seen in the recent high "sell" percentages since 3/20: 57.22, 44.82, 20.78, 76.55, 45.52, 81.38, 57.46, 92.08, 78.17, 51.90, 77.89, 80.17, 71.25, 60.50, 75.92, 67.55, 74.48 and 85.49. As to the effect of the bids holding up recently, this appears in the VWAPs from 4/2 onward: $0.2610, $0.2669, $0.2655, $0.2653, $0.2620, $0.2647, $0.2630, $0.2610, $0.2620 and $0.2610. The average over this 10-day period is $0.2632. We mustn't overlook that some of this is from folks hitting the ask too.
Which way we'll break from this trend is unpredictable, IMO, because of the apparently common feeling that everybody, except the sellers, is awaiting the capital raise news. Some feel the longer we go, the more positive because management wouldn't cut it too close and must have a decent deal in-hand. Others are much less positive and are expecting a raise yet to come that will be geared to some period's average price of some type, with a discount applied.
My original experimental inflection point calculations continue to be disorganized, suggesting noting but more of the same for now. The newer version is better with the three near-term calculations saying "flat" and the longer-term ones showing a slight weakening at the moment.
Details of "Dly Sht % of 'sells'" and inflection points are in the latest daily post above.
04/12/2013: EOD stuff partially copied to the concentrator.
# Trds: 17, MinTrSz: 300, MaxTrSz: 19500, Vol 91300, AvTrSz: 5371
Min. Pr: 0.2601, Max Pr: 0.2739, VW Avg. Tr. Pr: 0.2620
# Buys, Shares: 6 23300, VW Avg Buy Pr: 0.2658
# Sells, Shares: 11 68000, VW Avg Sell Pr: 0.2607
# Unkn, Shares: 0 0, VW Avg Unk. Pr: 0.0000
Buy:Sell 1:2.92 (25.5% "buys"), 4500 (4.93%), Dly Sht % of 'sells' 6.62%
Average trade size continues to be in a rising trend, seen on the instablog charts. Today it was smack in the middle of what I believe to be average retail size. Do keep in mind though that volume was very low, second only to the 89.38K of 3/26 in recent trading, and there were only 17 trades for the day. This means we can't really evaluate whether or not it is saying anything today.
The buy percentage continues low but has not yet broken the slowly rising trend it has been in. How slowly rising? Even though it has been "trending" for nine days, not one of the averages I plot are ticking up with authority yet. The best is the 25-day average, which has been essentially flat for 3 whole days.
I've already mentioned the low volume. Add in that VWAP could be charitably described as weakening in a range of flat: $0.2707, $0.2610, $0.2669, $0.2655, $0.2653, $0.2620, $0.2647, $0.2630, $0.2610 and $0.2620. For some context, intra-day VWAP averages for 5, 10, 25 and 50-day periods respectively: $0.2625, $0.2642, $0.2797 and $0.2971. Not positive, to say the least.
The bids trended up throughout the day, but the low volume, again, suggests we should not place a lot of weight on this activity. Anyway, from before market open when bid was $0.25 through the last peek at 14:43, the bid stepped up 6 of the eight instances I recorded, with the remaining two unchanged. Asks were mixed with the BMO (before market open) offer seen of $0.275 going to $0.2605 at the open and moving up three more times and down four more times during the day and ending at $0.2629 on my last intra-day peek at 14:43. The high seen, and it was traded for 300 shares, was $0.2739 at 12:17.
On my original experimental inflection point calculations, the short-term (5, 10 and 25-day periods) continue to suggest a reduction in the rate of weakening of the buy:sell ratio. The longer-term ones are suggesting the opposite. This is what I call disorganized. On my newer version, intended to be less flaky and to be sensitive to other factors as well, all periods are going "flat", suggesting a reduction in the weakening. The conditions are best comprehended looking at the charts. For both the original and newer versions though, keep the volume in mind. Both are volume-sensitive and smaller volumes make what they show much less reliable.
Details of "Dly Sht % of 'sells'" and inflection points are in the latest daily post above.
04/11/2013: EOD stuff partially copied to the concentrator.
# Trds: 23, MinTrSz: 400, MaxTrSz: 50000, Vol 196890, AvTrSz: 8560
Min. Pr: 0.2600, Max Pr: 0.2629, VW Avg. Tr. Pr: 0.2610
# Buys, Shares: 12 63900, VW Avg Buy Pr: 0.2622
# Sells, Shares: 11 132990,VW Avg Sell Pr: 0.2605
# Unkn, Shares: 0 0,VW Avg Unk. Pr: 0.0000
Buy:Sell 1:2.08 (32.5% "buys"), DlyShts 0 (00.00%), Dly Sht % of 'sells' 0.00%
An AH 50K trade is not included in the FINRA data. Including that in the volume has no effect because reported short sales were zero. If we also include it in short sales, the short percentage moves to 25.39%. However, with the recent daily short sales so low, there's no reason to believe these were a short sale.
Without that trade, buy:sell would be 43.5% "buys" and the average trade size would be in the upper-mid range of what I believe is "retail". With it the average trade size is above what I believe to be typical retail sizes. Is all this a result of the "last gasp" exit by the sellers? Recall yesterday I suspected we might hit $0.25xx today. Didn't quite make it, but not from lack of trying. You can see from the buys and sells lines above that the sellers hit the bids with large trades, as compared to the buys. The sells alone is sufficient to take 2/3rds of the 188K asks we espied from ATDF today. I'd like to think that ends it, but we did see a 39K, and maybe a 120K, offer from UBSS alone today. They may still be out there in the $0.2625/$0.2629 area.
Details of "Dly Sht % of 'sells'" and inflection points are in the latest daily post above.
04/10/2013: EOD stuff partially copied to the concentrator.
# Trds: 27, MinTrSz: 630, MaxTrSz: 20000, Vol 106016, AvTrSz: 3927
Min. Pr: 0.2605, Max Pr: 0.2669, VW Avg. Tr. Pr: 0.2630
# Buys, Shares: 10 25530, VW Avg Buy Pr: 0.2641
# Sells, Shares: 17 80486, VW Avg Sell Pr: 0.2626
# Unkn, Shares: 0 0, VW Avg Unk. Pr: 0.0000
Buy:Sell 1:3.15 (24.1% "buys"), DlyShts 10900 (10.28%), Dly Sht % of 'sells' 13.54%
Still in the same boat. We're getting reducing volume again, VWAP a bit weaker but still "flat", buy percentage retreating a bit again as sellers continue unabated dumping. Average trade size at the lower end of what I think is retail. But it is still in the uptrend denoted by the trend lines I added to my chart, so there's a glimmer of hope there.
My original inflection point calculations gave up a little of the improvement in the shorter-term calculations, but can't say if the improving trend is broken yet or this is just normal variation within trend that started a few days ago. My newer versions are about the same but show slightly less deterioration, as would be expected since one of its purposes was to be a bit less "flaky" than the original.
Of the bids and ask changes I happened to capture, after the open the up and down moves on the bids were evenly split at five each with one unchanged. On the asks it was similar at three each way and four cases of unchanged. The overall trend on the bids was up through around 11:15 and then weakening thereafter. The asks were similar through about 11:00 and then went flat at $0.2639 for almost the whole rest of the day. So today's slight weakening of price came from a change in buyer behavior: they didn't push bids up while the sellers continued to be willing to satisfy folks at reduced prices.
I saw my first signs, after market close, that we might hit $0.25xx today. Nothing strong, but the best bid for a while was in the $0.25 range. Those bids have been there for a long time, but generally the better bids left after close have been above those. This is very ephemeral as far as "signs" go, so I don't know if it deserves any true consideration or not.
Details of "Dly Sht % of 'sells'" and inflection points are in the latest daily post above.
04/09/2013: EOD stuff partially copied to the concentrator.
# Trds: 35, MinTrSz: 741, MaxTrSz: 25000, Vol 217371, AvTrSz: 6211
Min. Pr: 0.2611, Max Pr: 0.2725, VW Avg. Tr. Pr: 0.2647
# Buys, Shares: 18 85871, VW Avg Buy Pr: 0.2672
# Sells, Shares: 17 131500, VW Avg Sell Pr: 0.2631
# Unkn, Shares: 0 0, VW Avg Unk. Pr: 0.0000
Buy:Sell 1:1.53 (39.5% "buys"), DlyShts 12500 (05.75%), Dly Sht % of 'sells' 9.51%
Just want to note that average trade size continues in its uptrend, as I mentioned couple days back. Today end in the mid-high side of what I believe to be "retail". This is more easily discernible on my charts - been moving that way since 3/11. It's not been a really reliable predictor of action going forward, but if you peek at my one-year snapshot, you'll see that our grind up that began last November was accompanied by an improvement in this metric. Not strongly correlated with prior behavior though.
We've now been in this price range long enough that my original inflection point calculations are beginning to show a reduction in the rate of weakening. My newer version indicates this even more strongly.
With VWAP essentially flat the last seven days - $0.2707, $0.2610, $0.2669, $0.2655, $0.2653, $0.2620 and $0.2647 - it's tempting to think we've bottomed. But I'm cautious on that because our determined sellers seem to have an unlimited supply of shares they consider worth much less than current market price.
There's other points that are improving, but we don't know yet if they are a trend or one-day aberrations.
Details of "Dly Sht % of 'sells'" and inflection points in the latest daily post above.
04/08/2013: EOD stuff partially copied to the concentrator.
# Trds: 37, MinTrSz: 100, MaxTrSz: 40000, Vol 196151, AvTrSz: 5301
Min. Pr: 0.2600, Max Pr: 0.2800, VW Avg. Tr. Pr:0.2620
# Buys, Shares: 17 56391, VW Avg Buy Pr: 0.2659
# Sells, Shares: 20 139760, VW Avg Sell Pr: 0.2604
# Unkn, Shares: 0 0, VW Avg Unk. Pr: 0.0000
Buy:Sell 1:2.48 (28.7% "buys"), DlyShts 11200 (5.71%), Dly Sht % of 'sells' 8.01%
Well, I thought maybe we would turn a corner today. Bid ask stayed relatively stable most of the day. The fly in the ointment spoiled my hope: a "big" trade of 37.5K, a "sell" at 11:49 at $0.2602 and two trades late in the day, 10K @ $0.2603 and 40K @ $0.26. Both at 15:59. The other "big" trades today, 13K and 15K, both were also sells at $0.2602. So I'm still awaiting the exhaustion of these folks before diving into any serious analysis and thought.
Details of "Dly Sht % of 'sells'" and inflection points are in the latest daily post above.
04/05/2013: EOD stuff partially copied to the concentrator.
# Trds: 48, MinTrSz: 100, MaxTrSz: 25000, Vol 360500, AvTrSz: 7510
Min. Pr: 0.2600, Max Pr: 0.2960, VW Avg. Tr. Pr: 0.2653
# Buys, Shares: 16 71500, VW Avg Buy Pr: 0.2705
# Sells, Shares: 32 289000, VW Avg Sell Pr: 0.2640
# Unkn, Shares: 0 0, VW Avg Unk. Pr: 0.0000
Buy:Sell 1:4.04 (19.8% "buys"), DlyShts 1700 (00.47%), Dly Sht % of 'sells' 0.59%
Well, we didn't get any follow-through from yesterday's apparent improvement. There was a mild weakening in VWAP, "buys" percentage and volume (this is the "good" part of this action). The big difference today is that buyers did not step up as strongly as yesterday. We opened at $0.2750 and immediately started weakening, hitting $0.2610 on the third trade. I guess buyers saw no reason to increase the bids with that going on. We did come back to $0.2749, but from 10:24 on we never saw a $0.27 handle again.
From then through EOD we traded 262.2K at a (falling) VWAP that ended at $0.2632. During this stretch we had 14 consecutive trades at generally weakening prices, eventually going to $0.2605, that were all "sells".
Of the seventeen instances of bid changes I caught, ten were lowered bids. Over half the rest were improvements only into the low $0.26 area. On the asks nine were lowered offers and only three were raised.
As usual, ATDF was an important part of this action, with others joining in, out of necessity I guess.
I mentioned the volume as the "good" part: falling volume does suggest that some portion of the sellers at these prices are getting exhausted. However with a seeming wellspring of sellers at ever-lower prices, I wonder if they can ever be exhausted.
Details of "Dly Sht % of 'sells'" and inflection points are in the latest daily post above.
04/04/2013: EOD stuff partially copied to the concentrator.
# Trds: 70, MinTrSz: 100, MaxTrSz: 28400, Vol 446792, AvTrSz: 6383
Min. Pr: 0.2602, Max Pr: 0.2950, VW Avg. Tr. Pr: 0.2655
# Buys, Shares: 20 98800, VW Avg Buy Pr: 0.2747
# Sells, Shares: 50 347992, VW Avg Sell Pr: 0.2628
# Unkn, Shares: 0 0, VW Avg Unk. Pr: 0.0000
Buy:Sell 1:3.52 (22.1% "buys"), DlyShts 11884 (02.66%), Dly Sht % of 'sells' 3.42%
Regardless that we got our predicted "death cross" today, with the 50-day SMA at $0.3058 and the 200-day at $0.3063, I'm starting to get optimistic. All the oscillators I watch are suggesting this possibility as well. Regardless, I'm not yet ready to again step deep into the traditional TA.
I've noted the last several days that it looked like things were improving. Today continues that ... to the point that I think our unrelenting selling down may be either ended or very near so. This due to a combination of volume, volatility, strength into the close and no late-day weakness, among other things.
First, we had a strong close. In the last 30 minutes of the day we had VWAP of $0.2703, above our previous short-term support of $0.27 when we churned sideways for a bit, and we had a close of $0.27 if we throw out our wizard's EOD $0.2855 trade. This was on 70K shares too. You might say that this wasn't strength because the VWAP and close were much lower than the day's higher ranges. You'll see in the brackets below that this wasn't bad.
There was some trading action that makes me somewhat optimistic ...
I wondered during the earlier part of the day if we were seeing distribution of that ATDF ~143K offer that WTB(?) and I previously noted.
This seems possible from the stuff I saw through 14:32: buy:sell 1:6.90 (12.65% "buys" -> 87.35% "sells") and VWAP $0.2617, very near the day's low. We've seen this sort of stuff several times before. The difference is in the late-day action. Subsequent to that time, our buy:sell was 1:1.18 (45.9% "buys") with a VWAP of $0.2750. Our typical behavior has been one of late-day weakness and today it was not. This doesn't prove anything, but ...
Although ATDF is only one market-maker (and its clients?), it is so active (and somewhat dominate due to the willingness to always move to best ask and best bid positions, apparently regardless of price) in our market that I felt it was a good proxy for the overall tenor of things. This made me think it was worth noting that a) I had no glimpse on the ask of the ~143K from ATDF today, b) this made me wonder if they were just "hitting the bid" without competing on the asks, and c) the action today might be signaling the end of our extended weakness. I do suspect that ATDF, and some other folks, spent a good part of the day hitting the bid.
Breaking down the action may answer the "just hitting the bid" question (you can derive the "sells"):
$0.2602-$0.2630: 277392 shares, 62.09% of volume, VWAP $0.2608, "buys" 03.61%
$0.2650-$0.2699: 078150 shares, 17.49% of volume, VWAP $0.2674, "buys" 57.65%
$0.2700-$0.2722: 050150 shares, 11.22% of volume, VWAP $0.2714, "buys" 05.28%
$0.2819-$0.2950: 041100 shares, 09.20% of volume, VWAP $0.2861, "buys" 100%
In that first bracket, only 12,200 shares in four trades went off after 14:30. Showing a little strength into EOD, the third bracket, except for one trade, all went off after 15:28 and into the close. The last bracket trades were after 14:42 and continued into the close.
The potential for the end of the downward pressure seems somewhat supported by the ask behavior today. With one brief exception, the asks stayed pretty much in the upper range of the $0.26xx and above area, including some periods in $0.28xx range, running from the low to the high areas of that range. We didn't see anywhere near the usual amount of constant stepping down by various MMs trying to get to the front of the ask. On the bid side, during most of the day the bids stayed in the low-$0.26xx area. But later in the day (after 15:00) we saw some bids move into the high-$0.26xx range and even a couple stints in the low-$0.27xx area. This is a change from the most commonly observed late-day behavior.
Volume of ~437K is more than double the 25-day average of ~211K and well above the 10-day average of ~237K. It's more than four times yesterday's 100K as well. Although my judgment hasn't always been correct on this, it does often suggest the end of a trend is near.
The volatility seen may also suggest this. Even if we throw out bracket four above, we had an intra-day price range of 4.6%. Including bracket four gives a ridiculous 13.5%.
Details of "Dly Sht % of 'sells'" and inflection points included in the latest daily post above.
04/03/2013: EOD stuff partially copied to the concentrator.
# Trds: 29, MinTrSz: 200, MaxTrSz: 10000, Vol 100000, AvTrSz: 3448
Min. Pr: 0.2600, Max Pr: 0.2699, VW Avg. Tr. Pr: 0.2669
# Buys, Shares: 13 48100, VW Avg Buy Pr: 0.2694
# Sells, Shares: 16 51900, VW Avg Sell Pr: 0.2647
# Unkn, Shares: 0 0, VW Avg Unk. Pr: 0.0000
Buy:Sell 1:1.08 (48.1% "buys"), DlyShts 10300 (10.30%), Dly Sht % of 'sells' 19.85%
For those contemplating the possible financing round, here's some VWA closing averages and 10% haircuts: 30 day $0.2934, $0.2641; 40 day $0.2997, $0.2697; 60 day $0.3249, $0.2924.
Things keep improving, but I'm still leery of any postulation based on what's gone on so far. We had a higher low but our high was constrained by the $0.27 brief support we saw, which is now resistance. Maybe the nasty trend is over now as volume continues to taper off and "buy" percentages look to be trending towards normal ranges. Here's the last few days' "buy" readings: 54.5%, 18.6%, 42.5%, 07.9%, 21.8% and 48.1%. For the most part, after the open today the bids moved up a bit and stayed slightly up. The asks dropped a bit after the open and stayed tightly constrained in a narrow range of variation. For now, at least, the wholesale hitting the bids by heavy sellers has abated.
There's nothing bullish here yet, but the intra-day behavior is beginning to look less severely bearish and look much more normal in trading behavior. We should still be somewhat cautious as the volume is low and the average trade size is well down from what I think is the middle of "retail".
My original inflection point calculations show signs of improvement, as does the newer version.
Details of "Dly Sht % of 'sells'" and inflection points are in the latest daily post above.
04/02/2013: EOD stuff partially copied to the concentrator.
# Trds: 48, MinTrSz: 385, MaxTrSz: 20000, Vol 262385, AvTrSz: 5466
Min. Pr: 0.2550, Max Pr: 0.2699, VW Avg. Tr. Pr: 0.2610
# Buys, Shares: 16 57285, VW Avg Buy Pr: 0.2632
# Sells, Shares: 32 205100, VW Avg Sell Pr: 0.2604
# Unkn, Shares: 0 0, VW Avg Unk. Pr: 0.0000
Buy:Sell 1:3.58 (21.8% "buys"), DlyShts 24245 (09.24%), Dly Sht % of 'sells' 11.82%
For those thinking of the financing, here's some volume-weighted closing price and a 10% discount for some periods: 30 day $0.2942, $0.2648; 40 day $0.3009, $0.2708; 60 day $0.3248, $0.2923.
I'm still waiting for something looking like real trading and investing before wading back into the TA stuff. Today looked better, but I'm soured on one-day improvements for now.
The only thing I'll note today is in the next few days we will get a "death cross" as the 50-day SMA crosses below the 200-day SMA.
Details of "Dly Sht % of 'sells'" and inflection points are in the latest daily post above.
04/01/2013: EOD stuff partially copied to the concentrator.
# Trds: 48, MinTrSz: 100, MaxTrSz: 39700, Vol 323220, AvTrSz: 6734
Min. Pr: 0.2600, Max Pr: 0.2849, VW Avg. Tr. Pr: 0.2707
# Buys, Shares: 11 25600, VW Avg Buy Pr: 0.2800
# Sells, Shares: 37 297620, VW Avg Sell Pr: 0.2699
# Unkn, Shares: 0 0, VW Avg Unk. Pr: 0.0000
Buy:Sell 1:11.63 (7.9% "buys"),DlyShts 14100 (04.36%), Dly Sht % of 'sells' 4.74%
For those concerned with a share issuance based on closing prices, here's a few periods with VWA close and a 10% discount through today: 30 day 0.2960, 0.2664; 40 day 0.3030, 0.2727; 60 day 0.3256, 0.2930.
We held up pretty good, price-wise, through 14:45 with a buy:sell of 1:5.39 (15.65% "buys) and A VWAP of $0.2747 on volume of 162820, ~50.4% of day's final volume. Then we went over an hour with no trades and little movement in the bids and asks. At 15:53 it looks like some LARGER seller decided to take whatever bids were stacked up and, through 15:59, soaked up 160.3K shares (~49.6% of day's volume) at a VWAP of $0.2668, all "sells". The disturbing thing was it started taking bids at $0.27 on "normal" trade sizes and just took everything one after the other on increasing trade sizes (hitting 39.7K on the last $0.27 trade) and then took the $0.26xx trades on 61.7K shares.
Nothing like dedicated participants to make sure the job gets done, huh? This was one of the better "late-day weakness" episodes as it took out bids at $0.27 that had been standing in line for several days with volume increased a bit over that time, and most of the $0.26 bids too.
Fortunately our LDWOO (Late Day Wizard Of OZ) came in for 100 shares at $0.28, leaving us down only 1.72% from Thursday's close instead of the -->> (8.74%) <<-- that is reality.
AS others have expressed, ISTM that other than regular investors are engaging in this sort of price-destructive behavior.
So I think I'll just quit right here until I see signs that any sort of TA at all, which is intended to reflect investor sentiment, along with some trader sentiment, might actually be useful again, as when we could see the signs of the beginning of our grind up from November.
Details of "Dly Sht % of 'sells'" and inflection points are in the latest daily post above.
03/28/2013: EOD stuff partially copied to the concentrator.
# Trds: 22, MinTrSz: 800, MaxTrSz: 14000, Vol 101815, AvTrSz: 4628
Min. Pr: 0.2760, Max Pr: 0.2850, VW Avg. Tr. Pr: 0.2805
# Buys, Shares: 11 43315, VW Avg Buy Pr: 0.2831
# Sells, Shares: 11 58500, VW Avg Sell Pr: 0.2786
# Unkn, Shares: 0 0, VW Avg Unk. Pr: 0.0000
Buy:Sell 1:1.35 (42.5% "buys"), DlyShts 15000 (14.73%), Dly Sht % of 'sells' 25.64%
I'm pretty pleased with today's behavior because it was as expected - always a comfort to me. Although I expressed some concerns yesterday, I wrapped up with "... it appears a move is less likely right now than before. Since we have entered short-term consolidation, we have a shortened week, ... we might easily get into the early part of April before this "log jam" is broken". And I mentioned "... Continued consolidation behavior seems supported by the oscillators I watch doing what they've been doing - up a little, down a little, up a little, ... All more or less around fairly neutral readings ...".
We were actually looking better than expected through 14:37: buy:sell was 1.90:1 and VWAP was $0.2821 on 53.7K shares volume. And this was even with everybody, sort of, trying to participate on the sell side: ATDF, NITE, UBSS, CDEL all spent some time at the top of the "leader board" on the ask side. But the typical late-day weakness began, led by ATDF, and we ended as you see above - still not too bad IMO.
Anyway, with a narrowing price spread and reducing volume continuing, it appears that at least a few more days of consolidation might be in store unless ...
We are on our way to a medium-term or longer consolidation, which I think is possible as we await financing news, or some of our action was EOQ-related and the new quarter frees some folks to do things not related to EOQ (I have no idea if this affects AXPW or not), or financing news hits relatively quickly and provides impetus for a move based on either a sigh of relief or disappointment.
On the traditional TA front there is some support for continued consolidation ATM. The oscillators I watch continue mixed with most around neutral readings. My experimental 13-period Bollinger limits ($0.3053 and $0.2721) are converging more quickly now and have moved inside of some potentially key points, the upper below the 50 and 200-day SMA and the lower above $0.27 support line. The nice thing about the lower right now is that price lows are not pushing the lower; rather the lower Bollinger is rising to catch up with the low, which has risen marginally.
Using a standard 20-period Bollinger band, it's not quite as rosy: the upper limit is around $0.34 and "flattish" while the lower limit is $0.26 and falling. If a move to mid-point was attempted again at today's readings we'd hit our good old friend, $0.30. Anyway, the standard one is not showing convergence, and so is not suggesting an imminent move. But do keep in mind that a move to mid-point is not the only option - the bands suggest that movement to the limits is possible without violating two standard deviations. I seldom mention this, but it is a possible near-term move.
On my experimental charts stuff, average trade size finished in what I think is the lower range of typical "retail" size. With the low volume today, this is to be expected. Buy:sell is still weak, but the short-term averages are showing improvement, suggesting that we are progressing towards more normal readings. Daily short sales "spiked" up today, with percentage breaking through a descending trend line and above all the averages I track for it. However, with the low volume and it being, essentially, a one-day event I wouldn't read much into it. It is worth noting that we do have a very short-term trend higher though, so we might want to keep an eye on it to see if it turns into something notable. Right now I'm not expecting any sustained change.
On my original experimental inflection point calculations, I still interpret them as "flattish". On my newer version, the three near-term calculations, 5, 10 and 25-day, are flat and the longer-term calculations, 50, 100 and 200-day, are beginning to curl up. For now, these should also be read as "flattish".
Details of "Dly Sht % of 'sells'" and inflection points are in the latest daily post above.
03/27/2013: EOD stuff partially copied to the concentrator.
# Trds: 26, MinTrSz: 100, MaxTrSz: 54000, Vol 192540, AvTrSz: 7405
Min. Pr: 0.2751, Max Pr: 0.3000, VW Avg. Tr. Pr: 0.2815
# Buys, Shares: 10 35850, VW Avg Buy Pr: 0.2879
# Sells, Shares: 16 156690, VW Avg Sell Pr: 0.2801
# Unkn, Shares: 0 0, VW Avg Unk. Pr: 0.0000
Buy:Sell 1:4.37 (18.6% "buys"), DlyShts 6500 (03.38%), Dly Sht % of 'sells' 4.15%
Since we are concerned about financing and don't know if we'll get a strategic investor or not, I thought I'd add, for now, the 30, 40 and 60-day volume-weighted average closing prices, and discounted 10%, which ought to give us some clue where financing might go if we happen to be close to matching the measurement period.
30 day 0.3451 0.3106, 40 day 0.3405 0.3064, 60 day 0.3402 0.3062
I'm wondering if the financing might be agreed to already and they are just closing it after the EOQ? For bookkeeping purposes, that seems a reasonable thing to do.
My summary is it does look like we have entered short-term consolidation as we have highs stuck at $0.30, mentioned as one of our resistance points, and have lows staying, so far, at or above $0.27 for the last six days. Volume has trended slowly and erratically lower. I suggested a few days back that a move was looking more likely than not. With the increasing price spread, I can't say this is off the table yet. With the return today of "hitting the bid", indicated by the buy:sell, while the asks remained relatively stable in the mid-to-high $0.28xx range and bids holding >= $0.275, it appears a move is less likely right now than before. Since we have entered short-term consolidation, we have a shortened week, we have EOQ coming, ... we might easily get into the early part of April before this "log jam" is broken.
OTOH, anybody that's trying to "clean up" before EOQ that's not done it yet might dump today.
Continued consolidation behavior seems supported by the oscillators I watch doing what they've been doing - up a little, down a little, up a little, ... All more or less around fairly neutral readings. Price is pretty much in the middle of my experimental 13-period Bollinger limits, which are converging, and the 50-day SMA is beginning to pick up steam downward.
BTW, I just got reminded that our price activity is right around the mid-point of the $0.2018 low to the $0.38 high range. "Reversion to the mean" seems alive and well.
A couple of notable trades today, reminded by Occam's_Razor's comment today about big bids. These "hit the bid" and were all "sells". I can't say all were part of a single trade, but the close proximity of time and price make me suspect some of them were: 11:37-11:41 $0.2800 x 12990, $0.2803 x 5100, $0.2810 x 35000 and $0.2811 x 10000; 13:51-13:52 $0.2800 x 54000 and $0.2801 x 10000.
Because of that first group, at 11:58 we had a buy:sell of 1:32.26, with 74840 shares traded. That first group accounted for 84.3% of shares traded to that time. It's worth noting that even with that larger group in the afternoon, our buy:sell improved substantially from this point, but is still in weak territory.
On my experimental charts stuff, those large trades moved the average trade size into the high area of what I suspect is retail and above all the averages. Volume ended above the 25-day average and below all the others and daily short sales continued very low.
Most of the periods on my original inflection point calculations got "flipped" again, so they show less strength. Over the last few days it looks like the would net-out to "flattening". My newer version is much better at reflecting the reality ATM: the three shorter periods leave no doubt that we are "flattening" and the three longer-term periods reflect the weakening relative to those time-frame calculations.
Details of "Dly Sht % of 'sells'" and inflection points omitted from the concentrator.
03/26/2013: EOD stuff partially copied to the concentrator.
# Trds: 33, MinTrSz: 100, MaxTrSz: 10000, Vol 89377, AvTrSz: 2708
Min. Pr: 0.2800, Max Pr: 0.2950, VW Avg. Tr. Pr: 0.2875
# Buys, Shares: 19 48693, VW Avg Buy Pr: 0.2915
# Sells, Shares: 14 40684, VW Avg Sell Pr: 0.2827
# Unkn, Shares: 0 0, VW Avg Unk. Pr: 0.0000
Buy:Sell 1.20:1 (54.5% "buys"), DlyShts 5977 (06.69%), Dly Sht % of 'sells' 14.69%
In summary, I believe we are seeing signs of entering short-term consolidation. Right now, buyers and sellers seem well-balanced, with sellers being less aggressive on the pricing and hitting the bids, and buyers seemingly willing to take a little more risk at these price levels. I think both sides of the market are assessing the likelihood of big negative moves as unlikely and feel that appreciation in a reasonable time-frame seems more likely.
The bids action today was generally a very positive one - stayed >= $0.28 all day and had several excursions into the $0.29 area. The asks were similar, with bids >= $0.29 all day. When you combine this with the big improvement in the buy:sell, you can see a lot of bullish sentiment surfacing.
This also answers my concern about exhaustion of sellers at the price level - it seems that those willing to release shares down in the $0.27 range have been indeed exhausted while the buyers have not been exhausted at these slightly higher prices and do have some powder to deploy. A snapshot of recent VWAPs might be useful here.
$0.3161, $0.3062, $0.2945, $, $0.2913, $0.2907, $0.2833, $0.2780, $0.2835, $0.2819, $0.2813, $0.2850 and $0.2875 today.
Unfortunately, volume was very weak here - not what we'd like to see on price rising - so we need to temper our bullish assessment a bit until volume supports the bullishness.
This leads to thinking we are entering a short-term consolidation ATM. Traditional TA seems to support that as we see price spread narrowing with a lower high and higher low on reduced volume.
On a change in trend this low volume would be common as folks await confirmation that a change has come - consolidation likely in progress. This supported by converging Bollinger limits, now $0.2662 and $0.3213, and our mid-point is ~$0.2938. Additionally, all the oscillators I watch showed small improvement and all are pretty much at neutral readings. Most are showing signs of continued rising, but I expect this to taper off if we remain in consolidation.
We also have a "northern doji" candlestick, typically thought to be a bearish reversal indicator. But Bulkowski notes that 51% of the time it acts as a continuation. The uptrend is a very short one, thus far, so I don't know just how much significance should be given to this candlestick. Add in that it's really an almost random action following this ... Regardless, it's a short-term indicator of indecision, another consolidation indicator.
Last, the MACD histogram also supports a consolidation view as it continues to show improvement. It's still in negative territory, but not by much and should move to neutral in just a few days.
On a decidedly concerning issue, that darn 50-day SMA, $0.3154, is accelerating downward much faster than the 200-day, $0.3077, and will start going parabolic down in three days unless some price movement up, to a substantial degree, is seen. The risk, of course, is that a "death cross" will occur soon and some folks may respond to that. Unfortunately, if I'm assessing things correctly, we will be continuing to consolidate, which means no substantial price rise is likely. Even if I'm off, we'll encounter resistance at $0.30, which would likely prevent the degree of appreciation that is needed. That resistance might be weaker now, due to both a reduction of sellers left at that level and the effect of the quarterly results report.
On my experimental charts stuff, we see the average trade size has dropped below what I consider normal retail range - more consolidation suggestion. As mentioned, the buy:sell did move back into a normal range, but it is neutral ATM at that near-50% reading. Volume is below all the averages again.
My original experimental inflection point calculations did begin to recover, as I suggested was possible, near-term. We're now in a waiting mode again as the patterns develop. My newer version, which you may recall reacted in a less dramatic fashion by just "flattening" some, has also begun to make small moves towards its prior trend, which was strengthening. In terms of short-term results, it seems this one more accurately predicted the price action, being "flattish", than the original did.
Details of "Dly Sht % of 'sells'" and inflection points are in the latest daily post above.
03/25/2013: EOD stuff partially copied to the concentrator.
# Trds: 58, MinTrSz: 400, MaxTrSz: 83600, Vol 355680, AvTrSz: 6132
Min. Pr: 0.2771, Max Pr: 0.3000, VW Avg. Tr. Pr: 0.2850
# Buys, Shares: 19 83400, VW Avg Buy Pr: 0.2960
# Sells, Shares: 39 272280, VW Avg Sell Pr: 0.2817
# Unkn, Shares: 0 0, VW Avg Unk. Pr: 0.0000
Buy:Sell 1:3.26 (23.4% "buys"), DlyShts 4000 (01.12%), Dly Sht % of 'sells' 1.47%
Summary: lots of sellers offset, to a large degree, by lots of bullish buyers. A good sign, IMO. The only real question, for "what's next", is whether the sellers, that started selling many days ago and continued today, are near exhaustion at this price level. The late-day recovery from some seriously horrible looking action early on makes me think this may be the case. A minor concern is whether the bullish folks still have the wherewithal to continue adding at or above current levels. If we have new buyers entering, it seems likely. If most buying was the "old guard", I suspect not.
I'll be watching the next several days for continuation of strength or loss of it.
The day started roughly. Through 13:09 we had a buy:sell of 1:19.42 with a VWAP of $0.2820. As seen by the EOD metrics above, we improved quiet a bit thereafter. Because I believe a lot of today's behavior was a continuation of sellers that had previously decided to exit, and saw nothing in the CC that made them change their mind, I won't do too much TA today.
The asks by the sellers held up well until 12:08, but it made little difference as the predominate action was hitting the bids, evidenced by the buy:sell through 13:09. It was actually much worse than that though - through 12:06 the buy:sell was 1:71.09 on volume of 216,280 shares (60.81% of day's volume, helped out by someone delivering ~100K shares to Poul), but the VWAP was $0.2827. My assessment was there was some selling pressure. |:-\ The VWAP was maintained primarily because the bids remained relatively strong, >=$0.28 through 10:41. From there through 12:38 they were in the $0.275x-$0.277x area before coming back to >= $0.28 again at 13:44, where they remained, even hitting $0.29 briefly at 15:10, before dropping back to the $0.277x area somewhere around 15:23.
Of course, this late-day action on the bids made less difference because the action had switched to bullish with a very high percentage of trades going at the ask, which remained >= $0.28, and with a lot of time spent at $0.299x and even $0.30, through the majority of the latter part of the day. That's why we see the dramatic improvement in both the buy:sell and VWAP by EOD. Keep in mind this is even more impressive because Poul's trade was both a "sell" to him and was earlier in the day, ~10:34, so the late day action wasn't skewed by a large trade.
A little TA ... A higher low and higher high on relatively high volume and we ended with "gravestone doji". Regardless, Bulkowski points out that it actually portends a bearish move only 51% of the time and price movement afterward is not all that impressive on the down move. It's best performance, meeting price target, comes in a break up out of a bear market. So even if we get a move down, he suggests that it usually won't move far. A common 10-day gain, if we move up, is 5%+ over 10 days, considered by him to be quite good performance.
Price continued to move away from my experimental 13-period lower Bollinger, fulfilling the hint from past days that price might not make the full six days of "pushing" the lower Bollinger. Stochastic, MFI and ADX related all showed improvement while the other oscillators I watch weakened. This mixed action is understandable given all the above described action.
Price also continued its departure from the 0.88%/day descending line I had been watching.
50-day SMA is accelerating downward. Without some price move up, we will shortly get a "death cross". It's hard to estimate when because both that and the 200-day are moving downward at different rates.
The MACD histogram has stopped improving - not unexpected. But it is flat ATM, not deteriorating yet.
On my experimental charts, just want to mention that average trade size, no doubt skewed by Poul's trade, is solidly in the mid-range of what I think is retail and actually exceeded all the averages I track on that. Daily short sales are in the absurdly low range again.
My original inflection point calculations weakened, as we should expect, but not as much as I thought they would. We might see a quick recovery to showing strengthening again if the bullish action I thought I saw today carries through.
My newer version, which includes some additional factors, showed less negative effect. Visually, it looked more like a mixed flattening for the moment. This may be a good test of whether this is an improvement over the original or not - ISTM that it more closely matches my assessment of what I saw in the bid, ask and trading action today. Let's hope that I and the chart aren't both wrong.
Details of "Dly Sht % of 'sells'" and inflection points in the latest daily post above.
03/22/2013: EOD stuff partially copied to the concentrator.
# Trds: 49, MinTrSz: 300, MaxTrSz: 20000, Vol 197489, AvTrSz: 4030
Min. Pr: 0.2700, Max Pr: 0.2895, VW Avg. Tr. Pr: 0.2813
# Buys, Shares: 36 146459, VW Avg Buy Pr: 0.2842
# Sells, Shares: 12 41030, VW Avg Sell Pr: 0.2711
# Unkn, Shares: 1 10000, VW Avg Unk. Pr: 0.2800
Buy:Sell 3.57:1 (74.2% "buys"), DlyShts 3700 (01.87%), Dly Sht % of 'sells' 9.02%
On the traditional TA front let us first put the obvious unwarranted bullish "dragonfly doji" candlestick to rest. Bulkowski notes it is followed by a bullish reversal 50% of the time. This means we must look to other factors to estimate "what's next". That's not easy in the first place with this stock and is made more difficult with an unexpected earlier release of the quarterly results possibly affecting short-term behavior and a conference call on the agenda for Monday. The "prognostication" seems to be only available in the MACD and my experimental stuff ATM, both discussed below.
We had lower high and low, again pushing the low through that descending, at 0.88%/day, line I'd been watching. On a positive note, our low did not continue to push my experimental 13-period lower Bollinger, $0.2684 and rising now. Recall that my memory says we tend to push it for six days, generally. An early break from that behavior may be a positive indicator. If we make a simple move to the mid-point of the Bollingers we would see ~$0.298 with today's readings. But the upper band is dropping fast now, so we should expect a lower mid-point even just a day out if we use the Bollinger bands to estimate a move.
Most of the oscillators continued their recent behavior, not really doing much of note except for stochastic and momentum. These two reversed to strengthen a bit with both just below neutral at ~47 and ~96 respectively.
$0.27 has proven to be relatively steady support thus far. Without help from the oscillators, we'll have to look elsewhere to take a stab at if it will continue to hold. One promising thing is the volume. Since the last bump up against, and rejection by, the rising support (now resistance) of the old former rising trading channel begun in November, the volume has declined, has risen as we first hit $0.27 and then begun to fall again. This is typical of nearing the end of churn, or consolidation. We've had a narrowing price spread only three days and it has not been substantial yet. Without the price spread narrowing substantially, I conclude that a move out of this range is more likely than not, near-term.
Haven't looked at the MACD for a while - it's signal and average are trending down but the histogram is showing improvement. Last time I touched on this I noted that the low of that period hadn't gone below the prior low of the histogram and so the long-term uptrend DRich had noticed was likely still in play. Well, we've got that same situation again - since the histogram low in February the two subsequent lows have been consecutively slightly higher. So I would think that is still suggesting the long-term improvement is underway. It'll take some time for the signal line to cross it's average, but it's looking promising ATM.
In the near-term, this supports what I'm seeing on one part of my experimental charts - I snuck (old school - now I guess it's "sneaked") a peak. Anyway, first the parts that aren't supported by the MACD behavior ...
The average trade size today is at what I think is the low end of "retail". Daily short sales fell back into the range of absurdly low. The VWAP price continues to haltingly ratchet downwards, albeit it looks like it may have bottomed: $0.3161, $0.3062, $0.2945, $0.2913, $0.2907, $0.2833, $0.2780, $0.2835, $0.2819 and $0.2813.
On the positive side ...
The buy percentage, which I previously mentioned had been improving, moved into the absurdly high range. Although good, until we have some typical range long enough to move the averages back into normal areas, I'm somewhat suspicious this might just be a combination of the quarterly results release combined with folks seeing little further downside risk at these low price levels. Like me, they may be thinking it's unlikely to hit $0.2018 again and that $0.25 defines the downside risk. With appropriate stops, a reasonable quarterly report and a conference call coming, a gamble on really decent upside potential against a minimal downside potential might be just the ticket for many folks.
This makes me leery that we might have seen some traders, rather than investors, entering the fray. Of course, investors want good prices too, so there's no way to know.
The sellers started the day off typically, including the usual suspects plus ARCA, lowering the ask price consistently, AFAICT from my "snapshots", to fight to be at the front of the sell line. This lasted into the lunch hour. This lead to a VWAP of $0.2775 and a buy:sell of 1.73:1 (63.4%) through 12:24. This is notable for the fact that buy:sell was positive - the sellers were NOT willy-nilly hitting the bids. Instead they were tussling with each other get to the front of the sell line because they could (apparently) see that the buyers would pony up a wee bit. After 12:24 the sellers changed their behavior and started frequently letting the asks rise and remain "elevated". The results of this had no negative effect on the buyers, as seen in the ending buy:sell and VWAP combination - reasonably improved.
That's a big change from some of the recent behavior where we typically see late-day weakness. Instead we got late-day strength, as far as ask-prices go and sellers not hitting the bid.. The buyers also exhibited changed behavior - "bottom-feeding" was out of vogue today as buyers "stepped up" nicely.
My original experimental inflection point calculations continue ... No! They have stopped exhibiting declining rate of weakening and switched to showing increasing strength in the bullish sentiment. Five of the six periods are in agreement, visually, and are supported by the numbers I look at for five-day changes and average change over five-days. Another day or two and we should have a signal confirmed if things don't deteriorate in the market.
On the newer version, we are in the same situation - instead of reducing weakness, we are beginning to show increasing bullish sentiment.
If I wasn't trying to be so conservative with these two experimental tools I would be calling an early signal now. This would definitely be a risky time to do so though.
Details of "Dly Sht % of 'sells'" and inflection points in the latest daily post above.
03/21/2013: EOD stuff partially copied to the concentrator.
# Trds: 55, MinTrSz: 100, MaxTrSz: 30000, Vol 314845, AvTrSz: 5724
Min. Pr: 0.2750, Max Pr: 0.2979, VW Avg. Tr. Pr: 0.2819
# Buys, Shares: 29 173721, VW Avg Buy Pr: 0.2814
# Sells, Shares: 26 141124, VW Avg Sell Pr: 0.2824
# Unkn, Shares: 0 0, VW Avg Unk. Pr: 0.0000
Buy:Sell 1.23:1 (55.2% "buys"), DlyShts 35494 (11.27%), Dly Sht % of 'sells' 25.15%
Well, had a lower high and higher low, and that's most of the day's good news. Well, not quite. Our low departed from my experimental 13-period lower Bollinger, $0.2666 today, rather than pushing on it - I suspected two more days of pushing it based on past behavior. The low also came back up to sit right on that descending support (the one that dropped 0.88%/day) that was broken. I think it's just a "co-inky-dink" though (regardless of what Jethro Gibbs says about them). Believe it or not, the sellers were somewhat restrained today. I actually saw the best ask RISE a couple of times today. This may have been an accident ... or the result of a little more support by the buyers as we saw the buy:sell ...
TA-DA! Exceed 50% relatively early in the day and finish at 1.23:1 (55.2%), the second time since 3/4. At 12:43 we weren't so good - 1:1.79. By 14:08 we hit 1.58:1. I suspect this particular move was the result of a bull accumulating (see below comment link). The improvement follows my note yesterday that we had three consecutive days of an improving ratio. Today makes it four.
I'm sure the sellers noticed and did two things I could observe: lowered the bids a little slower and a little less on average, and hit the bids a little less frequently, waiting instead, for a few seconds longer, for someone to hit the ask before taking action. But we did have competition for the top spot going on the ask side most of the day, with some less frequent MMs involved - ARCA made an appearance several times, as did the usual (recently) UBSS, CDEL and NITE. We needn't mention ATDF.
Giving credit where due, the buyers seemed a bit more willing today too. Most of the day the bids stayed above $0.27, usually in the mid-to-upper range of that and even went to $0.28 and $0.29 several times earlier in the day. We had one period where I saw what I thought was someone taking a bullish position ahead of the quarterly report and commented on it. It was 94.2K, with another 50K possible. No way to know for sure, but it looked like it to me.
The bad news is we closed down 6.43% and at the low of the day, $0.275. Until 15:31 our low was $0.2751. At 15:31, someone hit the $0.276 bid for 2.6K, exposing the $0.275x8K bid, which also got hit. From there through EOD we traded at that price, generously helped by an ATDF offer at $0.275 x 179.4K that appeared at 15:45 and lingered. We have a "gravestone doji" candlestick, viewed as negative. But Bulkowski notes it is followed by a down move only 51% of the time. Since we had lower volume (357.6K, ~399.4K Tue. & Wed.) than the prior two days, I think the more likely behavior Friday is to tend towards flattish.
The oscillators, except for stochastic, all weakened a bit more. With intra-day VWAP weakening a bit from $0.2835 to $0.2819, this seems reasonable.
Some price range statistics that show continued willingness by sellers to "let go low" and buyers seeing a good risk I think:
$0.2750-$0.2750: 017197 shares, 05.46% of volume, VWAP $0.2750
$0.2751-$0.2791: 161804 shares, 51.39% of volume, VWAP $0.2785
$0.2800-$0.2841: 046430 shares, 14.75% of volume, VWAP $0.2805
$0.2850-$0.2879: 028000 shares, 08.89% of volume, VWAP $0.2854
$0.2900-$0.2940: 050664 shares, 16.09% of volume, VWAP $0.2908
$0.2979-$0.2979: 010750 shares, 03.41% of volume, VWAP $0.2979
On my experimental charts front, average trade size is up at the two longer term averages, right in the middle of what I believe to be "retail" trading, and, as mentioned above, the buy percentage moved above 50%. Volume remains above all the averages, and the daily short sales more-than-doubled off the recent lows but are still far below what I believe will be normal in the long-haul.
My original experimental inflection point calculations continue to show a reduction in weakening, with five of the six period calculations improving, along with all six 5-day moves and their average percentage change. My newer version has the same five of six improvements on the daily calculation, but only three of the 5-day moves. I've begun to gain some faith in this newer version and would not make any serious assessments using either version just now. Both show emerging patterns that eventually may lead to a signal of an up move in price, but aren't there yet.
Details of "Dly Sht % of 'sells'" and inflection points are in the latest daily post above.
03/20/2013: EOD stuff partially copied to the concentrator.
# Trds: 77, MinTrSz: 150, MaxTrSz: 37400, Vol 399349, AvTrSz: 5186
Min. Pr: 0.2700, Max Pr: 0.3000, VW Avg. Tr. Pr: 0.2835
# Buys, Shares: 47 170849, VW Avg Buy Pr: 0.2888
# Sells, Shares: 30 228500, VW Avg Sell Pr: 0.2796
# Unkn, Shares: 0 0, VW Avg Unk. Pr: 0.0000
Buy:Sell 1:1.34 (42.8% "buys"), DlyShts 21150 (05.30%), Dly Sht % of 'sells' 9.26%
Well, the PR today about the full automation, from carbon sheets to electrodes, saved us, IMO, from continued price damage. Buyers stepped up a little bit, allowing the sellers to be a little less aggressive in battling to be at the head of the sell line. But I have no doubt that the sellers were still anxious to "Get out of Dodge" today. This is evidenced by both a buy:sell that's still weighted to the sell side even with what should be seen as positive news, and the continued increase in volume without a substantial VWAP gain - we got only 1.98% improvement. If "Get out of Dodge" wasn't the M.O., either volume should have dropped as sellers decided to await potential better prices, or greater VWAP gain should have been seen as buyers became more aggressive, or both. Conversely, a greater volume with stronger VWAP appreciation could also have discounted that seller M.O. Look at where the weight lies below.
$0.2700-$0.2700: 001300 shares, 00.33% of volume, VWAP $0.2700
$0.2752-$0.2799: 100750 shares, 25.23% of volume, VWAP $0.2773
$0.2800-$0.2830: 138500 shares, 34.68% of volume, VWAP $0.2801
$0.2850-$0.2895: 057799 shares, 14.47% of volume, VWAP $0.2861
$0.2900-$0.2940: 071935 shares, 18.01% of volume, VWAP $0.2913
$0.2950-$0.2989: 024000 shares, 06.01% of volume, VWAP $0.2974
$0.3000-$0.3000: 005065 shares, 01.27% of volume, VWAP $0.3000
All this is leading to my assessment that we likely had a one-day wonder here. I say this in light of what happened with the ePower PR, which had a very short beneficial effect, and the over two-week running inability to have a buy:sell that leans towards bullish: only one day of buys >= 50% since 3/4's 85.9%. The fact that today's PR apparently didn't affect selling sentiment, except to let them get out with a little more skin intact, suggests that we must have buyers again step up to prevent any price slide for the next two days ... or more.
Maybe I'm overly pessimistic now though. Maybe the traditional TA stuff will change my mind ...
Well, we had a close of +6.87% - certainly nothing to sneeze at - from yesterday's close, a ha'-penny off the low. Today's low matched yesterday's and gave us a fourth day of "pushing" my 13-period lower Bollinger, suggesting another two days or so of weakness, if past behavior is a valid indication. Our volume was up only 11.68% over yesterdays, which was relatively high volume on a decidedly negative day - I would have hoped that today's volume would've CRUSHED yesterday's. What this means to me is that bottom-feeding is still predominately the buyers' M.O. I don't blame them - if folks know that some want to dump, a buyer naturally wants the best possible price. So I expect tomorrow will still have folks dumping and bottom-feeding going on. So I'm not expecting strong bullishness. I'll hazard that folks still worry about the usual things - capital raise, a less-than-stellar report, ...
Regardless of the higher volume, close and VWAP not one oscillator I follow was able to transition into bullish territory yet. All did show improvement, as we could expect.
Our high stopped at a known prior resistance, $0.30 and immediately retreated, not what I would expect from strong bullish sentiment.
I'm thinking that potential buyers are out of powder, as has been suggested, and/or newer folks considering entry still want to see sustained price movement, sales, a great report, ...
On my experimental charts, average trade size stayed at the mid-point of what I believe to be retail, just like yesterday. The buy:sell is improving steadily now - four days in a row up, in percentages: 0.125, 0.254, 0.267 and 0.428. None of my prices - low, VWAP and high - could make it back to calculated trend.
My original inflection point calculations have started to show early indications of trying to stop the down trend they have been reflecting. Four of the six periods show small improvement, and the 5-day change has 5 showing improvement. My newer version, which I hope proves more reliable and prescient, has six of six periods showing improvement along with all six of the 5-day change values.
Details of "Dly Sht % of 'sells'" and inflection points are in the latest daily post above.
03/19/2013: EOD stuff partially copied to the concentrator.
# Trds: 63, MinTrSz: 100, MaxTrSz: 27500, Vol 357598, AvTrSz: 5676
Min. Pr: 0.2700, Max Pr: 0.2851, VW Avg. Tr. Pr: 0.2780
# Buys, Shares: 21 95562, VW Avg Buy Pr: 0.2805
# Sells, Shares: 42 262036, VW Avg Sell Pr: 0.2771
# Unkn, Shares: 0 0, VW Avg Unk. Pr: 0.0000
Buy:Sell 1:2.74 (26.7% "buys"), DlyShts 14793 (04.14%), Dly Sht % of 'sells' 5.65%
On 3/15, when looking for a potential bottom and noting that we had reverted to the mean on that day, ~$0.2909, I also said " If we use a Fibonacci 61.8% re-trace instead, we get $0.2588. Lots of folks believe in the Fibonacci series, but I find the 50% mark to be a much more frequent occurrence". And I have mentioned a couple times that if we didn't hold around that $0.29 area the $0.275-$0.27 looked like the next stop, although I didn't know how strong it would be because that range was just some lows in some sideways trading.
We're there now. The continued hitting the bid, evidenced by our continued bad buy:sell ratio, combined with today's apparent seller capitulation (as they began wholesale fighting to have the lowest ask) and the higher volume (over twice yesterday's 25-day average of ~169.4K) may offer ... Optimism? Pessimism? I don't know. The volume may suggest the end of trend, but it has no support in this assessment yet.
I've thought a couple times in the recent past we might have flushed the sellers out and it's not proven to be the case. The factors I mention - volume, asks being lowered and the bad buy:sell - would normally lead me to think we've exhausted the sellers at this price level ... again. But in the current environment, with the quarterly report on the horizon and (apparently) few folks expecting any good news, I'm not now going to guess that exhausted sellers is the case. Nor am I going to guess that many buyers are willing to step up.
What I am going to guess at is that Fibonacci $0.25xx will be the next stop if we don't see buyers step up. The willingness of the sellers to drop their asks rapidly today suggests that they are in "Get out of Dodge" mode. If buyers don't step up we've got two occurrences of $0.25xx where we might pause, although in standard TA I wouldn't claim these as strong reversal points - they are equivalent to the $0.27xx area we are now in. With the sellers in total control it's looking like we might accomplish (if you want to call it that) a 100% re-trace from low to high to low - $0.2018 - again.
If we observe volume declining and the sellers stop hitting the bid and don't rapidly lower the asks, then I'll begin to suspect we are near a bottom. If we see buyers begin to step up more strongly, I'll also be able to suspect a bottom is near.
The oscillators I follow are continuing weak(ening) with RSI and stochastic (strengthened about 10% today) just above oversold and MFI and Williams %R in oversold. Strangely, momentum stayed essentially flat with yesterday at ~90.
I have no trend lines in play now except the long-term descending resistance, currently at ~ $0.3620.
On my experimental charts stuff, average trade size is what I think is mid-retail, buy:sell and its averages continue in a declining trend, and volume exceeded all its averages today. If a volume "spike" suggests end of trend, this may be the day's only potential positive. But it has no support yet.
Both versions of my experimental inflection point calculations continue to weaken without any signs of "forming up" to issue a positive signal in the near-term.
Details of "Dly Sht % of 'sells'" and inflection points are in the latest daily post above.
03/18/2013: EOD stuff partially copied to the concentrator.
# Trds: 54, MinTrSz: 100, MaxTrSz: 13830, Vol 204330, AvTrSz: 3784
Min. Pr: 0.2800, Max Pr: 0.2999, VW Avg. Tr. Pr:0.2833
# Buys, Shares: 20 51900, VW Avg Buy Pr: 0.2866
# Sells, Shares: 34 152430, VW Avg Sell Pr: 0.2821
# Unkn, Shares: 0 0, VW Avg Unk. Pr: 0.0000
Buy:Sell 1:2.94 (25.4% "buys"), DlyShts 10830 (05.30%), Dly Sht % of 'sells' 7.10%
I summarize today as still nothing (much) positive showing anywhere. Several things deteriorated a bit from Friday's state. The pretty-much constant hitting the bid is about to get on my last nerve. We've had only one positive buy:sell in 10 trading days - since 3/4. If you look at my charts, especially the buy:sell and its averages, your nerves might match mine. So I recommend avoiding looking at them for now.
Our "big uglies" apparently have been replaced by a bunch of "mini-uglies". This is suggested by the fact that fails-to-deliver for the second part of February (updated my charts today - will post later) only had one fail day, 2/27 (trade date was 2/22) with 991 shares, and it was cleared the next day. Daily short sales were very low, price was weakening and buy:sell was trending lower during this time.
I wonder what Special Situations and some of the other "usual suspects" were doing.
I'm tired ... of this. The sellers have been pretty relentless in hitting the bid. The result, as we could expect, is my latest potential trend support line, ~$0.2901, is now confirmed as broken with a close below it. Next potential supports are price-point lows of $0.275-$0.27. These were just lows in areas of sideways trading, so I don't know how much strength they'll show. My near-term descending trend, falling at ~0.88%/day, that was supporting the lows is also busted, apparently. Today it was ~$0.2825, IIRC, and the lows penetrated that line a second consecutive day. We are "pushing" my experimental 13-period lower Bollinger limit, $0.2794, for the second day and, IIRC, we tend to push it around six days normally.
All but two of the oscillators I watch weakened again. The exceptions were, strangely to me, momentum, which improved from ~0.882 to ~0.904 - still below neutral - and stochastic which stayed flat, barely above oversold. MFI is well into oversold at ~13. If price doesn't start to recover tomorrow, the 50-day SMA will start to weaken more quickly, as will the 200-day. It won't accelerate as quickly as the 50-day though.
Offsetting, maybe, some of that negative reading is the fact that I saw good support at $0.28 today in both trades and bids. There were times bids at $0.28 totaled over 100K and dropped to lower volumes only as MMs (usually ATDF, of course) moved their bid up to get to the head of the line. This action hid the lower bid(s) from ATDF on Level II at $0.28 and they would re-appear when the higher bid disappeared. The lowest ask seen was $0.285, in small volume. Most trades below that were folks just hitting the bids.
On my experimental stuff, average trade size is again at the low end of what I think is retail, the buy:sell showed small improvement but is still very weak and well below its longer-term readings. I had mentioned a couple days back that the intra-day price low had contacted the calculated trend and last time this happened it had ridden it sideways for six days and started an up leg. Well, that's broken now too. Volume is flat and still low.
My original experimental inflection points have reverted to continuing to suggest weakness for now. Looking at the numbers, which had been suggesting a deceleration, I can't discern if that's changed because the various periods are mixed in what they are now doing. My newer version is the same - suggesting continuing weakness and I can''t tell if it's suggesting a change in rate now or not.
Details of "Dly Sht % of 'sells'" and inflection points are in the latest daily post above.
03/15/2013: EOD stuff partially copied to the concentrator.
# Trds: 39, MinTrSz: 100, MaxTrSz: 19700, Vol 210470, AvTrSz: 5397
Min. Pr: 0.2810, Max Pr: 0.3039, VW Avg. Tr. Pr: 0.2907
# Buys, Shares: 8 26240, VW Avg Buy Pr: 0.2952
# Sells, Shares: 31 184230, VW Avg Sell Pr: 0.2901
# Unkn, Shares: 0 0, VW Avg Unk. Pr: 0.0000
Buy:Sell 1:7.02 (12.5% "buys"), DlyShts 0 (0.00%), Dly Sht % of 'sells' 0.00%
Interesting that on a high-volume day with "heavy" selling, there were exactly 0 daily short sales. I suspect this supports one of my stated possibilities regarding MMs (playing short-term long positions, doing covering buys at low prices after short sales at higher prices, being wholly-owned by brokers there are more (mostly?) intra-broker trades, now-available computerized facilities effectively place the broker-held shares under control of brokers' wholly-owned MMs, or a combination of these).
Yesterday I mentioned "... I've got a descending - at 0.88%/day - support we are apparently riding lower. We've bottomed on this line 3 of the last six days. Tomorrow's potential support would be ~$0.285 if that line holds". Monday's support by that line should be ~$0.2825.
Although I generally try to keep my TFH stuff at bay here ...
TFH & DOWNDRAFT STUFF OMITTED FROM CONCENTRATOR!
In the concentrator some folks commented on observed price action over time that could be interpreted as someone trying to suppress price. This might provide support to that hypothesis. Prior to a single 5K trade of $0.281 at 15:57:21, our low was $0.2878, well above my best read of that descending support line. VWAP was $0.2909 on ~204.5K shares traded. This was 4/100ths of a penny below yesterday's VWAP. So we had been holding up well, considering a down day with increasing volume. My last prior look at bid/ask, 15:38, showed $0.281x20K/$0.295x4K. So:
- with ~1.5 cent spread;
- prior intra-day low at $0.2878 (caused by a 33K 3-trade selling at 15:06 with a VWAP of ~$0.288);
- the intra-day VWAP >$0.29 (sans the 33K and the 5K, would be $0.2915, 2/100ths above yesterday's)
- who would "hit the bid" without at least trying an ask at a better intermediate price?
I don't know. Spooked retailer? Market-maker? A manipulator? Day-trader? Lot's of possibilities.
All this discussion is to lead to my conclusion that the $0.285 would be intact if not for the "aberrant behavior". :-)) Since that 5k trade was less than 2.4% of the volume and was a single late-day trade, I think that descending ~0.88%/day support is still intact. This puts support at ~$0.2825 for Monday.
Last regarding that ... Without that 5K trade the price low would have begun a departure from that descending support, suggesting at least a slowing of the downdraft (more on that below) and possibly a start of some sideways trading before another move (up?). Do you think "The Suppressor" reads the concentrator or my instablog?
To be fair, we should also note today, as with many days, a small last-minute trade comes in that seems designed to keep the close as elevated as possible. Today it was 1K @ $0.295. Without intra-day support that pushes asks higher, possibly overwhelming "The Suppressor" efforts to quash price, it's a rear-guard action, at best, because the closing price is left to the mercy of the seller willing to put in sufficient quantity of low-priced asks to overwhelm (limited) buying pressure. Valiant effort, but unlikely to alter the path much. The effort would be strongly aided by some timely PR from Axion that would bring in buyers off the sidelines, but we don't know the odds of that. Until then the (closing) price will be handled, sans buyers deciding this is an attractive price range, by sellers. John has touched on the effects of this several times.
Regarding our "downdraft" I worried about a few days back, it looks like it is nearing an end. "Why when price continues lower?" you ask. Well, the rate of price decline has slowed even though we had higher volume today. Our 210K volume was above the 25-day average I use, ~168.1K today, by ~25.2%. As we know from prior posts, our low has been descending only ~0.88%/day (compounded). At the same time our high has stayed "flat" at $0.3039-$0.3040. From 3/5's VWAP of $0.3388 to 3/12's VWAP of $0.3062, the compounded rate of decline was ~2.003%/day. From 3/12 through today's VWAP of $0.2907, our compounded rate of decline has been slightly less than ~1.72%/day, about a 14% (~1/7th) reduction in the rate of decline.
On to conventional TA ...
Our $0.288 potential support is still intact the last two days as Thursday's low and close were both right there and today's (Friday's) close was above it, even if we discount the last two (manipulative?) trades. Further, even discounting those trades we would've had a higher close on rising volume - $0.29 vs. $0.288. This is considered a bullish sign in traditional TA. If we do get a reversal off this a simple reversion to the mean would suggest ~$0.315 would be a seen.
Even if I don't discount that $0.281 5K trade (discussed in the part not posted in the concentrator), our descending support (down 0.88%/day) should be considered intact until confirmation is seen that it is NOT in play. Since "overshoots" of any trend line are quite common, confirmation of a break is needed.
Speaking of trend lines, I had recently identified another potential rising support to replace the recently failed one. It experienced an "overshoot" yesterday (Thursday) with a close below that line. But today we closed above it and, AFAICT, would have closed right on it at $0.29 if the last two (manipulative?) trades were discounted. After the earlier total of 33K shares traded at 13:06, price moved smartly back up to trade 35.4K (~17% of day's volume) in the $0.29-$0.30 range. So either way, we don't have confirmation this potential new rising trend line is "broken" yet. But if buyers don't step up to counteract the sellers, it will be broken quickly and we'll be looking at the $0.275-$0.27 range as next potential support.
Including those last two trades gives a close above that rising potential support.
Price has moved back into a range which will now let the 50-day SMA, $$0.3218, decline. If we don't get some appreciation to ~0.33 in the next couple of days, the 50-day will begin to accelerate downward. Fortunately, we still have a large gap, relatively, to the falling 200-day at $0.3099 so there's no immediate danger of a "Death Cross" IF PRICE CAN AT LEAST HOLD IN THIS RANGE! And this would be a "real" one with both SMAs declining and the 50-day falling more rapidly than the 200-day. Even then, we've got a tough row to hoe as the "tail" of the 50-day will be quickly moving to include some closes up in the $0.37 area for a couple of days before lower closes start coming into play again - about eight additional days for the tail to get back into the $0.32-$0.33 area.
Most of the oscillators I track have shown a small improvement today, but all are still well south of neutral. No bullish indications of any strength manifest yet.
On my experimental charts stuff, average trade size has recovered now to be right in the middle of what I think is "retail". We need to see it hold here or better to read anything into it though. I'm also concerned that this may be just an effect of the zero short sales - if MMs are in a long position with lower-cost shares they needn't work as hard to fill buy orders. Combined with the again falling "buy" percentage, I don't read this as bullish.
I had mentioned yesterday that our low had intersected the calculated trend line and generally rode that line sideways around six days and then started a rise. On;y if I discount the suspected two manipulative trades at EOD can I say price is still riding that line, which looks to be about $0.285 today, matching the descending trend line mentioned up in the traditional TA area.
A potential positive is that volume the last three days has been right around and above (especially today) the 10 and 25-day volume averages. The trend over the last four days is up. Unfortunately it is in conjunction with a price trend down - not a good sign.
My original experimental inflection point calculations lost it's "merest" hint of an upturn and is still suggesting weakness. Ditto for the newer version. However when I examine the actual numbers there is a divergence that may prove significant in the future: the newer version suggests a near-term reduction of the rate of weakening while the original suggest the opposite. Since the newer version considers factors not in the original, this makes sense. It also happens to match the behavior seen in the discussion of the rate of price change discussed when considering the "downdraft" above.
Details of "Dly Sht % of 'sells'" and inflection points are in the latest daily post above.
03/14/2013: EOD stuff partially copied to the concentrator.
# Trds: 40, MinTrSz: 100, MaxTrSz: 23000, Vol 183300, AvTrSz: 4583
Min. Pr: 0.2880, Max Pr: 0.3040, VW Avg. Tr. Pr: 0.2913
# Buys, Shares: 13 41500, VW Avg Buy Pr: 0.2942
# Sells, Shares: 27 141800, VW Avg Sell Pr: 0.2904
# Unkn, Shares: 0 0, VW Avg Unk. Pr: 0.0000
Buy:Sell 1:3.42 (22.6% "buys"), DlyShts 19000 (10.37%), Dly Sht % of 'sells' 13.40%
My summary feeling for today is that we may (emphasis on may) have bottomed. The action from 14:06 onward was definite capitulation-like in nature. Several of the usual players did not participate in the ask-side plunge, suggesting that they may become the low asks in the >=$0.30 range if today flushed out the anxious types. Things that suggest possible (near) end of the down leg:
- 5-7 days down has been recent history followed by a turn up beginning;
- a $0.2018-$0.38 range reversion to the mean is $0.2909, we a got a little normal overshoot(?);
- recent support resulting in a reversal seen at $0.288-$0.289 and mid-$0.27 range before that;
- a new potential support (replacing the failed one) right here with an origin and three touches;
- re-traced ~50% of the $0.2018-$0.38 range 11/12-1/11 and dropped ~17% off the $0.35 high of 3/5;
- oscillators I watch are configured similarly to past occurrences preceding an upturn;
- a possible Elliot wave end, as Mayascribe identified, is right in this area;
- several "usual suspects" did not participate in yesterday's lemming rush and held asks steady >$0.30.
Downside risk, beyond the $0.27xx mentioned above, seems to be in the $0.25 and the $0.20 area, although I think this latter one is unlikely to be seen near-term. Looking at some details of today's action ...
I think the last three days, in aggregate, have been our "whoosh" that I feared might develop, although it's been a rather slow-motion one. We've dropped 17.7% since our high of $0.35 on 3/5, slightly more than half of it since the $0.3195 close on 3/11. And two of the last three days were above the 25-day average volume.
I expected low volume and continued price weakness today. Through 13:52 we had 7,675 shares traded at a VWAP of $0.2984, pretty much as expected. At 14:06, things changed and we traded another 175.6K at a VWAP of $0.2910 and made our low for the day at the close on 5K at $0.2880.
This action was started by a relatively infrequent participant, ARCA, at 14:06 when they entered a best ask of $0.295x13K when the current best from 14:00 was $0.3039x8K from ATDF. That almost one-penny drop in the ask was the catalyst. From then until the close it was a battle between ARCA, UBSS and ATDF to get to the head of the sell line. Other normally "semi-usual suspects", like NITE, CDEL and TEJS mostly held their asks unchanged above $0.30 and chose not to become part of the lemmings' race.
This action reminds strongly of putting in a bottom. It looks like the ARCA offer triggered a bunch of conditional or stop-loss orders. The timing would be about right too - generally our down legs since we entered the rising trading channel in November has been 5-7 days. Today was our 7th or 8th day down, depending on from which day you start counting. Just prior to entering our rising trading channel we had 17 days of mostly down, ending the leg with a low at $0.20 and a close at $0.235 on Nov. 12.
The oscillators I watch need little discussion - all stink. Momentum is as weak as it's ever been since 7/19/12. About half of these prior low points led to an upturn either immediately or after a sideways trade of a week or two. Williams %R and stochastic are now in oversold.
Well, that potential new support line wasn't - over the six days since we failed to push back above the old rising trading channel support (would be resistance now), we were steady down, penetrated the new potential line, putzed around there two days and departed southward decisively today. So it's certainly not in play. In looking for the trend, I've got a descending - at 0.88%/day - support we are apparently riding lower. We've bottomed on this line 3 of the last six days. Tomorrow's potential support would be ~$0.285 if that line holds.
I've also added another new potential slightly rising supporting trend line originating at the low of 12/14 with touches at lows of 1/2, 2/22-26 (three trading days) and 3/13. We closed slightly below it today - a normal overshoot? If we close below it a couple more days, it's out of play too. If we come back above, I think we have a confirmed support line that slowly rises.
Our low, and close, today was right at the low of 2/22-2/26 (three trading days) of $0.288-$0.289. It's possible we've found support there. Looking back over a one-year chart, there's several cases I see where it acted as support and resistance while we were in sideways trading.
If the two above don't hold, our nearest potential price support, from a recent area of sideways churn (while we were within our rising trading channel) would be around $0.275x-$0.27. But those areas are not "strong" as I see no other times on a one-year chart where they were in play and had influence.
If the Elliot Wave stuff Maya was kind enough to look at holds true, we won't go as low as $0.28 - but that was if we had identified the proper start of a wave and which wave it was and we don't get an overshoot of that too.
We are near my experimental 13-period lower Bollinger, but not yet pushing down on it. If a typical move to the middle were to appear, we would be moving back towards $0.31 with today's upper and lower values, $0.2826 and $0.3387.
While looking for where our bottom might be I reverted to the old, and reasonably reliable, "reversion to the mean" consideration. In many cases this has turned out to be at least temporary support and even provided some reversals. Using the low of 11/12/12, $0.2018 (coincidentally just before we started our two-month ride up in the ascending trading channel) and the high of $0.38 on 1/11/13, we get a mean of $0.2909. We're there, with a minor overshoot. If we use a Fibonacci 61.8% re-trace instead, we get $0.2588. Lots of folks believe in the Fibonacci series, but I find the 50% mark to be a much more frequent occurrence.
On my experimental stuff, we see the average trade size now has a trend of recovering to more normal levels. Today we got back into the low mid-range of what I think is retail. The buy:sell, although low, avoided going down to, and below, its recent lows.
The low is sitting right atop the calculated trend line for the new ~10-month chart. Last time it got to that trend line the price action was sideways for about 6 days and then we started a leg up to $0.35. Let's hope we get at least as good a result this time.
My original experimental inflection point calculations continue to weaken. My newer version is in agreement. The original has the merest early hint that we might be preparing to reverse. The newer version is giving a slightly stronger hinting of this on the near-term calculations, but a weakening on the longer-term calculations. The shorter-term ones reacting first is what I would expect. Three of them agree today.
Details of "Dly Sht % of 'sells'" and inflection points are in the latest daily post above.
03/12/2013: EOD stuff partially copied to the concentrator.
# Trds: 41, MinTrSz: 400, MaxTrSz: 13000, Vol 193325, AvTrSz: 4715
Min. Pr: 0.2931, Max Pr: 0.3194, VW Avg. Tr. Pr: 0.3062
# Buys, Shares: 17 51058, VW Avg Buy Pr: 0.3082
# Sells, Shares: 24 142267, VW Avg Sell Pr: 0.3055
# Unkn, Shares: 0 0, VW Avg Unk. Pr: 0.0000
Buy:Sell 1:2.79 (26.4% "buys"), DlyShts 13720 (07.10%), Dly Sht % of 'sells' 9.64%
My summary for today is that we are at a known prior support, relative volume was high enough to suggest the possibility of an end to the sideways/down trend, but everything is suggesting lack of strength here. I think the next two days will give us a clue if we (don't?) see $0.30 hold with some strength, i.e. volume and improving buy:sell and, maybe, average trade size too.
Yesterday, while discussing the magician providing a late-day trade to keep the close higher and wondering if that just made the sellers hang in longer than they otherwise might trying to get the last fractional penny of profit, I said "Let's hope not, as a whoosh could result if there are a couple relatively large sellers there and they finally give up on trying to milk the last fractional penny out of what they mean to sell". Was today a "whoosh"? Is this the end of it, if so?
We closed down 6.1% at $0.30 but got as low as $0.2931 (-9.17% from prior close), with today's spread being 9.177%. We held up relatively well, with a low @ $0.31 through 14:35. At 14:36 we had 6.5K trade at $0.31 followed by 30 minutes of no trades. At 15:06 12.3K traded $0.3013-$0.3014 to start a drop. At 15:20 we traded 3K at $0.2931. 15:29 saw 9K at $0.2999 and at 15:31 we traded 6K at $0.30, to end the day.
So, looking at volume and price, I don't think this was a "whoosh", regardless of the percentage. There wasn't enough volume - not overall nor at the low prices.
But tomorrow is another day ...
The 50-day SMA, $0.3215, will continue to rise three more days if we hold at or above today's close. The 200-day is $0.3107 and still falling and we closed below it, considered a bearish signal. Price has been vacillating around the 200-day for the last couple of months. I assume it will continue to do so. Price range is fairly centered within my experimental 13-period Bollinger band.
Recall that we have a new potential rising support that was ~$0.301, AFAICT yesterday, and is still about there today. Since we bounced right back from the low to close at $0.30, about 1/10th cent below if my eyes aren't too far off, I think we can consider the close to be "right there". I think tomorrow and the following day tells us if this is support or not. We need to see price >=$0.301 (VWAP maybe, like today's $0.3062?) and some reasonable volume, even if we don't get a surge, which would be better of course.
The odds may not be good as all the oscillators I watch are now definitely weakening and most are below a neutral reading now. OTOH, our recent volume has been so low that today's ~193K, highest since 3/5, might qualify as a "spike", often signaling the end of a trend, in this case our sideways/down trend. I'd await confirmation though - just not enough here to make me think yesterday's "Could this indicate that sellers at this level are again exhausted?" has been answered.
We do know that $0.30 has provided support before getting a short-term bump up in the past and has been resistance just before starting a downward leg, both behaviors while in predominately sideways trading. This is our scenario now. If $0.30 doesn't hold, $0.288 demonstrated support recently, 2/22-26, with very low volume each day.
On my experimental charts front, average trade size bumped back to the low side of what I think is retail, but we don't see a trend yet that would suggest some strength coming back. Buy:sell was weak, but not abysmal and does seem to have a trend of slow improvement underway. Daily short sales remain low and my original experimental inflection point calculations continue to suggest weakness. On my newer version, all but the 5-day now agree on weakness. Since we had some "reasonable" volume come in, the recent price trend finally appears in the longer-term calculations, unlike yesterday when they were trying to get up to neutral.
Details of "Dly Sht % of 'sells'" and inflection points are in the latest daily post above.
03/11/2013: EOD stuff partially copied to the concentrator.
# Trds: 22, MinTrSz: 100, MaxTrSz: 8500, Vol 43325, AvTrSz: 1969
Min. Pr: 0.3100, Max Pr: 0.3197, VW Avg. Tr. Pr: 0.3161
# Buys, Shares: 18 27825, VW Avg Buy Pr: 0.3194
# Sells, Shares: 4 15500, VW Avg Sell Pr: 0.3101
# Unkn, Shares: 0 0, VW Avg Unk. Pr: 0.0000
Buy:Sell 1.80:1 (64.2% "buys"), DlyShts 4000 (09.23%), Dly Sht % of 'sells' 25.81%
Well, the bid/ask action was unusually stable today and there was much less late-day weakness. With the low volume, it was somewhat surprising. If I didn't miss any, the low ask I saw was $0.3193 and the highest was $0.3198. This was both a much smaller range than typical and stayed generally further away from best bid, rather than collapsing towards the median, as is typical when ATDF/TEJS and NITE are on the pitch, as they were today.
Could this indicate that sellers at this level are again exhausted? Or is it a result of our late-day magician holding the price higher making potential sellers think they can get more and thereby causing lower volume as the sellers are reluctant to give up any fractional pennies because they see "strength"? Don't know. Let's hope not, as a whoosh could result if there are a couple relatively large sellers there and they finally give up on trying to milk the last fractional penny out of what they mean to sell.
OTOH, in the situation as we find it, the buyers were willing to move up towards the ask and pay it. The buy:sell recovery from the recent abysmal percentages of 0.859, 0.249, 0.219, 0.276, 0.157 and 0.642 (today) might be suggesting some reduced fear of a price move substantially lower ... if it was accompanied by volume, which it is not. We saw the best bid go as high as $0.3195, briefly while ask was $0.3198, but it quickly moved back to the low $0.31xx area and remained there but for another brief period at $0.3194 during the lunch hour when there were only two trades, the highest being $0.3193 for 8.5K going off while bid/ask was $0.31/$0.3194.
Again, the situation is (as always) unknown, but it does mean more caution should be included in any TA.
Having said that, the spread is compressing ATM with lower highs and higher lows. My potential new rising support (~$0.301?) is still in play, we are fairly centered in the Bollinger band and we are "pushing" on a rising 50-day SMA, $0.3213. With no volume it's not much of a push though. We're just below a demonstrated resistance seen 12/3-12/4 and a churn low "support" 2/1-2/11 before we took the exit from our rising trading channel begun in mid-November. If we're lucky, this will extend into a sideways move until intersecting the potential new rising support, whereupon it will find support and start to creep up. But that is tough to forecast with this low volume.
The oscillators are mixed again, as we would expect with directionless low-volume action. Some flattened, some started weakening (momentum weakened to 1.03) and stochastic continues its slow move towards oversold. None of the others warrant detailing today.
On my experimental charts, average trade size is below anything I would think even suggests typical retail buying or selling. We are currently moving "at the edges", which can't be a good thing. Buy:sell is better, but with this volume, sort of meaningless. My original inflection point calculations, which are volume-sensitive, remain disorganized with a negative bias. My newer version, which includes other factors, is moving towards a decidedly neutral stance ATM with longer-term trends up and shorter-term trends flat-to-down. In this configuration, no move or direction of price is suggested.
Details of "Dly Sht % of 'sells'" and inflection points are in the latest daily post above.
03/08/2013: EOD stuff partially copied to the concentrator.
# Trds: 21, MinTrSz: 100, MaxTrSz: 30000, Vol 136805, AvTrSz: 6515
Min. Pr: 0.3050, Max Pr: 0.3198, VW Avg. Tr. Pr: 0.3092
# Buys, Shares: 12 21425, VW Avg Buy Pr: 0.3123
# Sells, Shares: 9 115380, VW Avg Sell Pr: 0.3086
# Unkn, Shares: 0 0, VW Avg Unk. Pr: 0.0000
Buy:Sell 1:5.39 (15.7%), DlyShts 4160 (03.04%), Dly Sht % of 'sells' 3.61%
As mentioned yesterday, I thought we'd see either price appreciation or increased volume, but not both. We got the former, for which I'm grateful, but I don't see the rise sustaining until we get both at once. I think the continued weak "buy:sell" suggests this. Further, shares that were "buys" had a count tantalizingly close to yesterdays daily short volume of 29K. With yesterday's VWAP being $0.3126 and today's much lower (even the "buys" were lower today), MMs might have been making some covering buys for any shorts left open from yesterday at attractive prices, especially if today they acquired most on the "sell" side.
We had a notable bid of 75K @ $0.3099 put in today that eventually traded along with one additional 5K at that price. These will skew the average trade size up with this low volume along with the VWAP we see. Excluding these trades, volume would be 51.81K, average trade size would be 3,238 and VWAP would be $0.3080. This not to discount these trades at all, but rather to provide some context.
On the traditional TA front, we still have potential new rising trading channel in place as the new support line I recently added seems to be, so far, holding. But without some volume - and I'd really like to see one more re-test with it - I can't say if it appears "strong" or not. With declining volume these last four days there's likely to be another re-test and we'd want to see it hold with good volume, at least in the following days.
I'm even more insistent since the close would've been $0.305 if not for a single 100 share traded at the ask, $0.3198, just before the close. I feel (now "felt" since we had an implied "confession" in the APC) someone is trying to "lead" the market higher. If the close had been $0.305, as it should've been IMO, we would have an open, close and low all at $0.305 - a "Gravestone Doji" candlestick. The trading community sees this as a bearish reversal indicator but Bulkowski notes it is really random with a reversal actually occurring only 51% of the time.
The 50-day SMA is $0.3207, a tad above today's high. With the close at $0.3198, we buy another day of it rising. If we stay right here, we've got another seven days of it rising. We're still pretty much centered in my 13-period Bollingers.
Several of the oscillators I watch improved slightly, but in the range of "meh". Without volume I wouldn't place much trust in them anyway. Meanwhile, the stochastic continues to travel towards oversold territory, but it may need some volume on weakening price to achieve it. ADX and related also continue to weaken.
On my experimental charts, average trade size is solidly in the upper-mid range of what I think is retail, but don't forget the discussion above about the larger trade today. Buy:sell still stinks and isn't suggesting any upside ATM. My original experimental inflection point calculations are still weakening further and my new ones are in agreement.
Details of "Dly Sht % of 'sells'" and inflection points are int the latest daily post above.
03/07/2013: EOD stuff partially copied to the concentrator.
# Trds: 49, MinTrSz: 150, MaxTrSz: 24725, Vol 183160, AvTrSz: 3738
Min. Pr: 0.3010, Max Pr: 0.3250, VW Avg. Tr. Pr: 0.3126
# Buys, Shares: 19 50605, VW Avg Buy Pr: 0.3143
# Sells, Shares: 30 132555, VW Avg Sell Pr: 0.3119
# Unkn, Shares: 0 0, VW Avg Unk. Pr: 0.0000
Buy:Sell 1:2.62 (27.6% "buys"), DlyShts 29125 (15.90%), Dly Sht % of 'sells' 21.97%
My summary is likely more weakness with a possible reversal of trend in store in a few days. Nothing indicating a reversal is more likely than continued weakness for now.
It's too early to say if much will come of it, but the daily short sales moved above all the descending averages, as well as its calculated long-term trend line. It's not a large move and not out of the range of normal choppy behavior we've been seeing.
As mentioned in a comment in the APC, the ATDF market-maker was off the field today. The result was that for a large part of the day it looked like price might hold up well - we had initially much less "jumping to the front of the line" on the ask to push price down. From the opening salvo of 49.5K shares with a VWAP of $0.3114 we saw a slow low-volume crawl to as high as $0.3250 at 14:00. From there it began to weaken, again with low-volume and infrequent trades, with zero trades between 14:44 and 15:23. At that point, I guess NITE decided to stand in for ATDF and began pushing the ask downward. Trades moved from $0.32 down to as low as $0.3010, and closed at $0.3050, on volume of 88.43K with a VWAP of $0.3098. Here's a breakdown of some of the action.
$0.3010-$0.3050 019930 shares, 10.88% of volume, VWAP $0.3021
$0.3100-$0.3140 103700 shares, 56.62% of volume, VWAP $0.3112
$0.3150-$0.3181 041200 shares, 22.49% of volume, VWAP $0.3166
$0.3200-$0.3250 018330 shares, 10.01% of volume, VWAP $0.3226
On the traditional TA front, all the oscillators I watch weakened some more, with all but the MFI (~61.9) and momentum (~1.05) below neutral and the stochastic %K (~46.58) looking like it wants to go oversold shortly. Price is pretty much in the middle, $0.3067, of my experimental 13-period Bollinger bands - $0.3355 and $0.2779. Since we've moved the price range lower, the 50-day SMA, $0.3201, will start slowing its ascent. If we move lower a penny or so, it will go flat but the spread between it and the 200-day SMA, $0.3113, will still continue to widen as the 200-day continues to drop.
With volume slightly higher, but not dramatically so, further weakness in price should be expected. But there's a couple of things that suggest a positive move might appear.
First, our price is at a known prior support point and it would not be an aberration to see support, seen at that level today, result in a bounce up. With the relatively small percentage of trades in the lower-$0.30xx area today, the sellers at this level might be exhausted. The percentages above suggest that most got out above the low $0.30 level. Further, there may be many who, as I did, see a $0.30xx range as a very reasonable risk/reward point, especially if they believe some news is likely over the next couple of months. We'll just have to see how this near-term plays out.
Recall that I was looking for a new potential trend and added a rising line from the low of $0.2018 on 11/12/12 which touches the lows in the 2/22-2/27/13 period. The extension of this line is barely below the low today of $0.301. Since we came off a high of $0.35, a known resistance point, on 3/5, there's a possibility we might reverse trend (it's only a three-day trend though), either Friday or in the next couple days. We've retraced ~80% of the rise from $0.288 to $0.35. If this is just an overshoot of the Fibonacci 61.8% price point and that potential new rising support is in play, we could see a move back towards $0.33, another known resistance. There's nothing suggesting it's likely yet, but it is a possibility here. If it does come, I really wouldn't be looking for it on a Friday, which is often a low-volume day. Given all this, I don't expect any price strength with volume today. Might have one or the other though.
My experimental charts stuff is not yet showing suggestions of strength either. Average trade size remains in the lower area of what I think is retail, although it is slowly improving. The buy:sell ratio is still quite weak, volume is still low with all the averages dropping and my original inflection point calculations are showing increased weakness, although they aren't well-formed. My newer version is well-formed and, in retrospect, can be considered to have thrown a signal on 3/5. But since I've not exhaustively examined it over the year yet, I didn't believe in it enough to holler, other than to say it was also suggesting weakness.
Details of "Dly Sht % of 'sells'" and inflection points are in the latest daily post above.
03/06/2013: EOD stuff partially copied to the concentrator.
# Trds: 36, MinTrSz: 250, MaxTrSz: 13650, Vol 143208, AvTrSz: 3978
Min. Pr: 0.3200, Max Pr: 0.3369, VW Avg. Tr. Pr:0.3235
# Buys, Shares: 13 31408, VW Avg Buy Pr: 0.3288
# Sells, Shares: 20 91800, VW Avg Sell Pr: 0.3213
# Unkn, Shares: 3 20000, VW Avg Unk. Pr: 0.3250
Buy:Sell 1:2.92 (21.9% "buys"), DlyShts 10604 (07.40%), Dly Sht % of 'sells' 11.55%
My summary is nothing suggests a stop in the down move yet.
The price weakness that began to manifest yesterday continued today. The bid/ask movements followed suit: by 10:12 bid dropped to $0.3201 from the $0.3315 present at the open and the $0.325 seen by 9:46. The ask had dropped to $0.3295 by 10:40 from it's initial $0.3369 at the open. Although slow, the trend continued throughout the day, leading to bid/ask of $0.3101/$0.32 at 15:51, just before close.
Although volume dropped again, it's not low enough to lead me to believe we might be nearing the end of a bottoming process. There's only two things that might support such a thought and I wouldn't want to hang your hat on it.
The first is that the low stopped just above the 50-day SMA, $0.3197 and rising. I see only one case where it seemed to offer support prior to our rising trading channel begun in November. And that was for only a short period at the end of the failed cup and handle back in May of '12.
In the process of searching for the trend forward, longer term, there's a potential rising support constructed from the low of 11/12/12, after which we entered our rising channel, and touching the lows of 2/22-2/27. But I would call this tentative, at best, as there's only the origin and "one" touch (I treat occurrences of touches clumped together as "one"). This is currently ~$0.2975 and rises about 1/8th of a cent each day. A new rising channel is not entirely out of the question as subsequent to leaving one trading channel and going sideways a bit it's common to establish another channel, which can be up as likely as down, viewed in isolation.
Since it's impossible for me to isolate well, I do have to mention that all the oscillators have now had time to "sync up" and all are weakening. Some are just below the overbought range (MFI & stochastic) and some are just above neutral (RSI, momentum, Williams %R). Countering those negative indicators is that the "Golden Cross" (supposedly deserves capitalization in per the trading community) continues to develop a wider divergence between the 50 and 200-day SMA as the 200-day is now down to $0.3115. It's also possible that the combination of the 200-day SMA and the potential new rising support mentioned in the last paragraph might "join forces" to support price. I'm not thinking that's a strong likelihood though. Last, the PSAT has flipped to "bullish", purely as a function of the PR pop though. Since I don't trust it anyway, I'm not going to trust it now.
Since we had a pop on the PR that gave us a 8%+ gain in one day, there's a possibility we a doing a "reversion to the mini-mean" (YUK! I slay myself). The low of 3/4, $0.3002, and the high 3/5, $0.35, gives a "mini-mean" of ~$0.325. Was today just an "overshoot"? I think not, but we can always hope, which costs nada - for sure if we don't invest based on it.
I left my usual haunts today and took a look at a two-year chart. A simple descending wedge construction makes an ugly picture. I tried for a descending trading channel, but the support was just to raggedy to accept that it really helped define a channel. So I stuck with the wedge where the descending resistance originates at the high of 1/26/12 (we could use 5/25/11, but it doesn't really add much information to the results), and touches at the highs of 1/15/13 and - you guessed it - yesterday, 3/5. The descending support originates at the low of 12/29/11 and has a touch at the low of 11/12/12. But the "ugly" news is not what one would expect ...
It breaks upward 68% of the time. It doesn't perform that well afterwards, according to Bulkowski, but it's a positive possibility nevertheless. And we are approaching the typical breakout area - 57%-59% along the lateral path. Not quite there yet and I am suspicious because of the near-term action. But we have been staying much closer to the resistance than the support since leaving the near-term rising channel started in November. AFAICT the resistance is currently ~0.3480.
Enough of that. My experimental stuff shows average trade size remaining low, buy:sell still halting moving up towards a more normal reading, and volume slowly improving. Daily short sales remain low and the original experimental inflection point calculations continue to weaken. However, my current newer version shows less of this tendency. It considers things in a way that tries to eliminate some of the "flakiness" and also looks at some additional factors. The newer version does show some weakening, but not to the degree my original does. I guess we need to let it develop and just see what happens since I don't know yet if this is more or less useful than the original.
Details of "Dly Sht % of 'sells'" and inflection points omitted from the concentrator.
03/05/2013: EOD stuff partially copied to the concentrator.
# Trds: 53, MinTrSz: 100, MaxTrSz: 19000, Vol 225324, AvTrSz: 4251
Min. Pr: 0.3300, Max Pr: 0.3500, VW Avg. Tr. Pr: 0.3388
# Buys, Shares: 19 61211, VW Avg Buy Pr: 0.3393
# Sells, Shares: 34 164113, VW Avg Sell Pr: 0.3385
# Unkn, Shares: 0 0, VW Avg Unk. Pr: 0.0000
Buy:Sell 1:2.68 (27.2% "buys"), DlyShts 30291 (13.44%), Dly Sht % of 'sells' 18.46%
The day started decent, suggesting that we might have some strength as the price opened above the rising support line from the channel started in November (from yesterday, " AFAICT it's at ~$0.3420") and looked like it would hold well. Around 10:00 ATDF and CDEL did a little jostling at the bid side and I had hopes that buying pressure might be appearing. But they never took the bid higher than $0.3421 and by 12:12 it was back to $0.34. Further, from 11:27 onward, almost everything was "sell".
Through 12:29 we traded ~119.2K shares, 52.9% of day's volume, at a VWAP of $0.3437 with 8 trades, ~63.8K shares, at or near the support line level (trades went at $0.3420-$0.3421). But when price went to $0.3400 at 12:29, after watching the "Usual Suspects" appear on the scene, acting in the "Usual Suspicious Manner", I knew the game was over for today. From there onward we traded ~106.1K, 47.1% of day's volume, at a VWAP of $0.3332. In furtherance of domestic harmony, I sold one of my wife's recently acquired small trading blocks bought at $0.30 for just over 10% gain, expenses included, during this period.
Maybe we shouldn't expect different behavior when we had an 8%+ pop yesterday. There must be some rules-based traders and some low-risk-tolerance folks that should take the opportunity to get some profit locked in. And I see TB offered another possibility, involving the potential future financiers of the next funding round, that might be part of the reason price has difficulty going anywhere recently.
Regardless, as I mentioned recently, resistance could appear at $0.35-$0.37 and we saw $0.35 hit followed by movement lower. We still closed almost absolutely flat with Monday, down only 5/100ths of a cent - not a shabby outcome at all, considering everything. So we really can't view this as a "sell off".
ISTR somebody mentioned "reversion to the mean"? That certainly is the case here: from the high of $0.38 1/11 to the low of $0.288 2/22, we derive a "mean" of $0.334. How spooky - we closed at $0.3345!
We have a "shooting star" candle configuration, which suggests a reversal 59% of the time - a tad bit better than random. The candlestick comes in two varieties - a single candle, just high-lighted, and a two-candle variety. Unfortunately, the two-candle version, which results in a bullish continuation bullish 61% of the time, requires a gap, which we don't have.
All is normal and behaving as expected - always a good thing IMO. When we combine the fact that volume was reduced (an important consideration IMO), compared to the stronger volume on the rise seen Monday, we shouldn't expect too much near-term downward pressure. I think a key is whether we stall here for an extended period or quickly start a move up or down.
The oscillators I watch were mostly little-affected. Most went to just a flat-line status - as we might expect with reducing volume when price doesn't make much of a move. This is the second day of pushing my experimental 13-period upper Bollinger, $0.3336. I'm unsure how to asses this since we are outside our rising trading channel, begun mid-November, ATM. Prior to that we had times price quickly retreated from the upper Bollinger and times it pushed on it 6-7 days or longer (notably during the formation of our failed cup and handle period that ended 5/2/12 - we have sort of a "mini-me" version that may be forming right now).
The 50-day SMA is $0.3189 and rising more strongly each day for 12 more days, IF there's no strong price pull-back. If there's momo traders watching, which we don't know of course, there's a possibility we could see some volume and price increase start to appear, but I'm not looking for it ATM. The 200-day SMA is $0.3118 and will continue to drop.
Regardless, with us being still in the window of when news might have an effect, I wouldn't lay a lot of weight on all this TA stuff yet.
On my experimental charts stuff, we still have below-normal average trade sizes (although it is slowly improving), buy:sell continues a choppy trend towards normal. Although we may focus a lot on the failure to "launch", we should keep in mind what's really going on. I posted the intra-day VWAP trends several days in a row now, so here's today's, shortened a little: $0.3003, $0.2973, $0.2967, $0.2932, $0.2973, $0.2992, $0.3015, $0.3059, $0.3062, $0.3238 and $0.3388.
Maybe things are not so dire, huh?
My original inflection point calculations are starting to lose some of the upward trend, as are the newer versions. Neither version has yet made a pattern strong enough to suggest coming action.
Details of "Dly Sht % of 'sells'" and inflection points are in the latest daily post above.
03/04/2013: EOD stuff partially copied to the concentrator.
# Trds: 76, MinTrSz: 100, MaxTrSz: 19179, Vol 304233, AvTrSz: 4003
Min. Pr: 0.3002, Max Pr: 0.3400, VW Avg. Tr. Pr: 0.3238
# Buys, Shares: 62 261212, VW Avg Buy Pr: 0.3229
# Sells, Shares: 14 43021, VW Avg Sell Pr: 0.3290
# Unkn, Shares: 0 0, VW Avg Unk. Pr: 0.0000
Buy:Sell 6.07:1 (85.9% "buys"), DlyShts 43363 (14.25%), Dly Sht % of 'sells' 100.79%
Well, with the PR about ePower and Axion having a "commenced a strategic relationship" with an initial five-year period in place, we got the results we'd expect ... if we didn't have a history of dropping on good news, as Metroneanderthal highlighted in the concentrator today. Anyway, finished up 8.1%, even after the "late-day weakness" came in (more on that later).
I want to touch on some traditional TA stuff that may come into play, especially if this pop is a one-day wonder (I don't really think so). First, my short-term descending resistance added last week got broken after only two days of holding. That is now in the past and we won't be re-visiting for some time, if ever.
Second, I had added a very "iffy" long-term descending resistance line over the weekend while trying to think what might happen if we got news. It wasn't one I would normally add, but I managed to get something I could try and live with.
Blew right through it. So, it was worse than "iffy". I've found a new home for it, which is quite attractive, but it's too early to really consider it yet. So I'll first revert to some that have a history already.
We came within a gnat's ass of bumping the former support, now potential resistance, of the rising trading channel from November. AFAICT it's at ~$0.3420 and rises about $0.01/week. So that's the first potential near-term resistance. If the news causes a multi-day pop, we shouldn't spend any time at all below it tomorrow. But we do have to keep in mind that $0.35 and $0.37 has acted as resistance and support multiple times in our recent past, so we have a couple more potential pauses or even reversals laying in wait for us at those points. However, they are now within the old rising trading channel. If price gets inside that, on volume, and confirms, on volume, those points may be just pauses at the worst, with $0.37 being the stronger of the two. I say that for reasons of both percentage rise, likely inducing some more profit taking by short-term oriented decisions, and the fact that my new long-term trend line, only slightly less iffy than before, sits at ~$0.3680 today and drops ~3/10ths of a cent every 2 weeks. Back to the November rising trading channel ...
The rising resistance (and still resistance, rising ~$0.01/week) of the old trading channel is ~$0.405 AFAICT. I can't say that if we get inside the channel and confirm we should make "full swings", but they would not be unreasonable when you think of legs up and down in percentage terms over, say, 8 days (the length of our two up legs inside the channel - we did make "full swings"). Down legs took longer because each was extended with sideways moves - they ran 18 days, one resulted in another up leg and the last resulted in a break below support of the channel.
Moving to the oscillators, last Thursday, they were mixed and Friday all had started moving more positive. Today's combination of price and volume improvement resulted in all swing decidedly positive. RSI bullish at ~64.7, MFI ~70, momentum 1.15 and ADX and related improving to DI+ of 29 with DI- at 7 and falling. It'll take the ADX itself a while to get to 30 or better, where it would be a bullish sign.
Finishing up the traditional stuff, our normal "late-day weakness" was late today. It didn't come in until 15:37 today, at least a couple hours later than "normal". The prior twenty minutes or so we hit the day's high of $0.34. And the weakness wasn't high-volume either - 33.8K shares (11.11% of volume) at a VWAP of $0.3357 - not far from the high - another nice change. Before the "weakness" appeared, buy:sell was 18.63:1.
I logged most of the moves in bid ask and will summarize them as being refreshing in that the sellers eventually recognized the buying pressure and finally began raising the asks just before lunch time, with the bids reluctantly following them up. During the early part of the day this was not the case, demonstrated buy the buy:sell mentioned above. Through 13:00 it was 26.54:1. Trades were mostly going at the ask with no changes of note in the asks.
I'll skip most of the experimental stuff today, on the premise that when we get a news-induced pop it's not going to add much to what we've already observed. As we might expect, the original inflection point calculations are less unorganized and began forming up to generate a signal and the new version, which had begun forming such earlier, continued to do so more strongly. As before, looking at the numbers rather than the squiggles showed much more clearly the improvement. The small average size remains a concern. I don't know if this is just because most buyers were retail or if because market-makers kept them small trying to milk as much profit as possible out of the strong buying sentiment.
Let's hope today's buyers were of the "strong hand" variety and not predominately the type to release scads of shares at low profit levels or the first sign of price retrace.
Details of "Dly Sht % of 'sells'" and inflection points are in the latest daily post above.
03/01/2013: EOD stuff partially copied to the concentrator.
# Trds: 21, MinTrSz: 200, MaxTrSz: 21600, Vol 97540, AvTrSz: 4645
Min. Pr: 0.3000, Max Pr: 0.3100, VW Avg. Tr. Pr: 0.3062
# Buys, Shares: 7 25640, VW Avg Buy Pr: 0.3097
# Sells, Shares: 14 71900, VW Avg Sell Pr: 0.3050
# Unkn, Shares: 0 0, VW Avg Unk. Pr: 0.0000
Buy:Sell 1:2.80 (26.3% "buys"), DlyShts 200 (00.21%), Dly Sht % of 'sells' 0.28%
Well, today ended up sort of like I wondered about yesterday - low volume. And the range was also kept narrow by NITE starting the day bracketing both sides of the market with a "standard" 2.5K size with bid/ask of $0.3001/$0.31. At the open 2.7K shares traded at $0.31 and NITE presented an ask of $0.315. Bid moved to $0.3055 - I forgot who did it. Then ATDF did their usual "me first" and placed a 10K offer at $0.3099 at 9:50. Pretty much normal stuff thereafter with (mostly) ATDF trying to be both first in line and cheap at the same time.
Although the low volume makes any traditional TA stuff somewhat "iffy", I want to touch on a couple of things that I think are significant. We might have a "sneaky" climb back up going on, or ...
Caution is warranted because a large, well-capitalized market-maker, like Knight Capital Management, has been controlling the bid/ask and may be "working" the price up to meet their own ends. I'll forgo the TFH stuff beyond that suspicion. I'll just remind that for several days now they have been establishing the early range with early narrow-spread entries on both the bid and the ask. Daily short sales have been extremely low. Of course, this has been quite common ever since we started seeing a single market-maker predominately occupying both sides of the market, including ATDF, TEJS, NITE, and occasionally UBSS. I think this suggests a lot of intra-broker trades or the MMs are short-term long.
First, the potential descending support I began mentioning a couple days ago is holding - we topped and closed right on it AFAICT - $0.31 (actually, the close was $0.3099 but I can't nail the trend line price that precisely anyway). But it has been under attack for three consecutive days now and price range has not materially retreated. In fact, the lows have risen three consecutive days now. With the highs pretty much "flat" eight of the last ten days, this makes a rising triangle pattern. This breaks upward 70% of the time. However, this is a very short-term pattern so far and I don't know if it's behavior will follow the normal behavior. But with the two up days in the last three days both having higher volume than the down day, it seems there's a reasonable chance it will behave "normally".
Although the trend has been "choppy", the oscillators I follow are trending up. Several have achieved at or near "neutral" readings, including RSI @ 51.52, momentum @ 1.033, and the stochastic %K up at 64.44 and moving towards a bullish indication at ~80, above which it suggests overbought, but often holds there for a while as price appreciation occurs.
If we can just get some volume to come back while this is going on, I think we have some room to the upside.
I want to mention again that we've a "golden cross" that will continue to show a widening between the 50-day SMA, currently $0.3166, and the 200-day SMA at $0.3125. If price doesn't retreat, we have at least 13 more days of a rising 50-day SMA. If there's any traders out there that respond to such stuff, the widening gap should catch their eye.
Last, I've not recently looked at the MACD that DRich brought up some time back. Its histogram has been steadily improving since about the 19th and it's dead-nuts at neutral now, with the signal line about to cross above its average. The histogram low for this cycle did not go below the low of the prior cycle down, so I think the long-term up trend he identified is still in play.
On my experimental stuff, average trade size is still around the low mid-point of what I believe is "retail", but is haltingly trending towards more normal readings. Buy:sell remains stuck in low ranges, suggesting that someone is taking advantage of the price creeping up to both release a few shares and keep the price working up - it's not irrational buyer demand that's pushing price here.
In spite of the above, if we ignore my TFH stuff, we have some positive things happening. The one I like the best is that intra-day VWAP continues to recover from its downward movement: $0.3214, $0.3054, $0.3080, $0.3003, $0.2973, $0.2967, $0.2932, $0.2973, $0.2992, $0.3015, $0.3059 and $0.3062. If any of the sellers wake up and smell the roses, they might be able to get some higher prices out of this trend. Another thing I like is maximum trade sizes suggest there are some careful buyers out there that are willing to soak up some shares at the current price levels: 20000, 22500, 22000, 9000, 15000, 10000, 5600, 12329, 24600 and 21600. I think some percentage of these folks are "strong hands".
The original version of my inflection point calculations continue to suggest nothing. One of my newer versions, the one I currently show in my instablog, is telling a story though. It says there is improving sentiment. The pattern is setting up quite similarly to what was seen shortly before the rising trading channel began in the middle of August and before the additional price bump that began around the end of the year. [EDIT" ACK! I think I confused events - exiting big uglies and rising trading channel. "rising trading channel began in the middle of August"
s.b "rising trading channel began in the middle of November"]. Of course, we were in the rising channel on that second item and ended a sideways trade when we "bumped" the rising support. We don't have that at the moment, but every trend has to start somewhere. It'll be interesting to see if the pattern matures and if price behaves accordingly.
Details of "Dly Sht % of 'sells'" and inflection points arein the latest daily post above.
Disclosure: I am long AXPW.OB.
Additional disclosure: I am very experimental, still learning TA and am not very conservative in my trading. But I am conservative regarding my confidence in what I'm learning and my attempts to share with others what I think I see coming. Your own DD is mandatory.