Copper has long been regarded as a leading indicator of the state of the economy worldwide. Copper prices recently touched $2.25/lb., a low not seen since the 2008-2009 financial crisis, where it fell below $1.50/lb. before quickly recovering moving out of 2009 into 2010. I'll explore some of the factors currently at play and where the copper market may be headed.
Copper Pricing
Copper is priced in US dollars and so is sensitive to interest rates. The Federal Open Market Committee (FOMC) voted last week to keep the fed funds rate at historical lows, with a target of 0%-0.25% - but the overwhelming expectation is that easy money won't last long. If the Fed doesn't raise rates in October, it is highly likely to do so in December or early 2016 at the latest.
So, what does this mean for copper? Low interest rates theoretically result in inflation and a weaker dollar. Since copper is priced in USD, less of a foreign currency is needed in a weak dollar environment to purchase the same amount of copper. Say, for example, the USD/JPY (Japanese yen) exchange rate is about 120 (yen per 1 USD) in today's environment. Copper, at $2.30/lb, would cost a citizen of Japan $2.30/lb x 120 JPY/USD = 276 yen. Now the dollar continues to weaken due to low interest rates and the USD/JPY drops to 110. It will only cost our same Japanese citizen 253 yen for a pound of our $2.30 copper ($2.30/lb x 110 JPY/USD = 253 yen). Copper is cheaper from a Japanese standpoint, and the law of demand states that when a good is cheap, demand increases. Scale this example to the overall world economy; higher demand depletes supply, eventually increasing the price of the good. And the cycle continues.
Since most commodities are settled in USD, they typically have an inverse relationship with the strength of the USD.
However, with low interest rates and money printing prevalent throughout the world today and the fear that the Fed is likely to raise rates sooner rather than later, the dollar is not losing much ground to other currencies, if not continuing to strengthen and, thus, pushing the price of copper down.
This is obviously a crude oversimplification of the effects of currency on the copper market, but it serves the purpose of providing a bit of guidance.
VERDICT: Bearish
Copper Supply & Demand
Analysts had predicted a 13-year supply glut of 272,000 tonnes in 2014 and a 350,000 tonne surplus in 2015. However, a number of mine disruptions - some natural, some a consequence of the low price environment - have eaten into the glut and could culminate in a deficit by the end of the year.
Glencore has announced that it is pulling 400,000 tonnes off the market over the next 18 months by shutting down two of its African operations. Indonesia recently stated that it is not renewing Newmont's export permit, as the miner failed to construct a smelter for its Batu Hijau mine, as was stipulated by the Indonesian government. Indonesia imposed a large export tax on unrefined copper in 2014 in hopes of persuading all miners to install smelters, as a more finished product would bring more money into the country than concentrate. A non-renewal for Newmont would potentially trap 500,000 tonnes of copper and gold concentrate in the country and take it off of the international market - at least temporarily until the permit negotiations have been resolved.
Bloomberg has estimated that 1.5 million tonnes of output has been lost to disruptions this year already between riots, earthquakes, power outages, and shutdowns. While Goldman still anticipates a 506,000 tonne surplus this year and 673,000 tonnes in 2016, Citibank estimates a 284,000 tonne deficit next year. None of these estimates take into consideration the Newmont situation in Indonesia.
On the demand side, China currently consumes over 40% of worldwide supply. Fear abounds that the Chinese economy will continue to slow down and imports will drop off. However, that has not been the case to date. While imports of refined copper products are down year-to-date, concentrate imports are up 12%. Concentrate imports in August are up 20% from a year ago and up 18.6% since only July!
VERDICT: Bullish
CAPEX
Another factor to consider is the decrease in spending on new projects and expansions. Take a look at this chart from mining.com, comparing this metals downturn with the one of the 1990's.
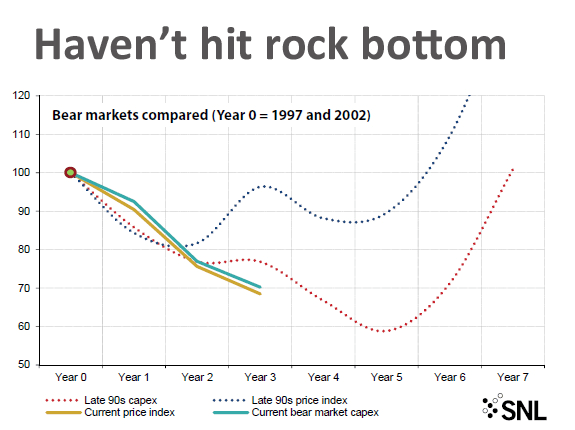
(Note: The graph incorrectly states Year 0 = 2002; It should be 2012, which was the peak of capex spending, according to this September 21, 2015 article that the graph appeared in).
The pattern is intuitive; capex falls off, reducing supply, until prices start to recover, eventually leading to a recovery in capex spending as miners chase the higher metals prices. While we may not have hit bottom yet in copper prices, the numerous shutdowns and disruptions signal that the end is near. Eventually, we will start seeing a divergence in the current price trend vs. capex spending: prices will begin to recover but capex spending may fall off for a few more years.
VERDICT: Bullish
Conclusion
While the money games being played by the Fed will impact the price of commodities in some fashion, it should not have nearly the impact of the reduction of supply from disruptions and shutdowns, the increasing demand from China, and the reduced capex spending of mining companies. Copper continues to be an indicator of the state of the economy. The current price trend of copper is telling us that, while still shaky, the economic recovery has legs. Now may be a great time to consider copper miners in mining-friendly jurisdictions (e.g. Canada) with strong balance sheets who are currently operating profitable mines.
VERDICT: BULLISH!