Although many economic indicators are positive, some troublesome headwinds continue to slow the economy. One drag on the economy is that several indicators - retail sales and various housing measures, for example - remain below the highs reached in previous business cycles. Another more recent friction is that some indicators, while staying positive, are signaling lower rates of growth.
This suggests that although the economy will continue to grow, it may do so at a rate that is slightly lower than that of the past year. For now, no recession is imminent, just middling growth.
Main Street Economic Indicators
Real corporate profits adjusted for inventory valuation and depreciation
Status: Profits appear to have peaked for this business cycle
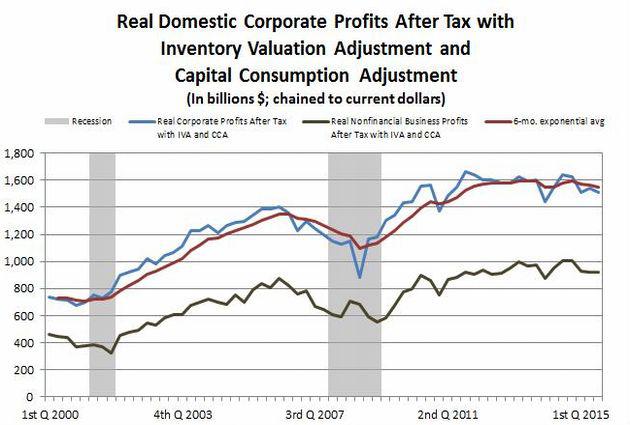
When adjusted for inflation, inventory valuation, and depreciation, corporate profits for all industries have decreased steadily since the 3Q of 2014. 3Q 2015 adjusted profits are 2.1percent below 2Q, and 8.3 percent below 3Q 2014.
Profits for nonfinancial industries had a lower rate of decrease from 2Q 2015 to 3Q, only 0.7 percent, but, year-over-year, 3Q 2015 profits are 8.9% lower than 3Q 2014.
One bit of a silver lining is that in real terms, corporate profits are at a significantly higher level than profits prior to the 2007 - 2009 recession. Pre-recession, adjusted profits peaked at $1.401 trillion in 3Q 2006. This compares to the post-recession peak of $1.664 trillion in 4Q 2011, which is 19 percent higher than the 2006 peak.
Building permits
Status: Increasing, but at a slowing rate
Historically, building permits have peaked well before the end of a business cycle. Although building permits are on an upward trend, even if we ignore the housing boom years of 2002 - 2005, housing isn't contributing as much to economic growth as in past business cycles. However, every increase is a positive for the economy.
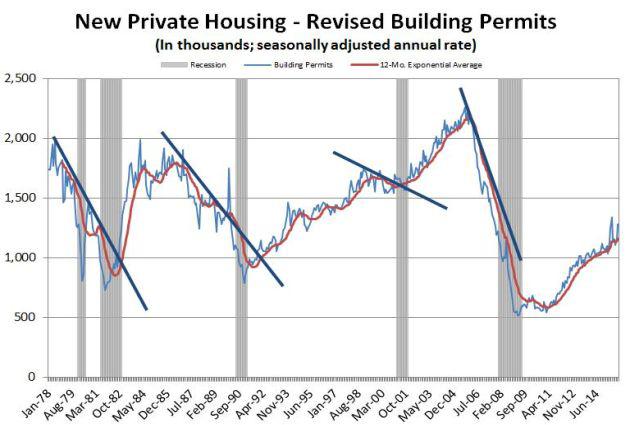
In November 2015, 1,282,000 building permits were issued. This is an 18.8% increase over November 2014. However, the 6-month exponential moving average is flattening, indicating a slower rate of growth.
Job openings and new hires per 100 workforce participants
Status: Flattening
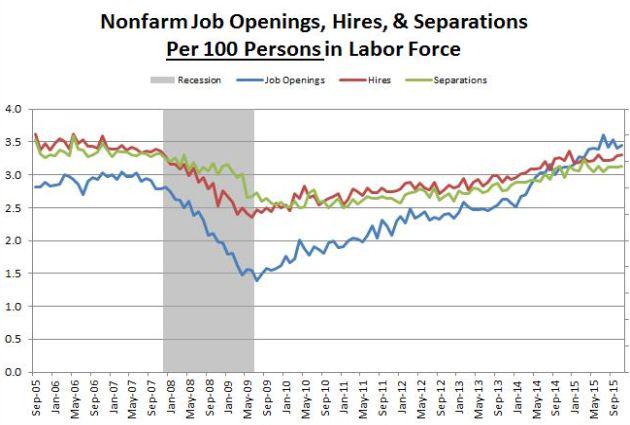
Job openings per 100 workforce participants peaked in July at the highest levels ever: 3.608. In November, the latest available month, had 3.451 openings per 100 workers.
However, new hires remain below pre-recession levels. Hires peaked in May 2006 at 3.621 per 100 workers. Post-recession, hires peaked at 3.355 in December 2014.
Total vehicle sales
Status: Approaching peak
Vehicles sales have been a strong indicator of the business cycle, peaking near the middle of a growth cycle and then declining well before recessions hit. Currently, although the past three months have flattened, vehicle sales remain high. Part of this may be due to pent up demand, but sales would not be this high unless consumers felt reasonably confident about their own economic well-being. 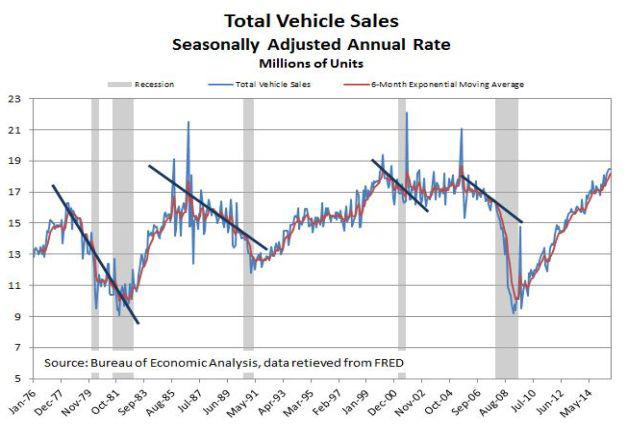
The current 6-month exponential moving average of 18.22 in November is above all but two months in 2005. Of course, if vehicle sales were adjusted for population growth the current moving average would be lower, indicating that vehicle sales per capita, while close, have not yet reached pre-recession levels.
Real net domestic private investment
Status: May have reached peak
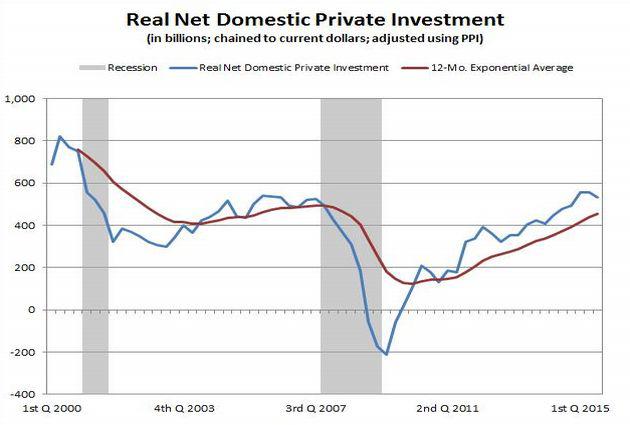
Net domestic private investment is important because it is the money used to expand economic capacity. Real net investment hit $557.9 billion in 1Q 2015, exceeding the pre-recession peak of $540.4 billion in 1Q 2005.
Although investment is up from 3Q 2014 to 3Q 2015 by 11.3 percent, 3Q 2015 is 4.3 percent below 2Q 2015.
Real retail sales per capita
Status: Flattening at a level that is below the last business cycle
When adjusted for inflation and population growth, retail sales is a good business cycle indicator, more consistent with the business cycle than unadjusted sales. As shown in the below chart, retail sales has been a disappointment since the last recession. 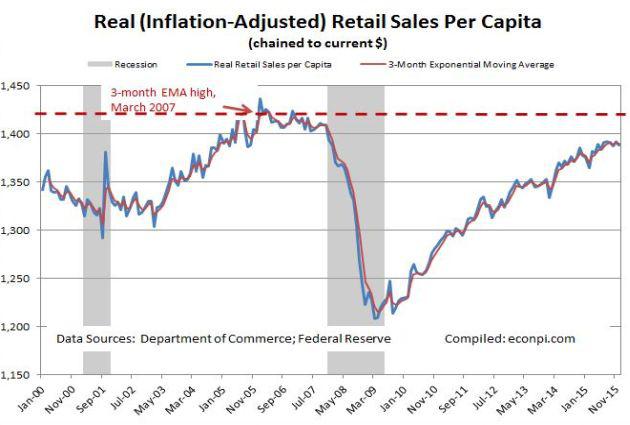
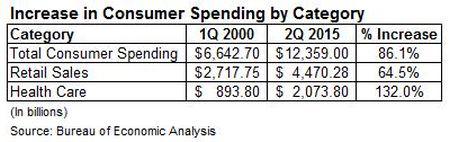
Sluggish retail sales may be in part due to the fact that retail services (landscaping, tax services, health care, etc.), which are an increasing part of the economy, are not included in retail sales.
For example, it is interesting to note the relationship between total consumer spending (personal consumption expenditures) and spending on retail sales and health care services. As shown in the below table, from 1Q 2000 to 2Q 2015, spending on health care services has increased at a rate double that of retail sales.
And, the portion of total consumer spending going towards health care has increased while the amount for retail sales has decreased.
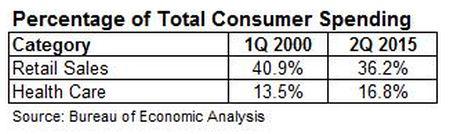
The fact that retail sales are becoming a smaller portion of consumer spending doesn't mean retail sales shouldn't be track. When adjusted for inflation and population growth, retail sales is still a dependable indicator of the business cycle.
Temporary workers
Status: Increasing, but at a lower rate of growth
Whether good or bad, changes in the number of temporary workers provides a good indication of the business cycle. The reason for this is simple - temporary workers are often the first to be let go when the economy slows, and hired when things improve.
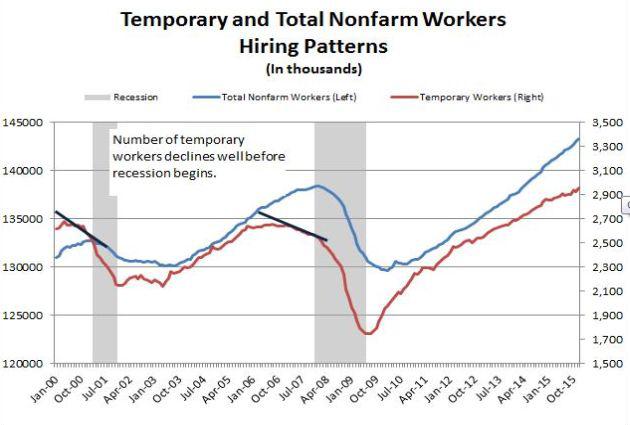
There was a large jump in temporary jobs in December, but data from the past year shows the rate of hiring, while positive, is decreasing.
Consumer sentiment
Status: Relatively optimistic
The Index of Consumer Sentiment, published by the University of Michigan, signals relatively high consumer confidence. However, the index has had a rocky year.
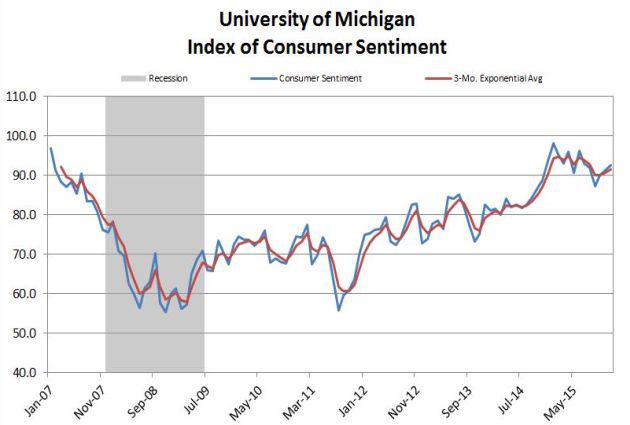
Year-over-year, the index is down 1.1%. But, over the past three months, it is up 6.2%.
The Surveys of Consumers chief economist stated that optimism in November and December was higher among lower income households and higher income households, probably reflecting that the well-to-do were more affected by the struggling stock market. In December, it was noted that consumers were encouraged by lower inflation, which improves real earnings. The mid-January survey indicates that consumers are feeling more optimism about the economy.
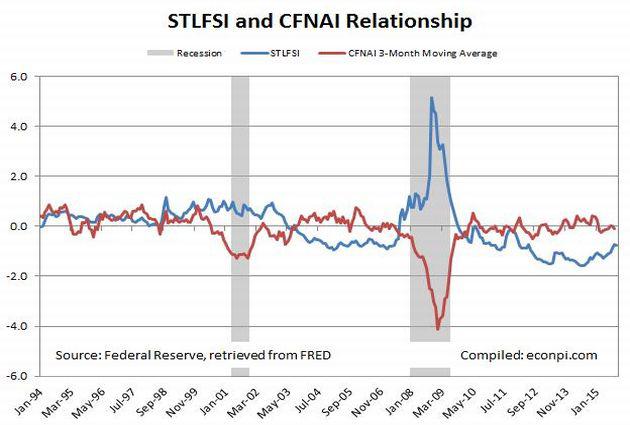
Composite Wall St./Main St. Indicator
Status: Indicates higher financial stress and decreasing business activity
I follow this composite measure because the St. Louis Fed Financial Stress index (Wall St.) and Chicago Fed National Activity Index (Main St.) when combined have provided a strong recession signal. These indexes have crossed and moved apart prior to the last two recessions. Currently, they are moving closer, which signals increasing financial stress and slowing economic activity.
Wall Street Indicators
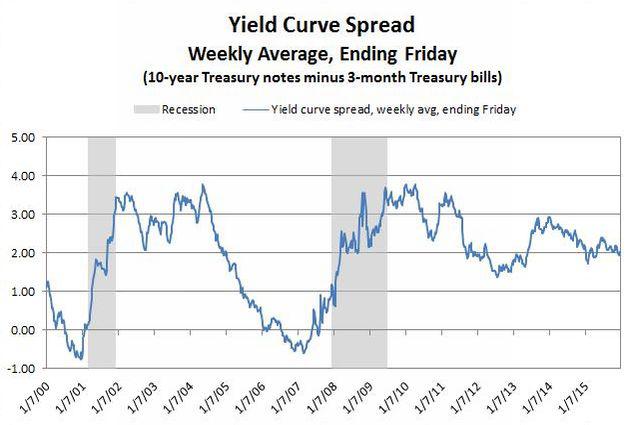
Yield Curve Spread
Status: Low to moderate financial stress
Due to ZIRP, the yield curve spread has remained in safe territory. This will be a good measure to follow as the Fed increases the federal funds rate. Recession or credit crunches have occurred after the yield curve spread between 10-year T notes and 3-month T bills has become negative.
Effective bond yields
Status: Increasing financial stress
Effective bond yields, especially for junk bonds, signal economic distress. However, indications are that the junk bond mess is specific to the energy sector, as this WSJ article points out.
Individual investors, rather than big banks or insurers are likely to bear the brunt of falling junk bond prices - as others have said, it's probably not 2008 all over again (there is a good summary article here). 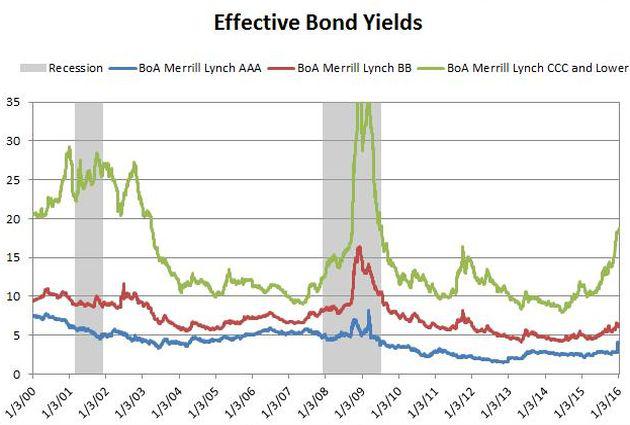
Support:
According to its own leading economic indicators, The Conference Board projects positive growth into the new year (read here). A current reading of the University of Michigan's Index of Consumer Sentiment projects that consumer spending will increase by 2.8 percent in 2016 (read here). The Cleveland Fed's Yield Curve-Predicted GDP Growth model forecasts growth of 1.9 percent (here). And, finally, the CBO optimistically projects growth of 3.1 percent in 2016 and 2.7 percent in 2017 (here).
Summary:
Although a recession is not imminent, most economic indicators offer no promise of accelerating growth for the U.S. economy. While not covered in this article, the global economy and Wall Street's angst are not helping either. Maintaining two percent growth in the U.S. will be a challenge. If corporate profits are peaking, expect other economic measures to soon do the same.
Follow my weekly economic indicator updates here.