I have written extensively on small-cap stocks in the last few weeks with a focus on structural tilts towards value and low volatility. Using an expansive market dataset, I have shown that these small-cap strategies have generated tremendous market outperformance:
- Small-cap value has generated a 14.8% annualized return dating back to 1926;
- Small-cap low volatility has generated 17-18% returns annually dating back to 1963.
The question I have most frequently received is whether investors should buy these small-cap strategies today? The answer, which most market prognosticators and analysts will not tell you, is that I do not know. It is not that I don't have faith that these factor tilts will continue to deliver outperformance across extended time periods and multiple business cycles. It is because I do not know you.
Investors are like snowflakes - each investor has a different investment horizon, risk tolerance, goals, tax picture, and current portfolio construct. Perhaps, most importantly, every investor has a different behavioral makeup that will factor into portfolio decision making.
Small-cap value has beaten the market by 4.7% per year dating to the pre-Depression era, but it has done so with heightened levels of volatility and large-scale drawdowns. The worst ten years for small-cap value stocks in the study are tabled below:
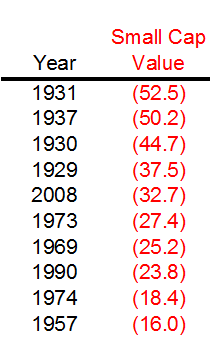
Smaller capitalization stocks are typically more levered to domestic economic growth and have higher incidences of price volatility. Four of these years (1929-1931 and 1937) occurred during the Great Depression as corporate bankruptcies soared. Two of the years (1973 and 1974) occurred during the stagflationary era. Patient capital could have waited out the fluctuations, and earned a compounded return that doubled their capital every five years over a ninety-year horizon.
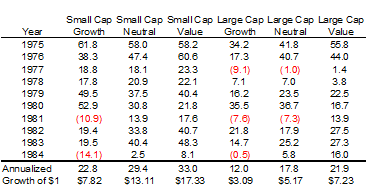
While small-cap value has had far higher volatility than large caps historically, these gyrations also create opportunities for entry. After that selloff in 1973 and 1974, small-cap value returned 33% per year for the next decade, far outpacing the returns of the other size and style cohorts.
If you take a hard look at your own investment behavior and do not believe that you have the ability to hold more volatile small-cap value stocks through their inevitable pullbacks, then perhaps small-cap low volatility stocks would suit you better.
As I demonstrated in "A Strategy That Sells Itself," low volatility small-cap stocks have historically generated returns that far outpaced the market with some of these cohorts actually experiencing lower volatility than the broader market. The risk-return plot below shows the realized returns of 25 portfolios formed based on size and volatility quintiles.
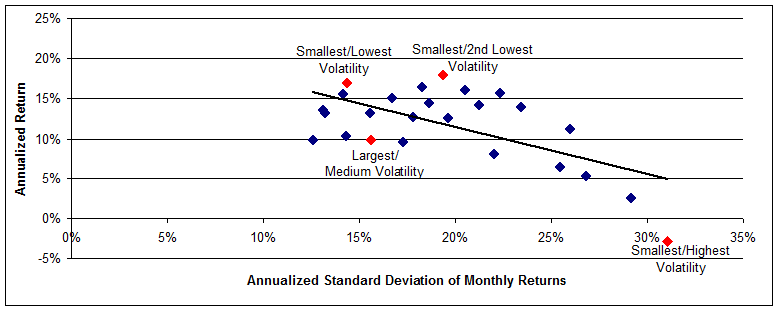
As I have demonstrated in many past articles on the Low Volatility Anomaly, the relationship between realized risk and return in this greater than 50-year dataset was negative. Lower volatility portfolios generated higher returns. While small-cap low volatility looks like a desirable factor tilt on this diagram, the strategy still would have experienced large scale drawdowns in 1973-1974 (cumulative -42%) and 2007-2008 (cumulative -38%).
Like much of life's choices, you have to take the good with the bad. For long-term investors, tilts towards value and low volatility have historically generated structural outperformance. These strategies tilt away from overpriced stocks and higher volatility stocks that have historically weighed on broader small-cap returns. Over long-time intervals, you will be happy you tilted towards small-cap value or low volatility small-cap stocks with incremental funds today.
For investors without the fortitude to hold through down markets, investors may look to tactically tilt towards small-cap value and low volatility stocks following periods of relative underperformance. Small-cap stocks have generated strong gains over recent weeks as these higher beta, domestic-focused companies have gained from the market re-pricing of the perception of future pro-growth policy actions by the Trump administration. For investors with a shorter-term focus, this may be a less advantageous entry point.
My goal here is to lay out the academic evidence so that Seeking Alpha readers can make the best decision for their respective portfolios, informed by their own personal investment constraints.
Disclaimer
My articles may contain statements and projections that are forward-looking in nature, and therefore inherently subject to numerous risks, uncertainties and assumptions. While my articles focus on generating long-term, risk-adjusted returns, investment decisions necessarily involve the risk of loss of principal. Individual investor circumstances vary significantly, and information gleaned from my articles should be applied to your own unique investment situation, objectives, risk tolerance and investment horizon.