When we last looked at CVS Health (NYSE:CVS) in April, it was attempting to bottom after correcting in 2016. The stock hasn't moved much since then, but the company did release some new earnings recently. So could CVS be set for a turnaround? Let's take a look at the charts and recent earnings report to find out.
CVS Provides Pharmacy Services
CVS Health's primary business is pharmacy services. The company operates over 9,600 pharmacies around the country. The company also provides pharmacy services to the long-term care market. CVS Health has some additional service segments as well. This includes infusion services through Coram, and the MinuteClinic retail clinics to treat minor injuries. CVS Health also operates a few other pharmacy chains, including Longs Drugs in Hawaii, Navarro Pharmacies in south Florida, and Drogaria Onofre in Brazil.
CVS Continues to Bottom
CVS, however, is still attempting to bottom, as shown in the monthly chart in Figure 1. The monthly chart shows that the stock climbed steadily from 2011 to 2015. But then CVS corrected back down to the highs of 2014. So the stock's been bottoming since late 2016. The bottom's held up over the last several months, though it dropped back a bit recently. Volume held steady during that time.
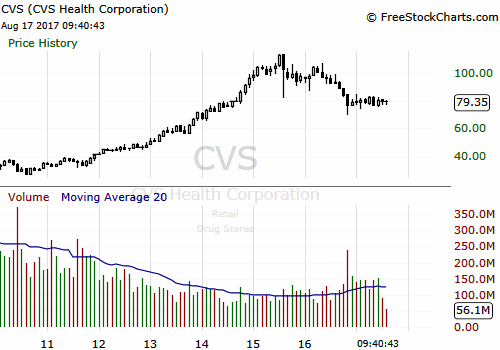 Figure 1: Monthly chart of CVS. Chart provided by FreeStockCharts.com.
The weekly chart gives us a closer look at the bottoming action. The stock's price action has been a little volatile over the past few months, which is pretty typical of a bottom. The bottom is starting to compress though (see red lines on Figure 2), which sometimes occurs before a move out of a bottom. The stock has a way to go though before the bottom completes, however. It has to sustain above about $88 to confirm that the bottom is over. Red volume dominated early during the bottom formation, as sellers continued to move out. The volume has evened out more over the past few months, and there's been more surges of green volume.
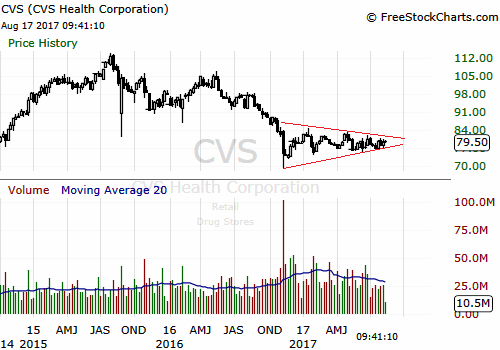 Figure 2: Weekly chart of CVS. Chart provided by FreeStockCharts.com.
We can see from the daily chart that the stock is stuck moving sideways. It looks like there's an equal mix of black and white candles, so neither buyers nor sellers are dominating right now. Volume has been pretty average during this sideways action. There a few days with red volume surges where sellers tried to sell the stock down. CVS always recovered quickly though. The was only one day with a green volume surge, but it didn't move price much. Volume has been quieter during the past month, though red volume dominated. Sellers haven't been able to move this stock down much, however.
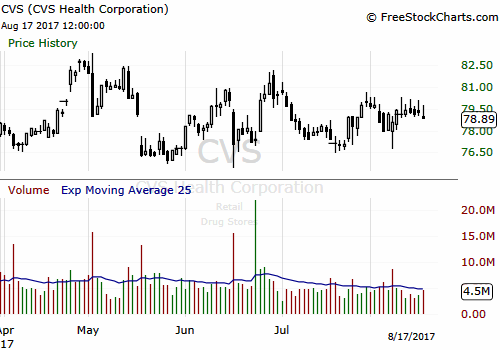
Figure 3: Daily chart of CVS. Chart provided by FreeStockCharts.com.
A quick check of some indicators confirms what we see in the candlestick charts. RSI is currently moving sideways right in the middle of its chart. Stochastics are also stuck moving sideways near the top of the chart.
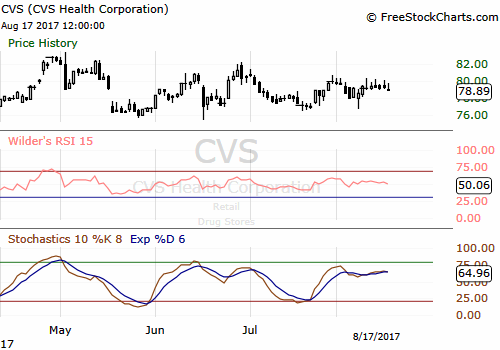 Figure 4: Indicator chart for CVS. Chart provided by FreeStockCharts.com.
Overall the charts show that the stock is still working on a long-term bottom. So expect price to remain volatile in the near future. The stock continues to move sideways, and volume has quieted down of late. The indicators are also stuck in sideways patterns. Perhaps this is the calm before the storm? A look at the most recent earnings report could give us some more clues about how CVS will perform down the road.
CVS Health's Financials are Slowly Improving
CVS's second quarter earnings report was released on August 8th, 2017. CVS reported revenues of $45.6 billion, which is a small increase over the first quarter and beat analysts' estimates of $43.7 billion. Figure 5 shows that revenues have fluctuated over the past several quarters. If CVS can start to stabilize and grow its sales, however, that will help encourage more investors to buy in. CVS also outperformed on earnings. Diluted earnings per share rose to $1.07, which is also an increase over the first quarter results. Costs continue to climb in tandem with earnings though.
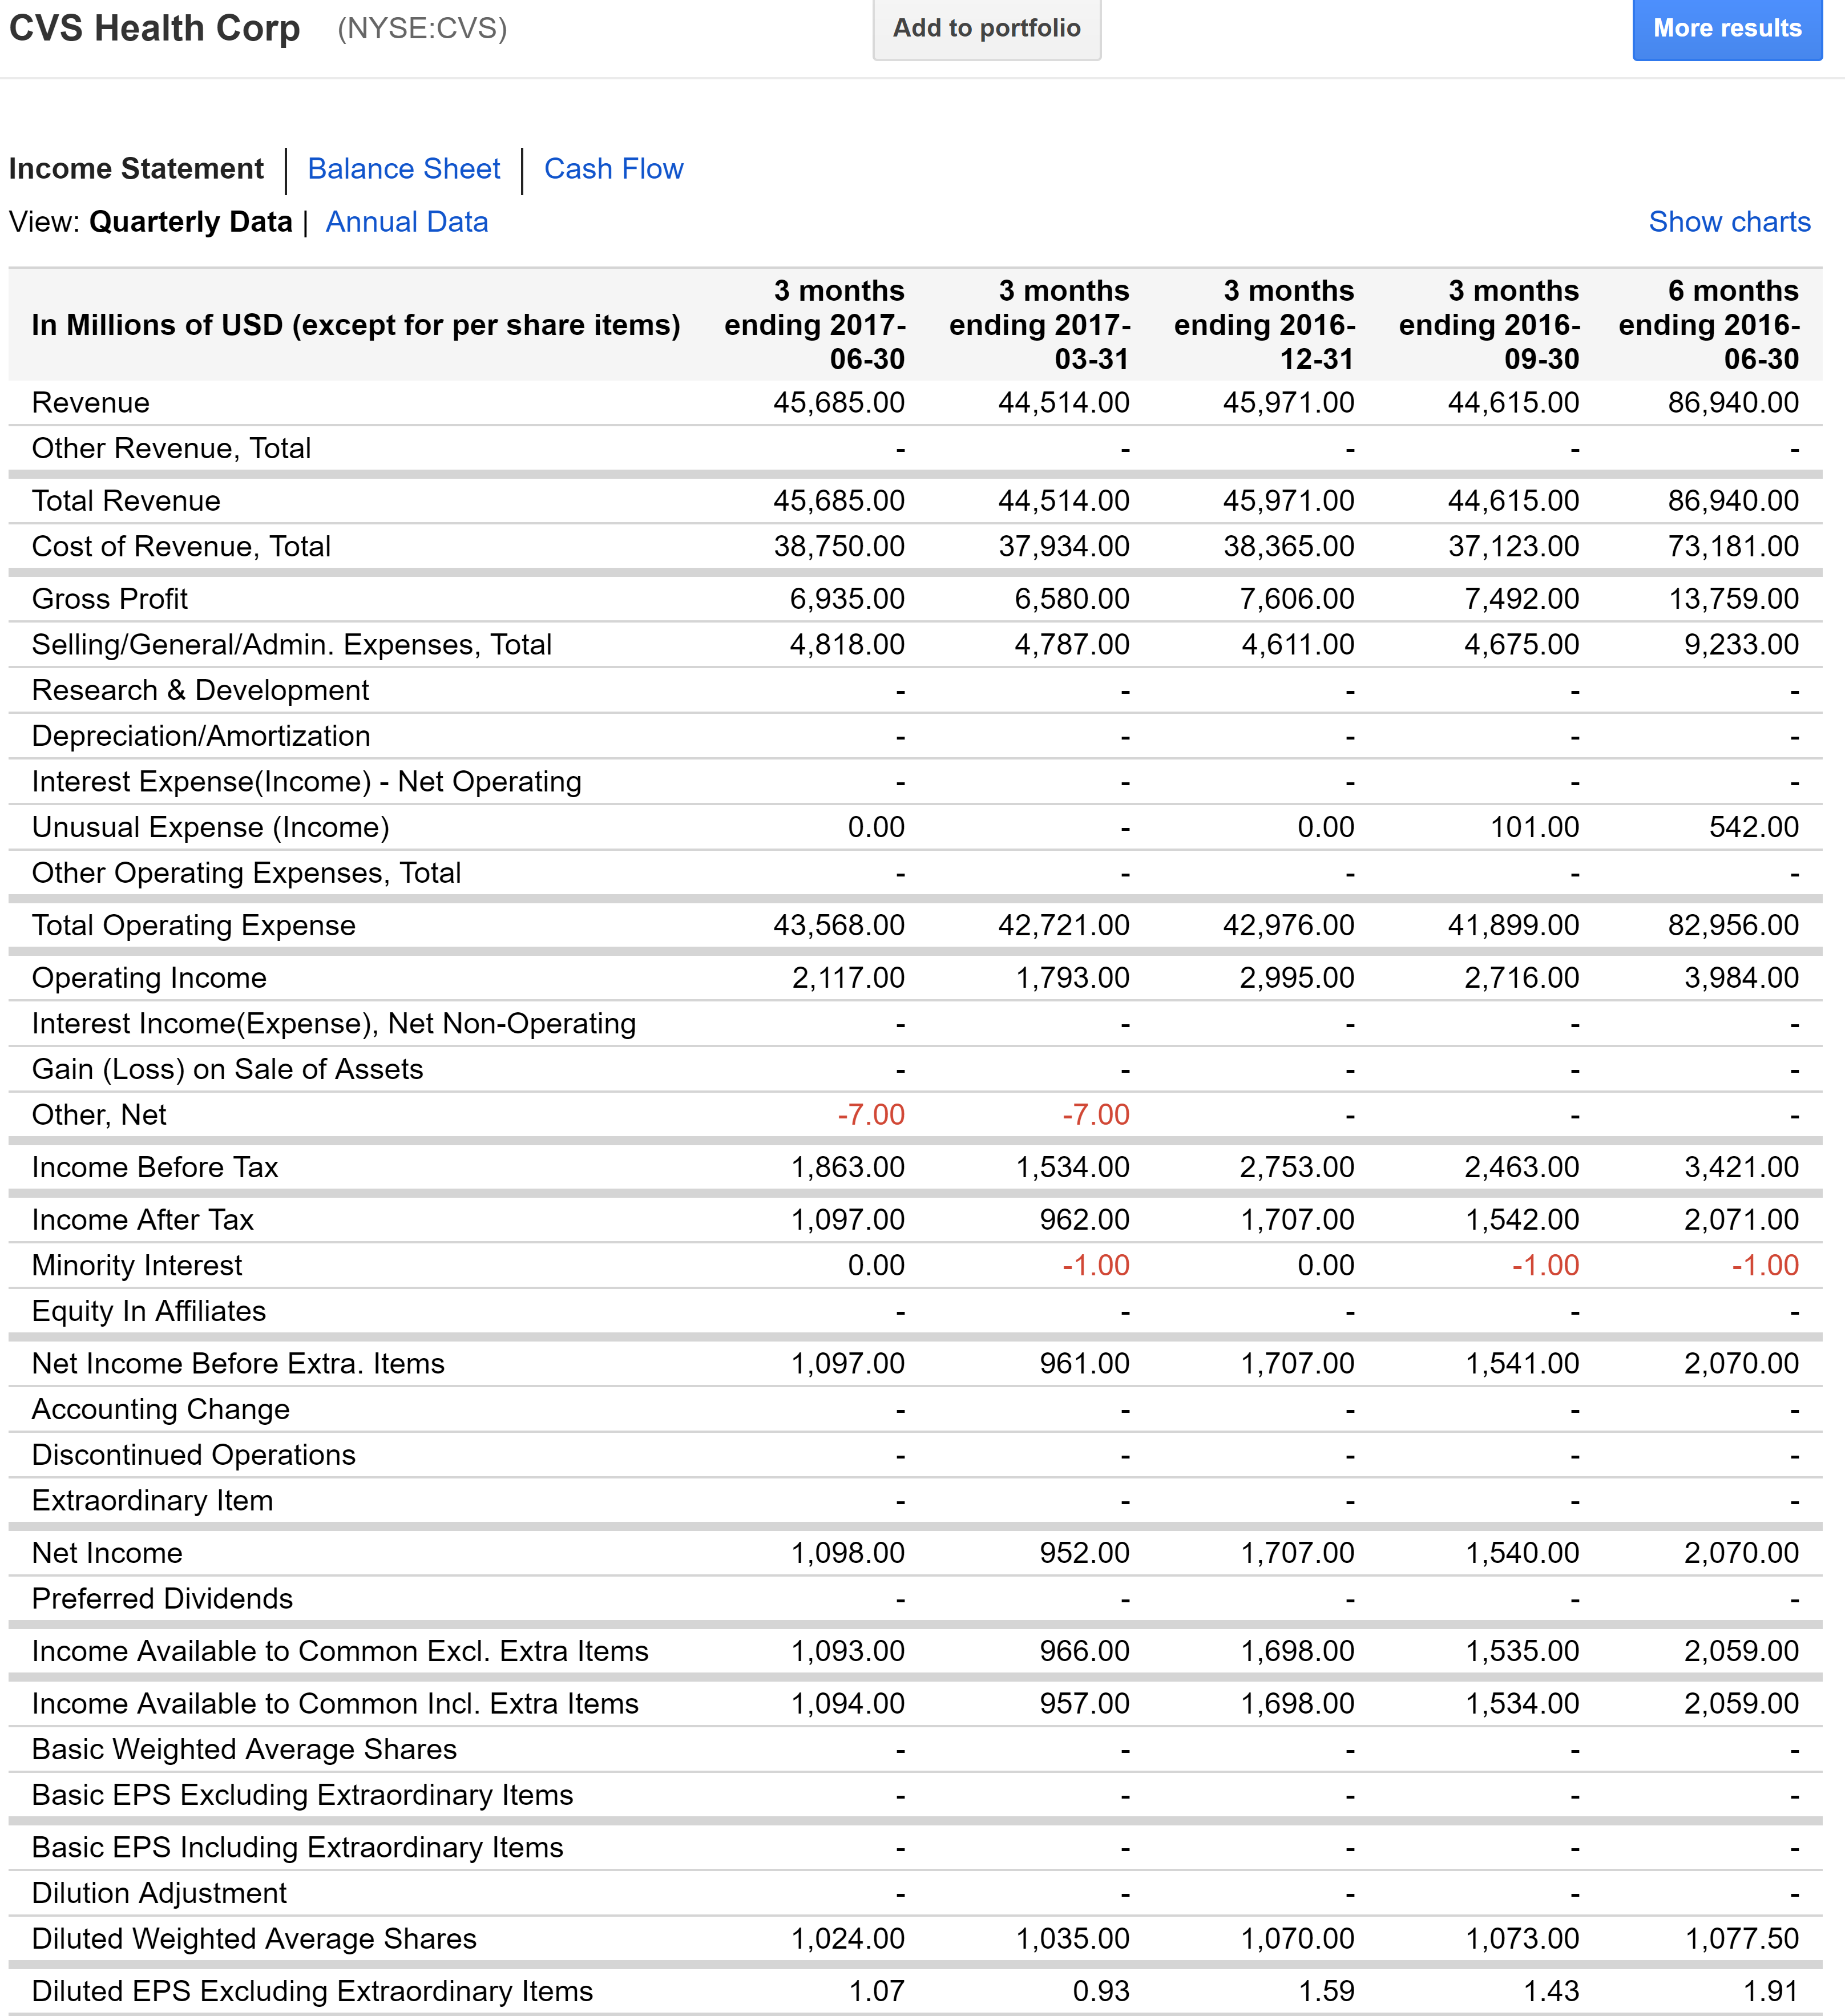 Figure 5: Income statement for CVS. Data provided by Google Finance.
Long term debt is still high. But at least it held steady last quarter instead of growing further. The current ratio is an abysmally low 0.5 though. So there's a risk that CVS Health could have trouble paying off its obligations.
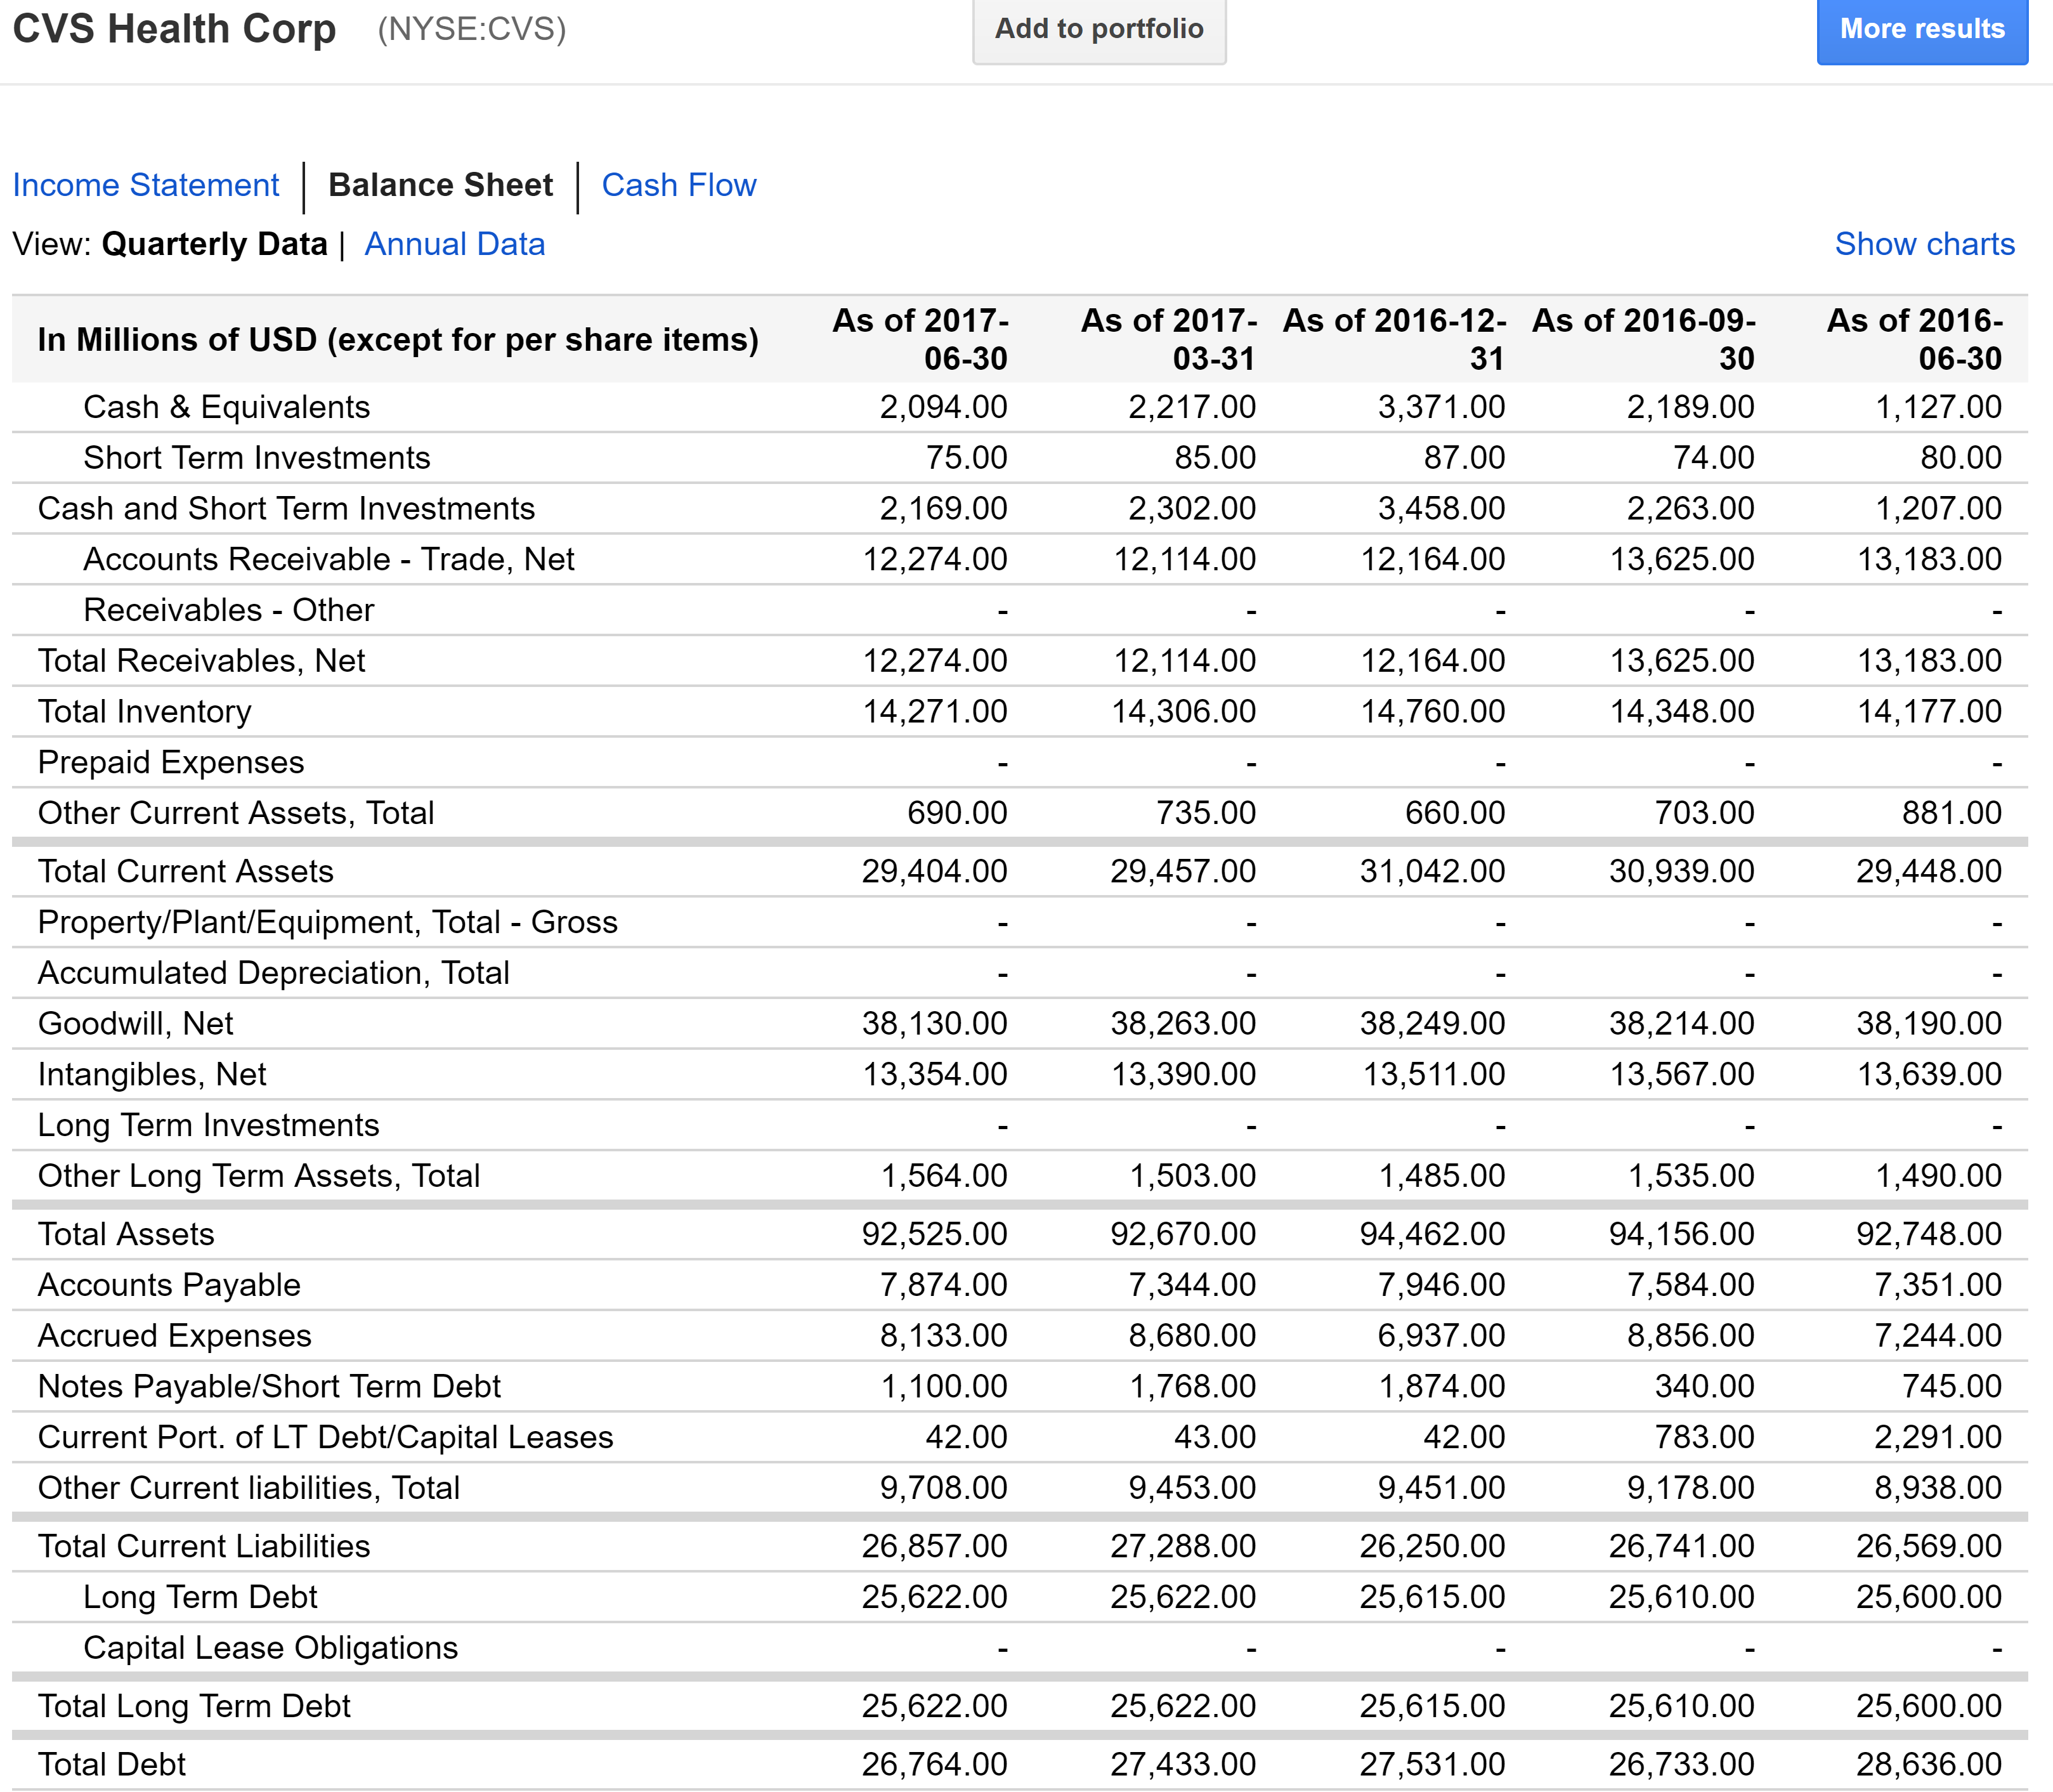 Figure 6: Balance sheet for CVS. Data provided by Google Finance.
CVS has a large number of institutions holding it, as can be expected for a large bellwether stock. Some institutional holders have been dumping though, as shown on Nasdaq.com. More institutions have lowered their shares than increased, and more sold out than started new positions. The question is, who's selling out and who's buying in?
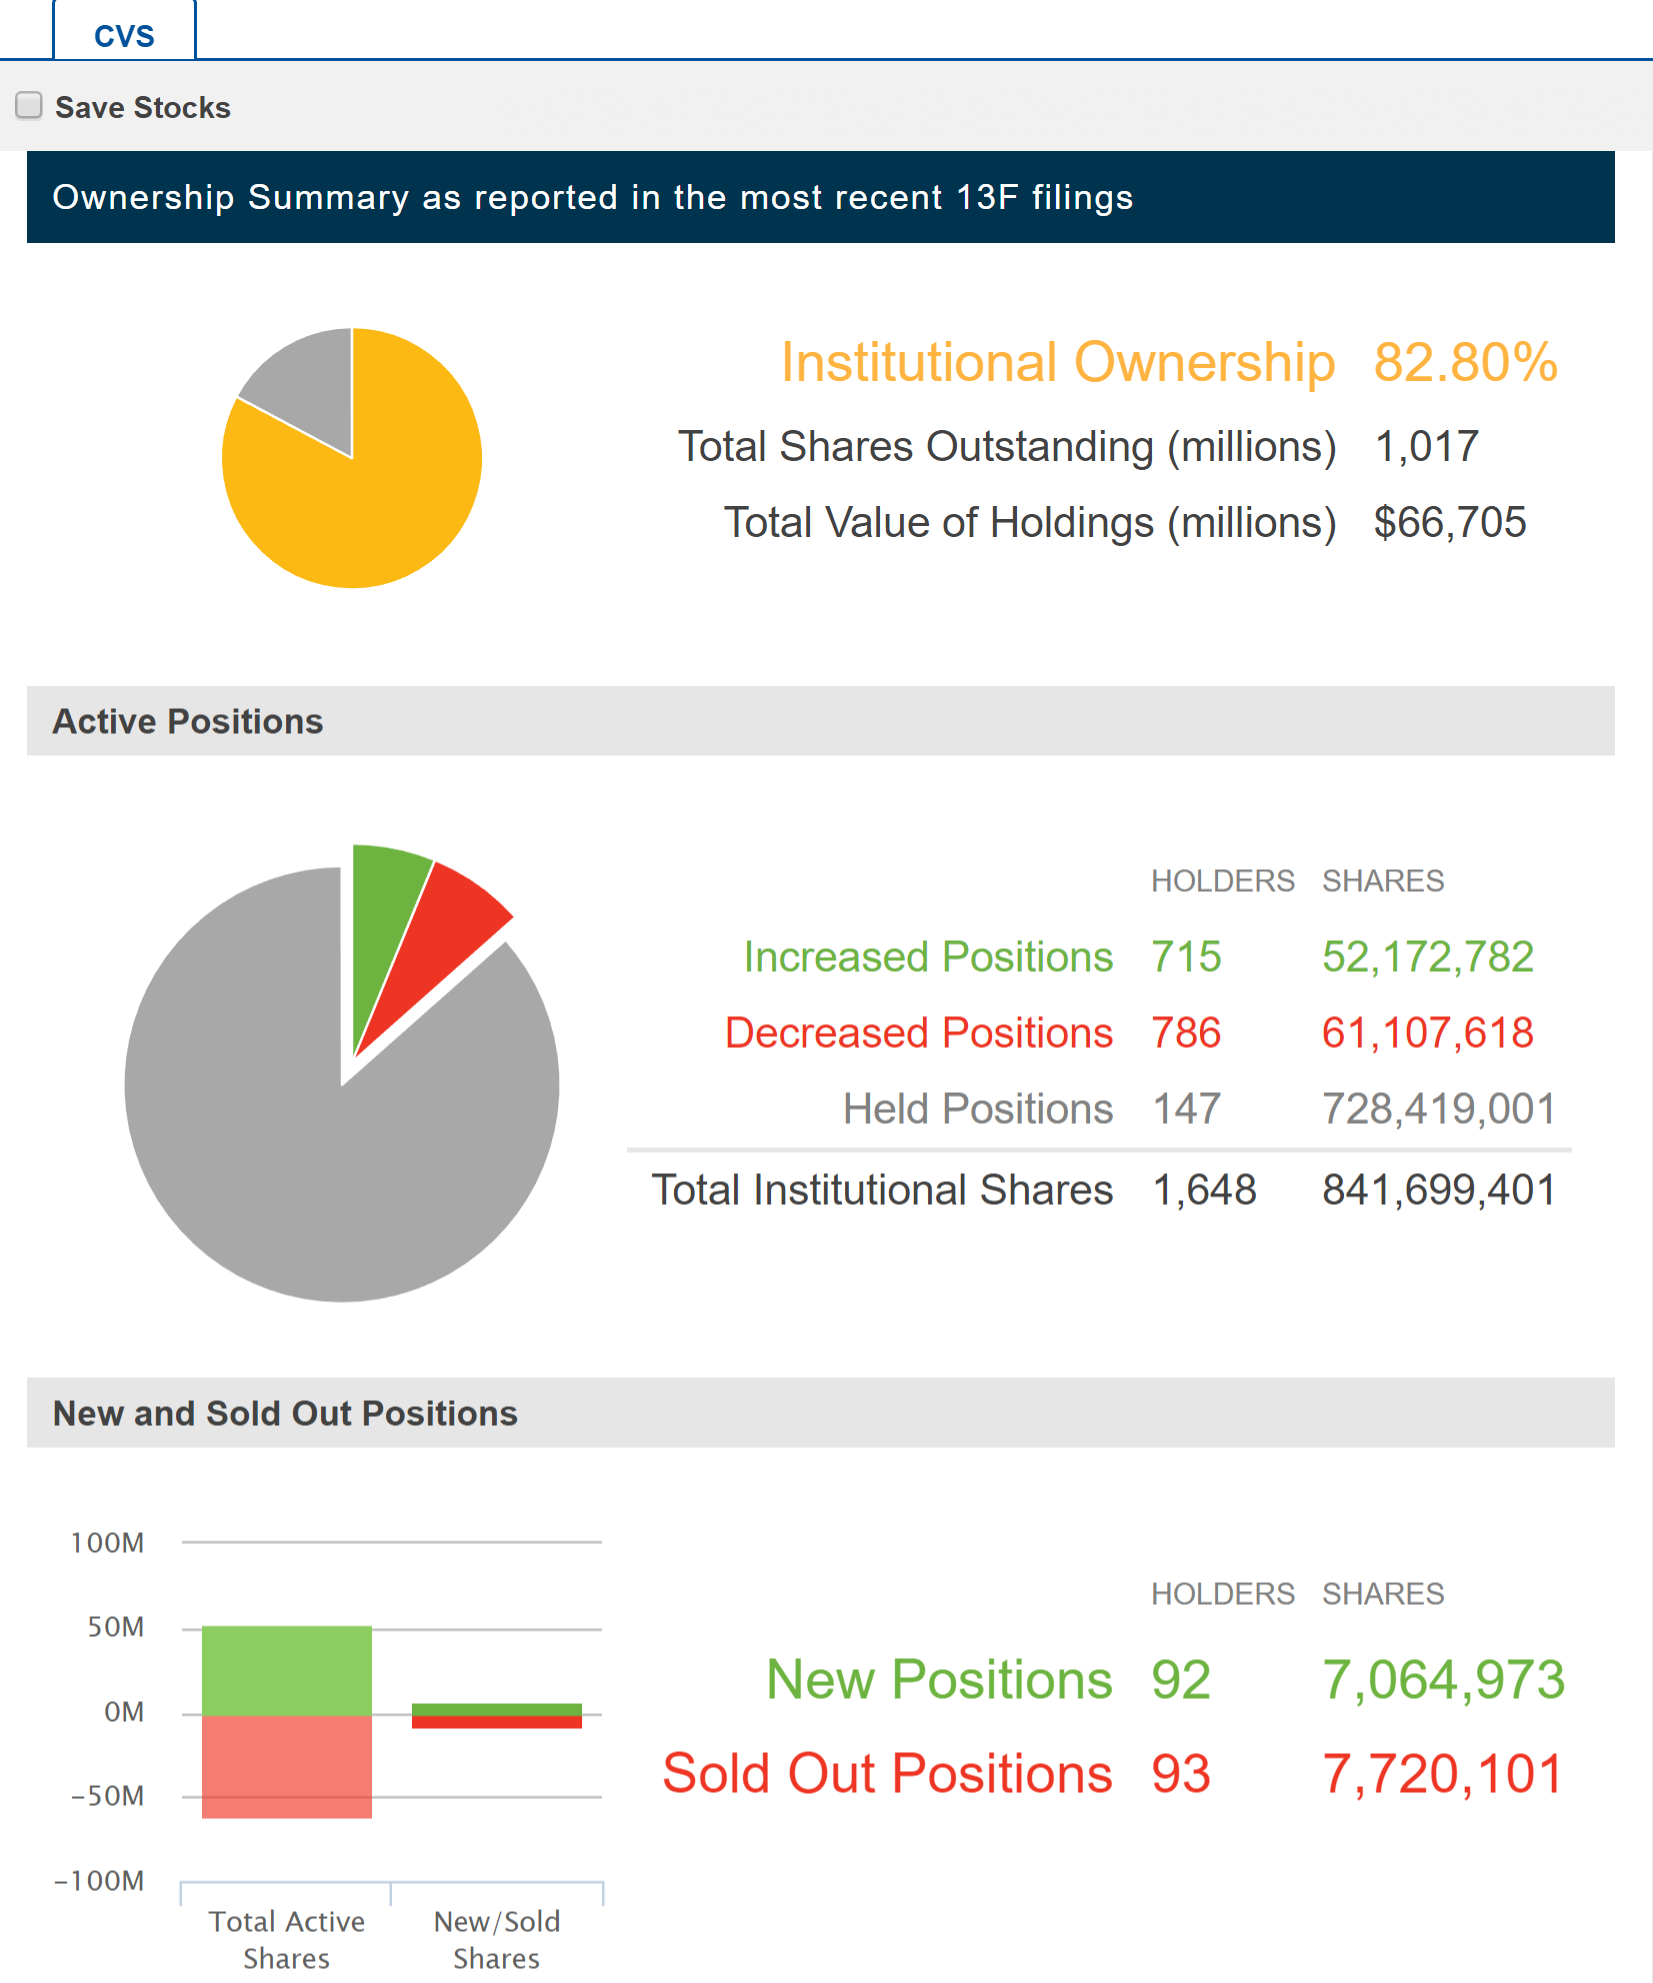 Figure 7: Institutional holdings for CVS. Data provided by Nasdaq.com.
The list of holders reveals that five giant buy-side funds are among the top holders. These funds have increased their holdings or held steady. The list includes Fidelity Mutual, Vanguard, Northern Trust, Wellington Management, and Dimensional Fund Advisors. Several giant investment banks are among the top holders as well, including Blackrock, State Street, Bank of America, and Wells Fargo. These organizations mostly lowered their holdings. It isn't clear why the banks are dumping, but the largest and most knowledgeable investment funds seem to expect CVS to improve in the long term.
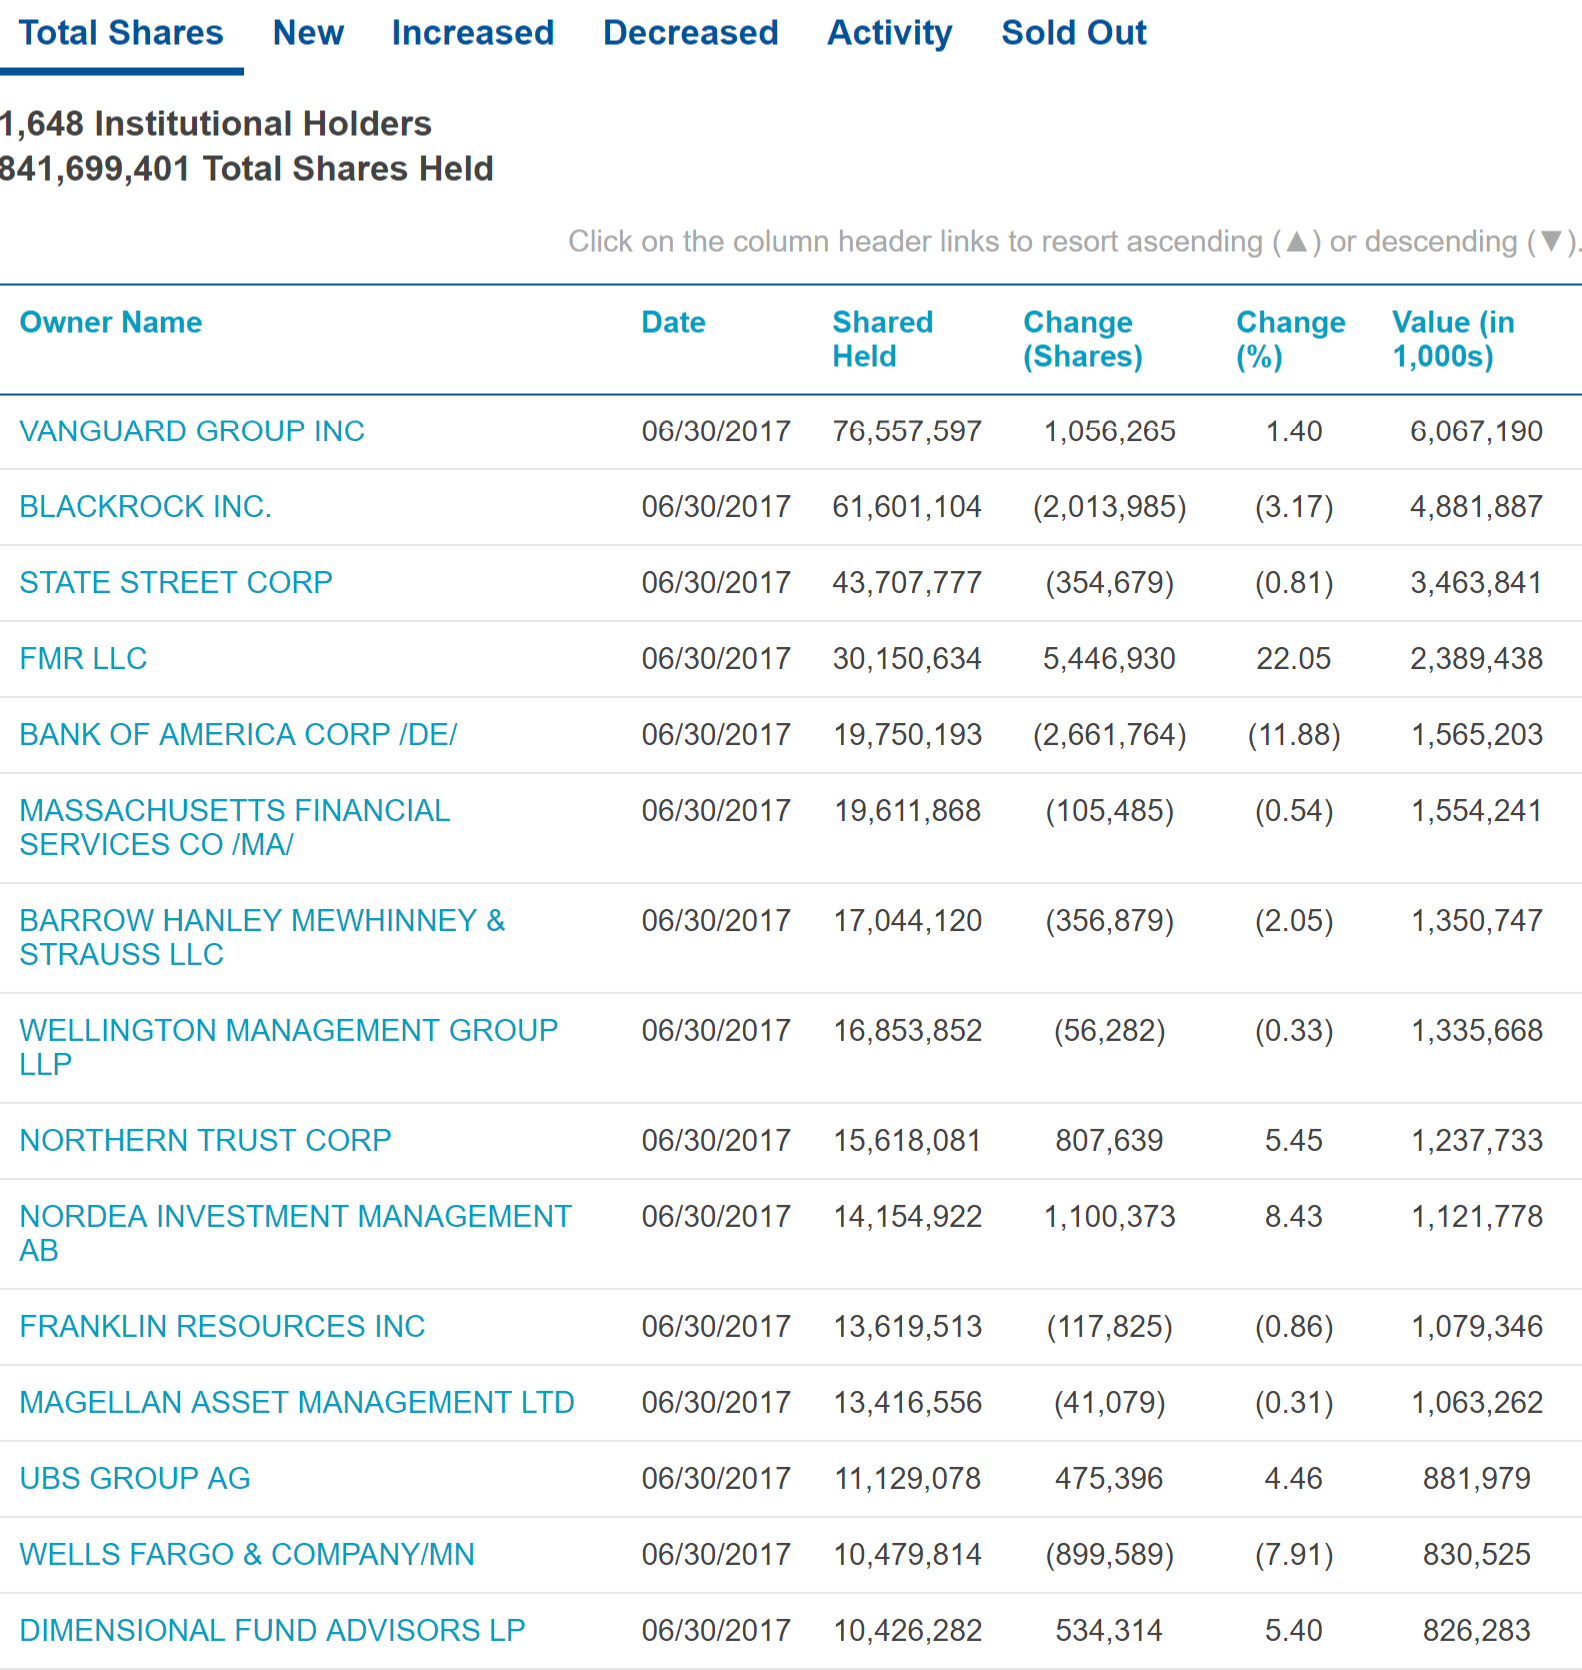 Figure 8: Top holders for CVS. Data provided by Nasdaq.com.
CVS Health's Guidance Shows Slow improvement
This analysis isn't complete though without considering CVS Health's guidance for the rest of the year. CVS expects revenues to climb 2.5%-4.25% in the Third quarter of 2017. Analysts expect revenues of $46.3 billion. So revenues should climb slightly next quarter, compared to last quarter and last year. Annual revenues are also expected to climb 3%-4% compared to 2016.
CVS narrowed its earnings guidance for next quarter and next year as well. Diluted earnings per share are expected to be in the range of $1.2-$1.23, which is a fair improvement over the second quarter. Diluted earnings per share for 2017 are expected in the range of $4.92-$5.02, which is a slight improvement over 2016.
CVS Health also pays out a nice dividend of $0.5. The company continues to repurchase its stock, which will lower the outstanding shares and make the stock more responsive to demand.
Conclusion
CVS Health's financials are slowly improving, but more revenue growth is needed to take this company out of its current bottom. Until then, it will probably remain stuck in its bottoming pattern. It doesn't look like CVS' bottoming attempt will fail, barring any big surprises from the company or sector. Investors considering CVS should wait for the stock's bottom to complete at about the $88 level before moving in though. This stock could be a used as dividend play as well, thanks to its generous dividend. So long term holders could also enter now, and continue to collect dividends while waiting for the stock to move out of its bottom. Either way, CVS is worth considering as a long-term investment candidate.