Dollar General (NYSE:DG) marked its 27th consecutive year of same-store sales growth in fiscal 2016. It followed this milestone up with a beat on both the top and bottom lines during its first quarter of 2017, with comps once again growing - but by only about 0.7%. As I was sifting through the retail carnage, Dollar General was one of the companies that stood out as above average, so I decided to take a closer look with this article.
The business
The company's primary niche seems to come from its low cost operating structure. The majority of its stores are rural, with roughly 70% of them located in towns of 20,000 people or less. It constantly seeks ways to reduce (or at least control) costs that won't affect the shopping experience for its customers, many of whom are primarily in a lower income bracket. This is exhibited by its low prices, where 80% of its stock-keeping units are set at $5 or less.
 Source: 2016 10-K
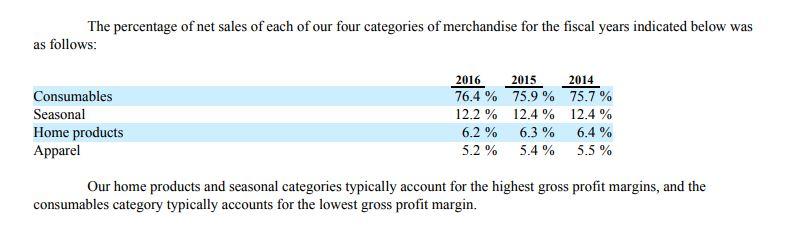
We can see from the above breakout of revenues that the firm is pushing further into the lower margin consumables business. It appears that the company is planning to sustain overall margins, however, by improving things like inventory and distribution efficiencies, private brand penetration, and through its zero-based budgeting initiatives. It's operating in a very cutthroat industry, so efficiency and cost control will always be key.
How margins and efficiency impact return on equity
I created the below DuPont analysis (and all other charts and models for the remainder of the article) using data from the firm's 10-K to analyze what's been driving it recently.
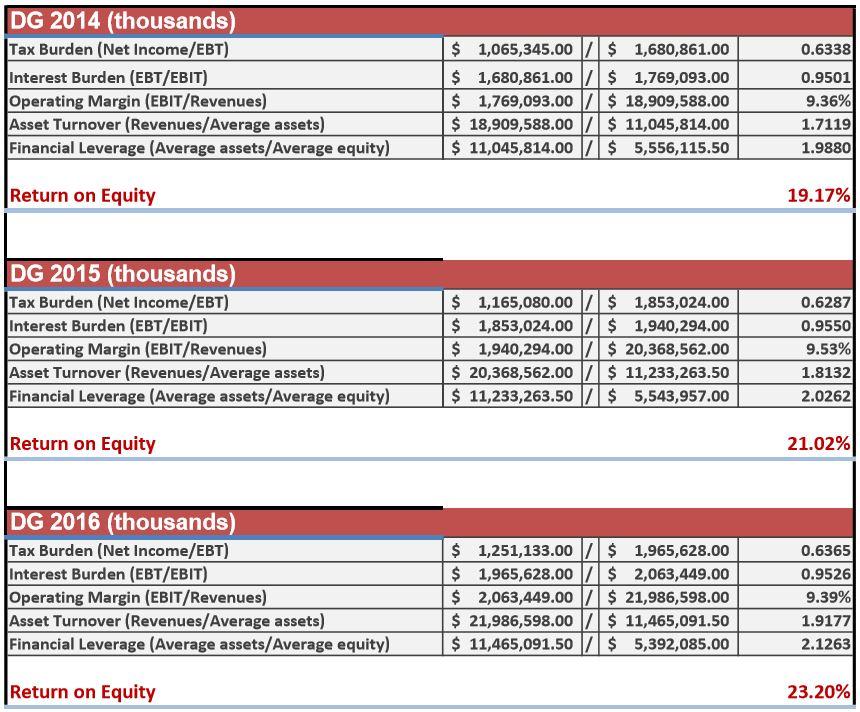
Looking at Dollar General's increasing asset turnover, I'd say it's been following through on its promises of efficiency. The improved asset turnover, coupled with moderate increases in leverage, have driven ROE higher - despite stalling margins. Further increases in efficiency alone could drive ROE higher, or at least help offset margins if they shrink or remain flat.
Judging by its ROE, Dollar General appears to offer more-than-acceptable returns on its equity capital, but how good of a capital allocator is it when looking at the entire capital structure?
Return on invested capital also looks attractive
Taking the whole capital structure into account, I created the below model.
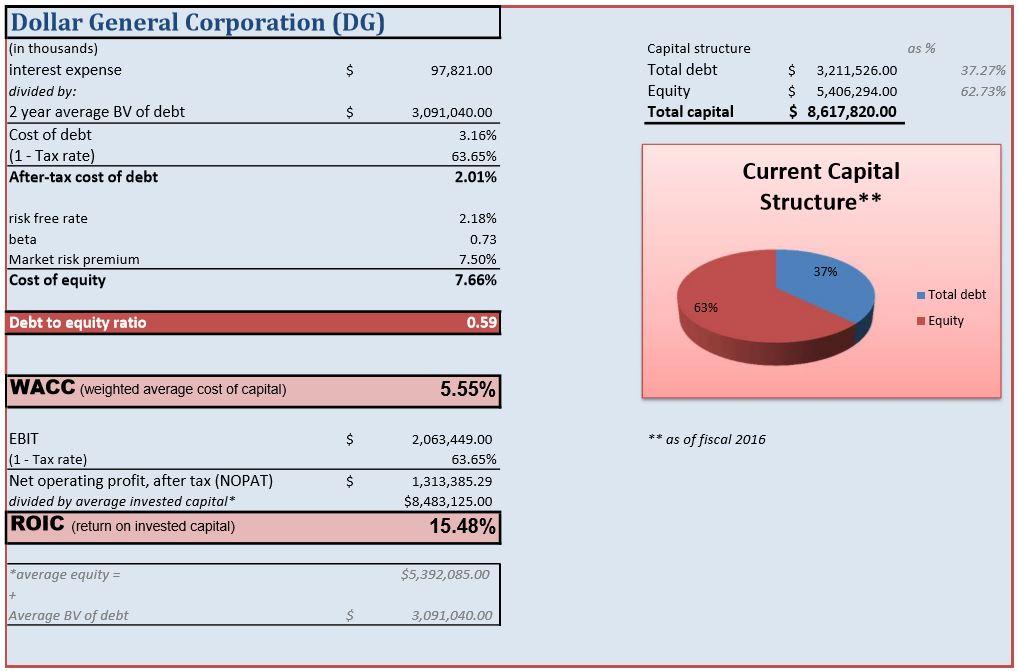
The company appears to earn economic profits, initially leading me to believe that it's got some kind of moat around its business. Because of the fickle nature of calculating a true cost of equity, I also created the accompanying chart below. It shows a different range of costs for equity, along with their impact on the overall weighted average cost of capital, or WACC.
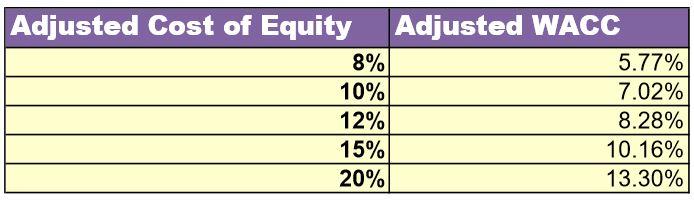 Even in the most extreme scenario, there appears to be the potential for economic profits, where the firm earns a return on invested capital that exceeds its overall cost of capital - not an easy feat, especially as a low cost retailer. Still, there are some more adjustments I'd like to make which I think will help paint a better picture of economic reality.
Operating leases: Off the books, but still there...
Like most retailers, Dollar General utilizes a large amount of off-balance sheet financing in the form of long-term operating leases. I decided to theoretically capitalize them in order to grasp their impact on not only the balance sheet, but ROIC as well.
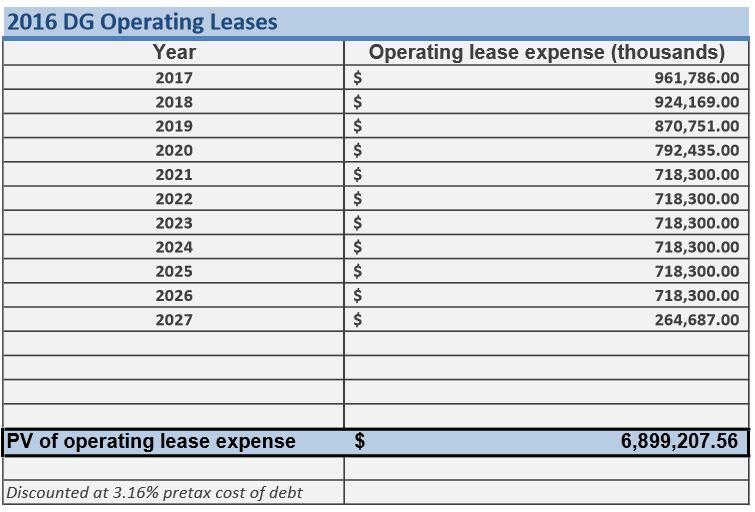
Discounting the operating leases at the firm's pretax cost of debt gives us an estimate of their present value, which can then be inserted into the overall capital structure.
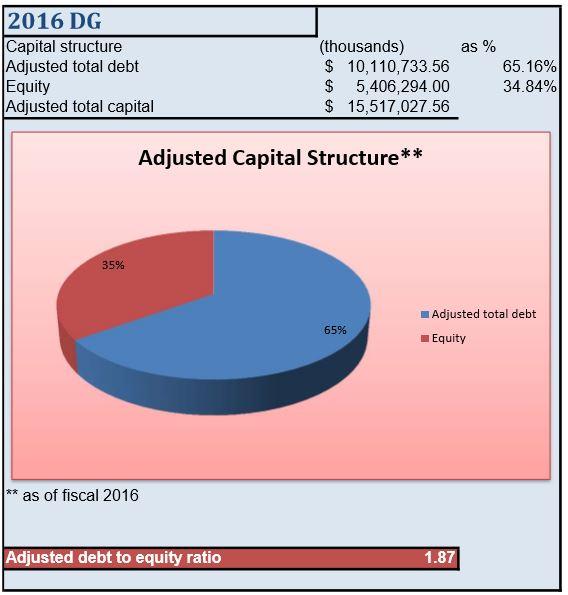 Adding the off-balance sheet leases to its debt and capital leases increases the firm's debt-to-equity from 0.59x to way over 1x. This is the denominator of our adjusted ROIC equation. To estimate the numerator, we now need to adjust operating profit while accounting for the leases - as well as their related interest expense and depreciation.
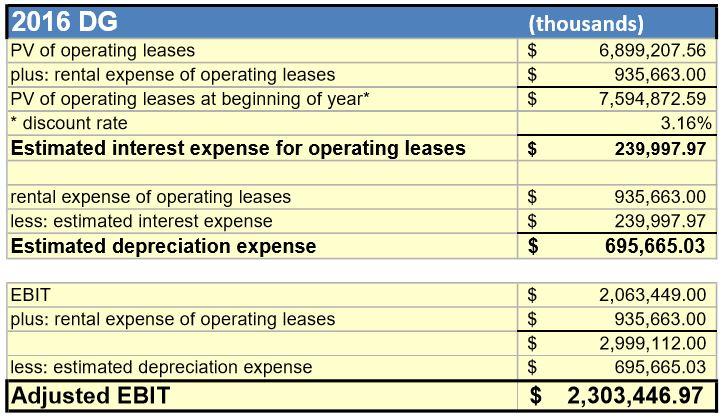
Accounting for the leases increases operating profit, which we will then divide by the expanded capital base - after accounting for taxes, of course.
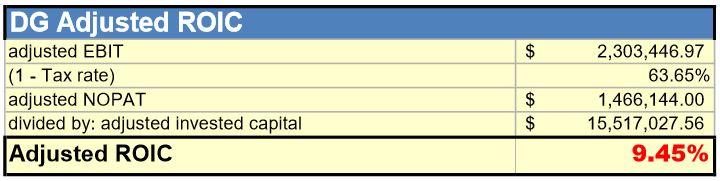
Dollar General's ROIC dives down to 9.45% when taking its operating leases into account, but due to the increased usage of debt in its capital structure, so does its WACC.
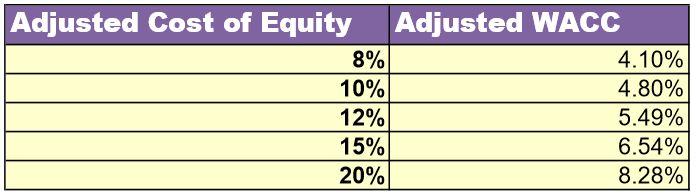
Even with a very high cost of equity in the 15% range, it appears that Dollar General likely earns economic profits. I think its low-cost operating structure, low prices, and primarily rural concentration likely gives it a competitive advantage that allows it to sustainably earn these excess profits.
Conclusion
Dollar General appears to have a niche that allows it to earn attractive returns on its capital, which flows through to the shareholder as attractive returns on its equity. Can the firm continue to sustain ROE above 20% and perhaps even continue to increase it? I think this all depends on the sustainability of its margins, and it appears management is focused on maintaining them through efficiency and cost control. The company's sequentially improving asset turnover indicates that efficiencies are paying off, and this alone could drive ROE higher (or at least sustain it if margins slip a little).
One of the things that concerns me is the slowdown in same store sales growth, which slipped to just 0.9% for fiscal 2016, versus 2.8% or higher for the preceding five years. I think this is something to watch, along with management's effectiveness of sustaining margins and reducing costs. At a tick under 17 times this year's estimated earnings and roughly 15 times 2018's expected earnings, shares look fairly valued (or perhaps slightly undervalued) when stacking them up against the five year average multiple, as well as the median over the last thirteen years. The decelerating comps are a notable thorn in the company's side, however, which makes me hesitant to jump in here.
If you enjoyed this article and would like to receive further updates and articles in the future, please feel free to hit the "Follow" button at the top of the page by the author's name.