Retail Trade Data
The one metric I especially like to keep track of for Dick's Sporting Goods (NYSE:DKS) is the retail trade data for Sporting Goods, Hobby and Book and Music Stores.
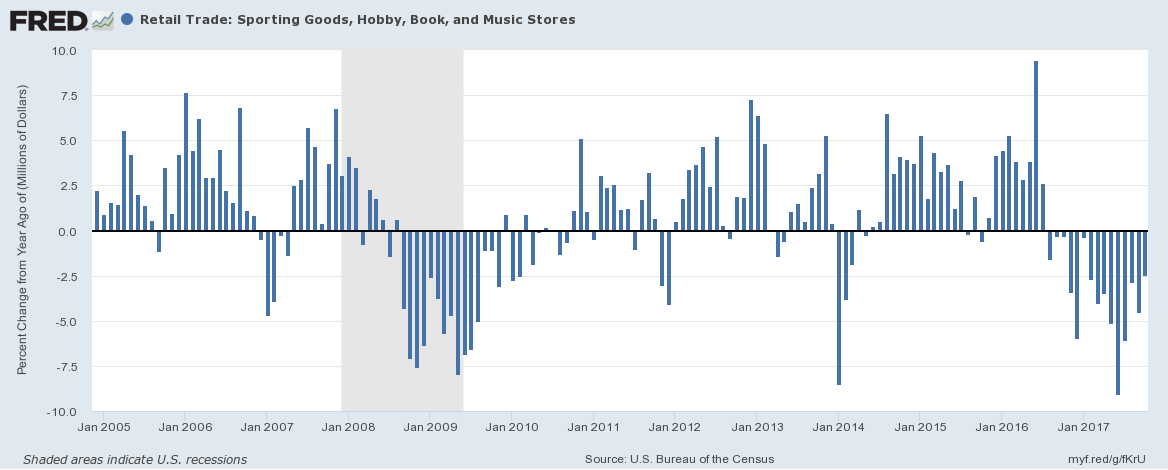 For the past 15 months now, retail trade data for this sector has been negative year over year. For the most recent month, October, the declines were 2.46% year over year and were down 4.5% for the 3rd quarter. The good news is that is the lowest year over year monthly decline in 10 months.
Dick's saw their consolidated sales rise 7.6%. Same store sales, which includes both in-store and online sales, were down 0.9%.
The entire increase in consolidated sales has come from increased stores and an overall increase in sq. ft. selling space.
Total stores at the end of Q3 2017 were 852 vs. 782 at the end of Q3 2016 which is about a 9% increase in total stores year over year.
The total sq. ft. selling space has increased from 38.8 million sq. ft. to 41.9 million sq. ft. from Q3 of 2016 to Q3 of 2017. That is an increase of about 8%.
The sporting goods sector has seen a whole slew of bankruptcies in the previous years including Sports Authority, Eastern Outfitters, Sports Chalet and MC Sports as most notable.
In this environment of very poor aggregate sector retail trade data for this sector, Dick's is holding up very well in my judgement.
eCommerce Success At Dick's
One of the key reasons given for some of the carnage in the sporting goods sector has been the increase in eCommerce as means for customers to purchase goods.
The CEO of MC Sports, Bruce Ullery, specifically noted (source found in linked article above) in a bankruptcy court filing:
"The rapid migration of sales from traditional brick-and-mortar retailers to online resellers," competing distributors, specialty retailers and "changing consumer preferences" contributed to the company's demise.
With that said, Dick's has been managing to successfully grow their sales through that avenue.
eCommerce sales at Dick's for their 3rd quarter grew 16% year over year. Online sales made up 10.3% of total sales for Dick's. This is compared to 9.6% in the 3rd quarter of 2016.
Gross Margins Hit
One of the most notable parts of the 3rd Quarter earnings report has been the hit to gross margins.
As was stated in the conference call:
Gross profit for the third quarter was $534.1 million or 27.47% of sales and that was down 307 basis points versus last year. This decline was driven by lower merchandise margins in a promotional marketplace that were in line with our previous forecast.
Overall net income as percent of sales for Q3 of 2017 was 1.90% Vs. 2.70% in the year ago 3 month period. The overall decline in net profit margins was only 0.9% which was a result of better leveraged SG&A expenses.
Management expects that for the 4th quarter of 2017 as well as the entire fiscal year of 2018, for margins to remain under pressure and consolidated same store sales to be flat to negative. Net income per share for 2018 is expected to be down 20% year over year as well per the recent 3rd quarter conference call.
These results and metrics give reason for why Dick's is trading down where it is today.
Here is a chart from YCharts with some historical context to both the share price and gross margins. They do seem to have some correlation.
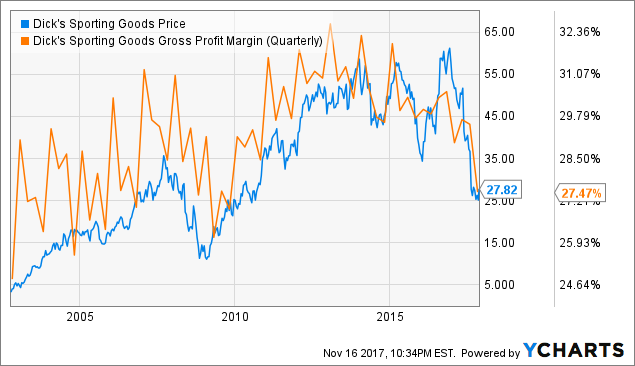 DKS data by YCharts
Investment Value
Per the balance sheet of Dick's as of the end of Q3 2017, I'd like to discuss the following:
Additional Paid In Capital: This is the amount of money that investors have put up and invested in the company. This also includes stock option based compensation.
As of October 28th, 2017, additional paid in capital was $1.166 billion.
Retained Earnings: Retained earnings is how much money the company has retained from profits. This includes money that was used to purchase shares and put those share back into treasury stock. However it does not include money that was given back to investors via dividends.
As of October 28th, 2017, retained earnings were $2.106 billion.
Treasury Stock At Cost: This is the total amount of money that has been spent to repurchase shares from the open market and retire them into treasury stock.
As of October 28th, 2017, Treasury stock at cost was $1.4 billion.
Shareholders Equity: This is the end result of the accounting figures that go into adding up the net worth of the company. It's the same as the total assets - total liabilities. Another way of looking at it is by taking the additional paid in capital and adding the retained earnings and subtracting the amount used to purchase shares.
$1.166 billion additional paid in capital
+ $2.106 billion retained earnings
= $3.266 billion
- $1.400 billion treasury stock
= $1.866 billion. (approx.)
As of October 28th, 2017, the official shareholders equity number is $1,872,986,000.
This can also be looked at as a figure that represents the liquidation value of the company if it were to decide to close up, liquidate and give the proceeds back to investors.
Dick's has been continually using proceeds from their cashflows to repurchase shares.
As of the end of the 3rd quarter, they have reduced the number of shares outstanding to 104.4 million.
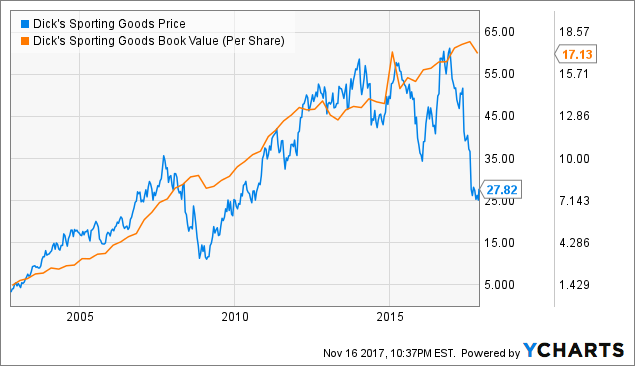
By taking the shareholders equity and dividing it by the number of shares outstanding, we can get the equity per share or book value per share, which comes to $17.94.
The current share price is 27.94 as I write this now.
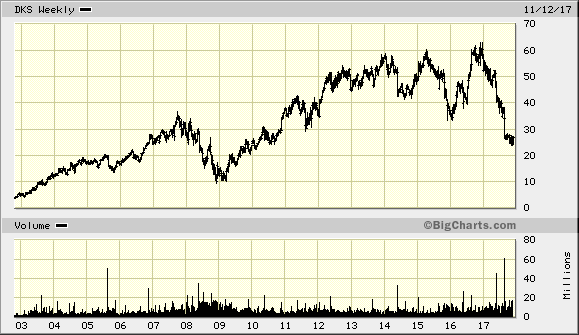
Here is a long term chart of Dick's share price. Back in early 2009, during a recession and huge market sell-off, shares traded around $10.
As of January 30th, 2009, Dick's had a shareholders equity of $893.577 million and 111,662,000 shares outstanding. This made the book value at that time, $8.00 per share.
In the depths of the great recession, Dick's never sold below its book value per share. It bottomed, fairly briefly, at about 125% of book value per share.
The book value very likely provided a great deal of margin of safely and provided a tremendous level of support.
With the current book value at $17.94 per share, at 125%, the price becomes 22.43 per share as an equivalent bottom out price.
The low for this past year was 23.88 earlier this month. Perhaps that could well have been the bottom.
Here is another chart from YCharts showing the correlation between the book value per share and the share price for historical context.
 DKS data by YCharts
Risks going forward include a US recession that puts even more pressure on aggregate industry sales and or further than anticipated margin declines.
In the event we see better than expected sales in the months ahead, then a valuation of 2x book value, close to $36 per share, becomes likely in my judgement in 2018.