Overview
This week is filled with important housing and real estate related economic data points including New Home Sales (Yesterday), Home Prices (Today), and Pending Home Sales (Tomorrow).
I published a [Daily Data Flash] on New Home Sales yesterday to members of EPB Macro Research. Click here for access to that report.
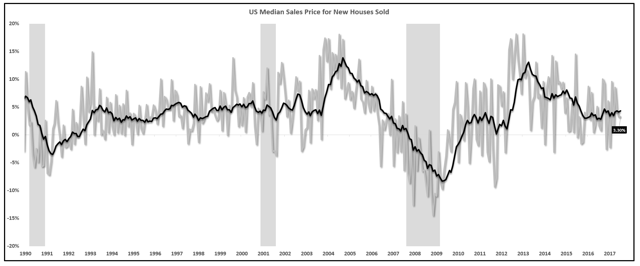
The report on New Home Sales was strong showing an increase of over 19% compared to last year. Also, the growth rate in the Median price of New Home Sales has stabilized at 3.30% year over year. The growth rate in the median sales price of new homes was trending lower at a fairly sharp pace for the better part of two years. The recent handful of months has stopped that decline for the time being.
New Home Sales Year over Year Growth & Median Price Year over Year Growth:
The S&P CoreLogic Case-Shiller Home Price Indices, released today, are the leading measures of U.S. residential real estate prices, tracking changes in the value of residential real estate both nationally as well as in 20 metropolitan regions. This report covers the price trends in homes that are not newly built but rather existing. The Case-Shiller report is the most popular report on the price of existing homes.
Case-Shiller Home Price Index
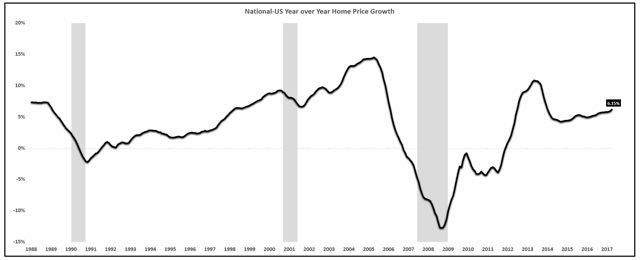
The National price index rose 6.15% vs. last year. This is faster growth than 5.95% last month and 5.15% last year.
National Home Price Index Year over Year Growth: Source: S&P, Dow Jones
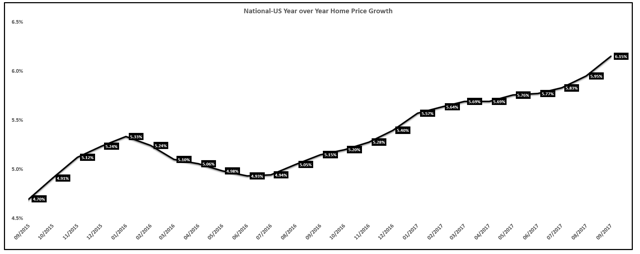
The chart below shows a shorter time horizon of the national home price index which clearly shows a housing market in which prices are continuing to accelerate.
National Home Price Growth:
Source: S&P, Dow Jones
More importantly, home prices are increasing at an accelerating pace. This 'rate of change' shows that


