Introduction
TriMas Corporation (NASDAQ:NASDAQ:TRS) is a diversified American industrial company. Its three core segments are Packaging, Aerospace, and Specialty Products.
TRS stock has performed well over the past year. As shown in the table below, the stock has risen +38.43% over the past twelve months. Short interest is currently low, based on Morningstar data, at just 1.19%.
In part, the company is benefiting from its exposure to the Oil & Gas industry, which is finally starting to recover after the crash which occurred in mid-2014 (with respect to oil prices).
 In this article, I will introduce and profile the company and also provide an indicative valuation.
TriMas's Earnings
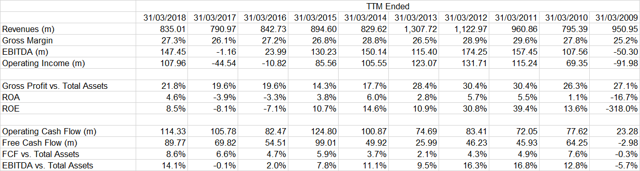
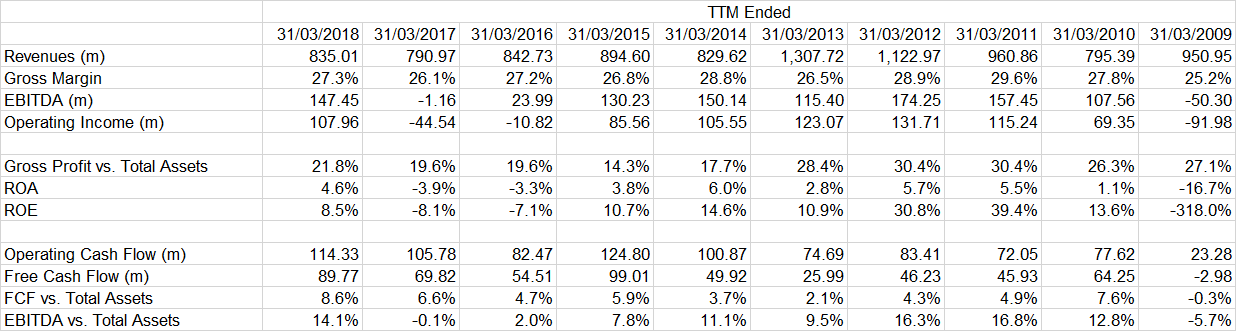
On a trailing twelve months (TTM) basis, the company generated $835.01m in revenue, with positive EBIT of $107.96m.
As you can see in the table below, revenues have grown at only a marginally positive rate over the past five years (0.16% per annum, compounded, vs. an average growth rate that is negative, of -7.02%).
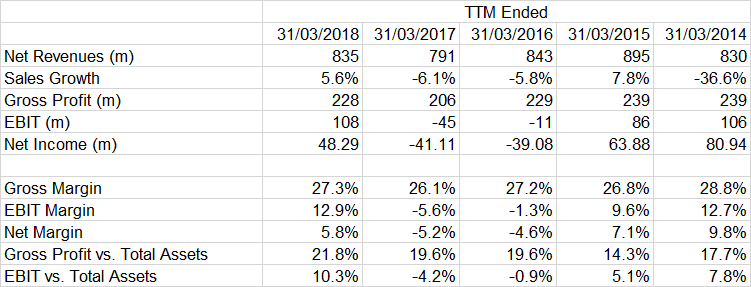
The top line has been volatile over this period, owing to a sudden decline in its Energy segment's fortunes following mid-2014, when global oil prices tanked. Recently, it has started to grow once again. The company's Engineered Components segment also took a hit.
Below you can find a table that looks at each of the company's segments for the past three full fiscal years.
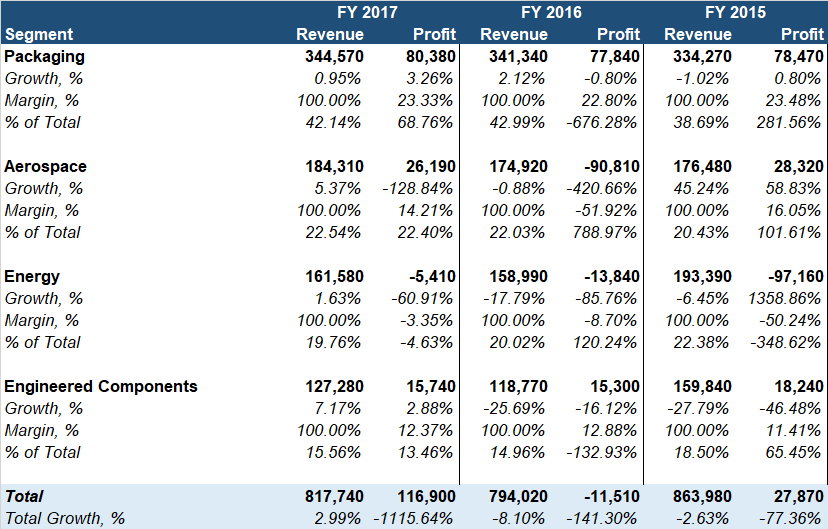 The bad news is that overall, the company's sales are both declining on average and trending downward over time. But the good news is that its businesses exposed to Oil & Gas are positioned to regain any lost momentum over the past few years (although they will probably not return to their full, original size by revenues, given that such businesses' platforms would have been scaled down to reduce losses).
The Packaging and Aerospace segments are largely mature and ticking along at modest rates of growth, and they will likely continue to do so over the long term, barring short-term variations in exchange rates and volumes/product mix, etc.
(The large boost in revenues in the Aerospace segment in FY 2015 was due to the November 2015 acquisition of Tolleson, an Arizona-based machine components facility acquired from Parker-Hannifin Corporation in addition to the acquisition of Allfast in October 2014. Otherwise, growth would have been less than 4%.)
Additionally, gross profits vs. total assets help to adjust for less meaningful fluctuations or trends in revenues. It is useful for “normalizing” any top-line changes. As the table above shows, the gross profit vs. total assets ratio has increased over time (currently 21.79%). Gross margins are meanwhile stable. Most of the benefit here has resulted from falling total assets rather than improved gross profits.
Indeed, gross profits have actually fallen over the five-year period by about -1% compounded. TriMas Corporation's gross margin was 27.28% in the past twelve months, versus an average of 27.23% in the past five years inclusive (very stable).
EBIT (Earnings Before Interest and Taxes), i.e. Operating Income, was +$107.96m in the past twelve months, which represents an EBIT margin of 12.93%. TriMas Corporation's EBIT margin plunged into negative territory following 2014, but has more recently recovered almost all of the ground lost after the oil price crash. This most recent margin of 12.93% compares to an average five-year margin of 5.66%, and a negative margin in the prior two comparable TTM periods.
The company's net income was $48.29m in the recent TTM period (a net margin of 5.78%). TriMas Corporation's net margin has trended downward over the past five years, just as gross profits have generally trended downward over the same period. However, as with its operating earnings, its net income margin recovered (somewhat) following a couple of years of negative margin.
It is not worth much time studying the company's operating leverage, but it is clearly volatile due to its exposure to Oil & Gas, through its Energy and Engineered Components segments which together represent over a third of total revenues. The upside of this is that revenues have the potential to surge after a recovery in Oil & Gas markets.
The table above also shows that Sales, General & Administrative (SG&A) expenses have generally remained stable relative to sales over the past five years. Relative to gross profits, SG&A expenses have been roughly stable also.
TriMas Corporation does not currently pay any dividends.
Quality of TriMas's Earnings and Cash Flow
In light of TriMas Corporation's falling net margin in recent years and its falling net income (on a nominal basis), its operating cash flows have conversely improved. Although somewhat volatile, they have managed to hold up over the years (even through the loss-making comparable TTM periods ending in March of 2017 and 2016).
In the most recent TTM period, operating cash flows were $114.33m (vs. net income of $48.29m). Over the past five years, operating cash flow has (in total) summed to $528 million, while net income has equated to $113 million. In other words, operating cash flows have been about 4.7x net income (over a 5-year-long period).
High quality businesses generate cash flows above net income over the long run; the opposite is the case for businesses with low-quality income. For TriMas, its operating cash flows look thankfully healthy/robust.
In the table below, you can see the long-term relationship yourself, between TriMas Corporation's operating cash flow and net income (which includes net income to non-controlling interests) over the long term.
 Over the past three years, net income has actually been negative, although it is now back in positive territory.
Free cash flow (FCF) can be simplistically calculated as operating cash flow minus net business capital expenditures. TriMas Corporation's five-year average FCF is $72.61m. Its FCF is generally improving over time. Over the past four consecutive years at least, free cash flows have exceeded net income.
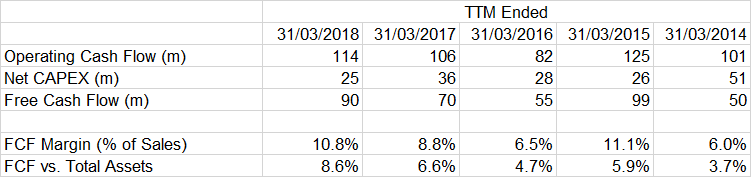 The table above also shows the company's FCF margins, which have improved relative to sales (TTM: 10.75%) and improved relative to total assets (TTM: 8.59%).
Finally, it is useful to examine a company's cash conversion cycle to assess the quality and sustainability of earnings and cash flow.
TriMas's Cash Conversion Cycle
Over the past TTM period, the full cash conversion cycle (CCC) has fallen from 112 days (in the prior TTM period) to 104 days (calculated for March 2018 as DSO of 54 + DIO of 95 - DPO of 45). Further, over the past five years (a longer time horizon), TriMas Corporation's CCC has fallen which is generally a positive sign - of either increased competitiveness or simply improved working capital management (or both).
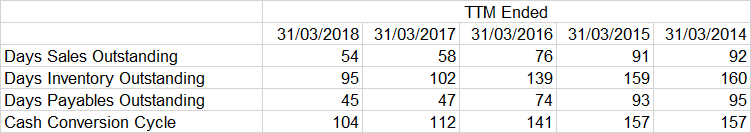 The current TTM period has been the most efficient period over the past five TTM periods in terms of the working capital cycle. Over the five-year period, days sales outstanding have generally fallen, days inventory outstanding have trended downward, and days payables outstanding have generally fallen.
There is nothing bad to report on here, as progress has clearly been made in relation to TriMas's operating assets composition and working capital management.
TriMas's Financial Health and Risk
TriMas Corporation overall looks like a healthy company. Although not perfect, the company's recent record is largely positive.
Firstly, its return on assets (ROA) is positive, which is good (note: ROA increased year over year). The company's gross margin increased, which is positive (27.3% vs. 26.1%).
Operating cash flow was positive in the trailing twelve months. Additionally, operating cash flow exceeded net income in the trailing twelve months (a good sign).
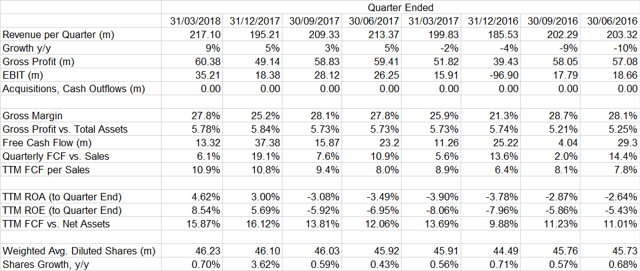
Further, leverage (debts) fell in the recent period (a positive sign). The company's current ratio increased, which could be interpreted positively. The company's shares increased (generally not a positive sign). And finally, the company's asset turnover ratio (sales vs. average total assets) increased in the recent period (a positive sign).
These factors are considered in Piotroski's F-score, a test for financial health. A score of 9 is perfect; 0 is the worst possible score. TriMas Corporation's F-score is 8, which is considered good. This has improved noticeably since the prior TTM period, in which the F-score for TriMas Corporation was 2. These quick improvements have helped to support investor optimism (as noted, the share price has increased by over 38% in the past year).
Further checks can be made to produce a reasonable estimation of the likelihood that a company is manipulating its earnings or financials (a probabilistic approach). Examples include examining the growth in non-operating and/or intangible assets, the growth in receivables relative to sales, changes in depreciation rates relative to property, plant & equipment (PPE), and more.
Fortunately, TriMas Corporation does not seem to be using aggressive accounting techniques. On the contrary, the company's (albeit newfound) earnings look healthier than average.
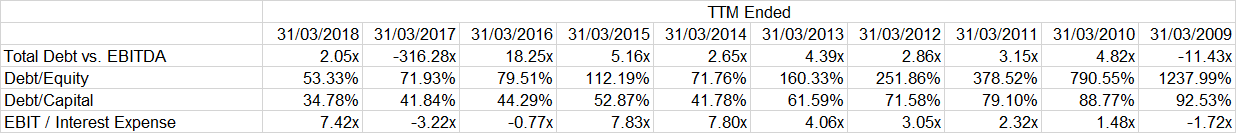
The company's debt-to-capital ratio is 34.78%, while EBIT-to-net-interest-expense ratio was 7.42x in the trailing twelve months. Although the company does have a moderate level of debt, its debts appear to be manageable, and thus there is a low risk of insolvency or financial troubles.
TriMas Balance Sheet Metrics
The funding of TriMas Corporation's assets is comprised of 46% of liabilities, and 54% of equity (total assets minus total liabilities). As noted, the company's debt/capital ratio is 34.78% (that is, financial debts vs. the sum of financial debts plus shareholders' equity).
The company is therefore using a considerable amount of leverage, though once again it is not unmanageable. As shown in the table below, the company has also reduced its leverage over recent years relative to EBITDA (ignoring the wild anomalies in 2016 and 2017, more recently).
 Goodwill and intangible assets represent 48.7% of TriMas Corporation's balance sheet. This is not too high, which is good.
Intangibles are not inherently bad, but they do introduce some risk and uncertainty in respect of the company's worth. These assets typically result from acquisitions and/or capitalized expenses, or investments in certain intangibles like intellectual property.
TriMas's Long-term Financial Trends
The table below provides an overview of TriMas Corporation's long-term financial performance.
 TriMas's Recent Financial Performance
For good measure, the table below shows TriMas Corporation's recent performance over the past eight quarters.
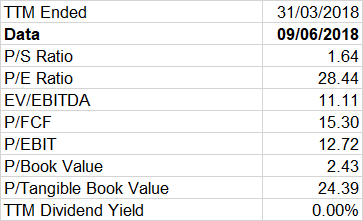
 EV/EBITDA Multiple

Using the EV/EBITDA valuation measure, the company's EV/EBITDA ratio as of June 08, 2018, is 11.1x. This would suggest the company is probably in the fair-value region (assuming no break-out to the upside or downside in terms of revenues and earnings). See the table below for further valuation measures.
DCF Valuation for TriMas Corporation
Using my quick valuation as a benchmark for value, we can now make some DCF assumptions for growth and margins. My assumption for TriMas Corporation's compound annual growth rate for the next five years is 4.00%, before gradually scaling to a long-term growth rate of 2.00% for steady-state growth (to perpetuity).
The medium-term growth rate is justified on the basis that its Packaging and Aerospace segments are largely mature, and together these segments represent about 65% of total revenues. The remaining segments, which are likely to pick up following tailwinds related to the recent Oil & Gas recovery, represent about 35% of revenues. Overall, I think medium-term growth (over the next few years) will therefore be, on balance, around 3-5% per annum (not including any future effects of currencies, acquisitions, etc.).
My second assumption is that the company's EBIT margin stays at 13.00% (it is currently 12.93%) over the next 10 years/to perpetuity. Note: in FY 2014, its EBIT margin was just under 10%, and 12% in FY 2013, therefore I am making a somewhat generous assumption.
I am also giving the company a base discount rate of 8.00%, and I am using the same rate for the terminal value in year 10.
All said, this provides us with an enterprise value of $1,215.35m. After adjusting for cash, debt, outstanding options, etc., we find an equity value of $946.36m (or $20.61 per share), which represents -31% downside from the current share price.
I don't think TRS stock is worth shorting. But I do think it is probably overvalued, or overestimated.
Moving Averages (MAs)
From a simple, technical perspective, stocks whose 20/200 MAs and 50/200 MAs are both above 1.00x, and whose 20/200 MAs exceeds their 50/200 MAs, are thought to be in upward trends. If a stock's 20/200 and 50/200 MAs are both negative and the most recent 20/200 MA is below the 50/200 MA, a stock is thought to be in a downward trend.
In respect of TriMas Corporation (TRS), its 20-day moving average vs. its 200-day moving average is 1.09, while the stock's 50-day moving average vs. its 200-day moving average is 1.05.
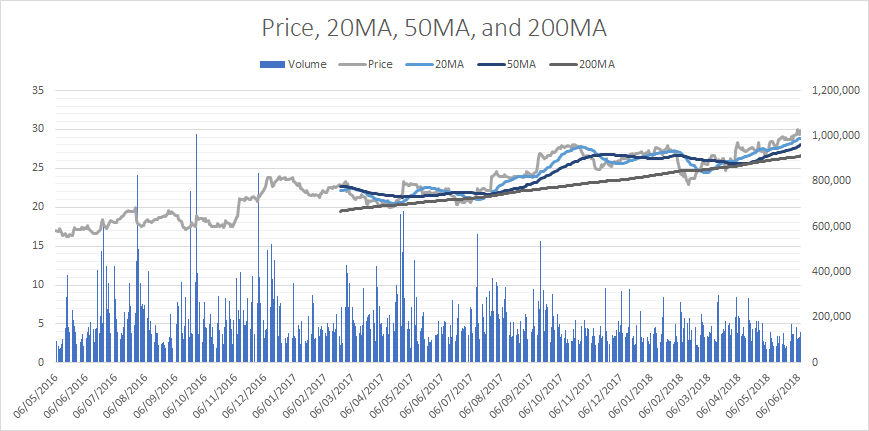 Currently, TRS stock appears to be in an upward trend. Overall, however, TRS stock might be due for a modest correction.