I started my previous career as an IT engineer with a first job consisting of making sure that an IP Telephony application would be compatible with most of the network topologies. In order to fulfill this mission, the company I worked for provided a lab with the most popular network and security equipment. This was my first experience with a real commercial firewall and it was a Check Point (NASDAQ:CHKP) device. That was 17 years ago.
Today, Check Point is still a leading IT security company. However, it is losing market shares to aggressive competitors such as Palo Alto (PANW) and Fortinet (FTNT).
The share price evolution shows that the market acknowledges these difficulties.
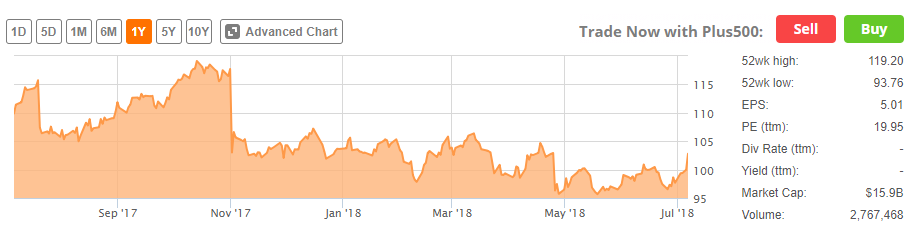
Source: SEEKING ALPHA
Checking Check Point
Check Point, based in Israel, was founded in 1993 by Gil Shwed, the current CEO, who owns 19% of the company.
Like competitors, Check Point proposes cloud and network security solutions with an emphasis on the integrated and automated functionalities. The company sells products (hardware and licences) and services (subscriptions and maintenance), as shown on the table below.
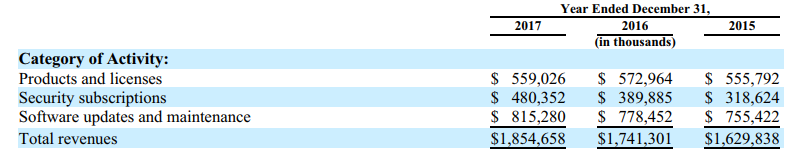
Source: Annual report 2017
In an 8% CAGR security market, where Palo Alto and Fortinet have been growing revenues, respectively, at 47% and 25% CAGR over the last few years, Check Point has been growing revenues at less than 7%, as shown on the table below.
| 2017 | 2016 | 2015 | 2014 | |
| Revenues | $1,854B | $1,740B | $1,629B | $1,495B |
| Growth | 6.57% | 6.78% | 8.96% | 7.30% |
Source: Author, based on annual reports.
Obviously, despite growing revenues, Check Point has slowly been losing market share.
However, the company has shown impressive margins. For instance, net margins consistently stay in the range of 40-45%. Revenues and net income have been slowly and steadily growing while shares outstanding has been diminishing. As a consequence, EPS has been steadily progressing. The table below shows the corresponding data from the income statement.
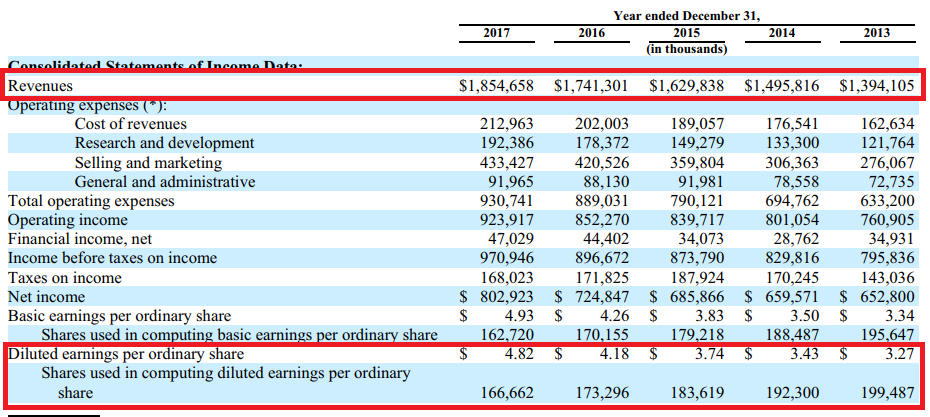
Source: Annual report 2017
The diminution of the number of shares by 16% between 2013 and 2017 is related to the limited share-based compensation (SBC) and the regular buyback of shares with the cash that the company generates.
Compared to other security vendors, SBC is very limited with less than 5% of the revenues, as shown on the table below.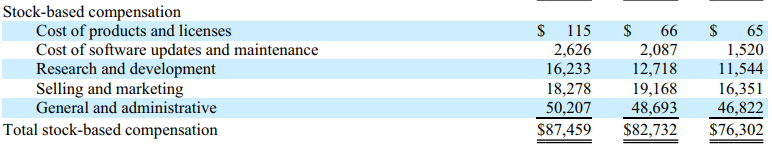
Source: Annual report 2017
The extract of the cash flow statement below highlights the buyback activities of the company, with roughly $1B per year.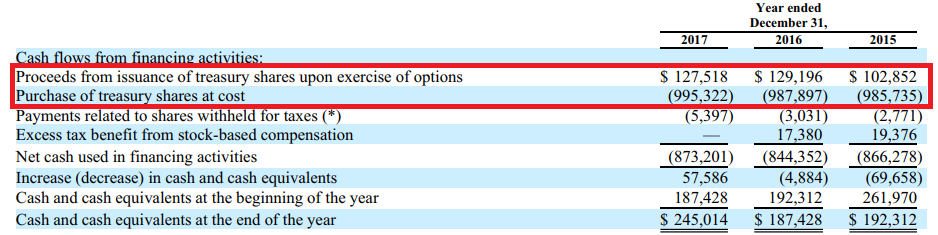
Source: Annual report 2017
The balance sheet below is clean with no debt and $4B of cash. Deferred revenues constitute an important part of liabilities. The goodwill represents 15% of the assets, which is reasonable.
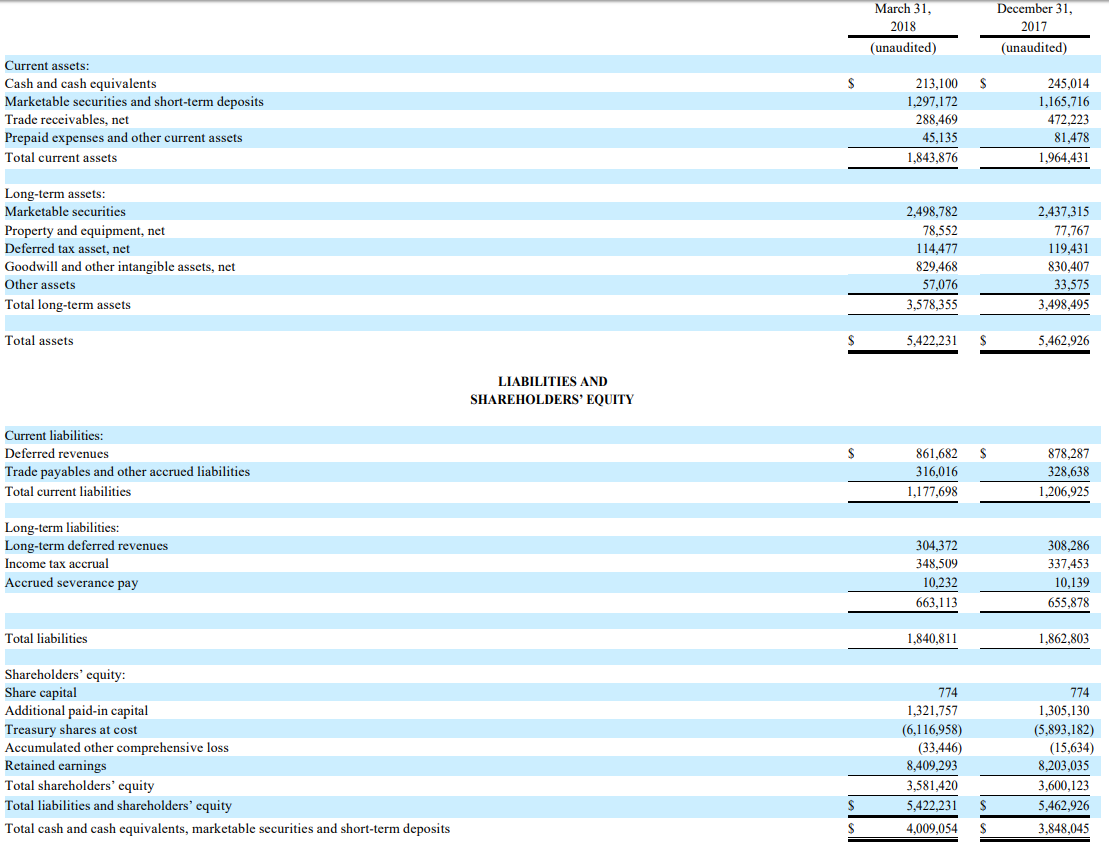
Source: Q1 2018
So, what's wrong?
The market does not like the fact that the company is losing market share to competitors who spend much more money - in absolute and relative terms - on marketing and sales.
The table below shows the proportion of expenses for Check Point.
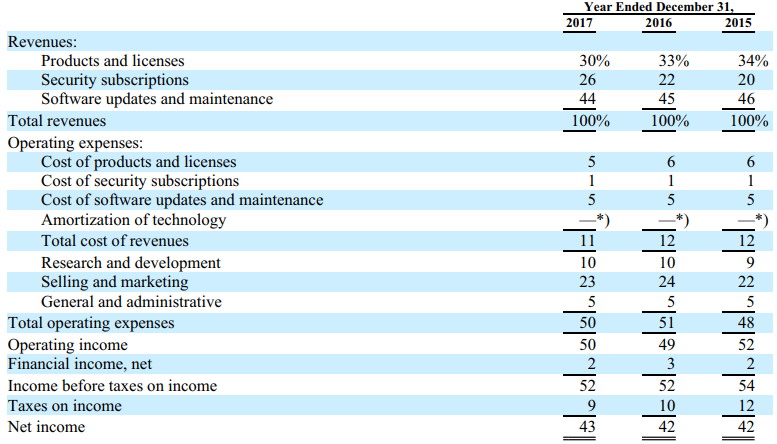
Source: Annual report 2017
With 23% of revenues, the company's sales and marketing expenses look poor compared to Palo Alto and Fortinet with about 50% and 45% of revenues, respectively.
As a side note, research and development expenses represent 10% of revenues against 20% and 14% for Palo Alto and Fortinet, respectively. Due to its location in Israel, Check Point is benefiting from lower R&D costs. The table below compares the R&D resources between Check Point and Palo Alto.
| End year 2017 | Checkpoint | Palo Alto |
| Total employees | 4576 | 4562 |
| Employees R&D | 1396 | 766 |
| R&D employees / Total employees | 30.5% | 16.8% |
| Cost R&D | $192.4M | $347.4M |
| Cost R&D / employee | $137.8k | $453.5k |
Source: Author, based on annual reports
By all measures, R&D expenses are lower for Check Point, with almost twice as many employees as Palo Alto. In my opinion, this constitutes a huge advantage.
Sales and marketing being more global, Check Point does not profit from the same R&D cost edge. The table below compares the sales and marketing expenses of security companies against their respective revenue growth over the last few years.
| Comnpany | Sales and marketing (% of revenues) | Revenues growth % |
| Palo Alto | About 53% | About 47% |
| Fortinet | About 50% | About 27% |
| Checkpoint | About 23% | About 7% |
Source: Author, based on annual reports
It seems that, by raising sales and marketing to 30% of revenues, Check Point could easily match the 8% market growth.
The management and has been discussing the issue during previous conference calls. The CEO has indicated that the company had been raising and reorganizing sales and marketing resources.
We have elevated the level of our marketing activities and will continue to do so. Yet this task of changing the behavior of our productive sales force takes time. We're asking them to learn new sales techniques, reach much higher in the organization and learn new tactics in approaching new customers and opportunities. At the same time, we continue to hire new salespeople to augment our coverage where needed.
- Gil Shwed, CEO
Source: conference call Q1 2018
As a result, sales and marketing expenses represented 26.5% of revenues in Q1 2018 against 23% in 2017.
Answering to an analyst about sales and marketing expenses for the next few years, the CEO mentioned a controlled increase in spending.
I think we will increase slightly the sales and marketing spend. But I think overall the issue is not just increasing the spend, the issue is doing it smartly. So now this year, yes, we're doing two, three times more marketing activities. And when I'm talking about increasing marketing activities, it's really, really high percentages. You can see the impact on the financial is hard to spot. Can we do more? Yes. Will we do more? Probably yes. But if we will do more, I also expect revenues to come in return to that.
- Gil Shwed, CEO
Source: conference call Q1 2018, Q&A session
Valuation
Considering the discussion above, I assume that sales and marketing expenses at 30% of revenues will generate 8% revenue growth, corresponding to the market growth.
With the regularity of the company, I suppose that everything else stays stable; therefore, I assume that the net margin dropped by 7% to 36% due to the 7% increase of marketing and sales expenses. In order to be conservative, I ignore the small positive tax impact.
In addition, with the guidance from the management, I consider $1.9B of sales for 2018.
Full-year revenues are expected to be between $1.85 billion, and $1.93 billion. Non-GAAP EPS in the range of $5.45 to $5.75. GAAP EPS is expected to be approximately $0.62 lower.
- Gil Shwed, CEO
Source: conference call Q1 2018
With a share price of $102.81 and 161,711,000 fully diluted shares, the market cap amounts to $16.62B. Adding the net cash of $4B gives an EV of $12.62B.
EV/Sales = $12.62B / $1.9B = 6.6
PER (ex cash) = ($16.62B - $4B) / ($1.9B * 36%) = 18.5
Due to the growth of deferred revenues, free cash flow is slightly higher than net income, allowing close to $0.9B of annual return to shareholders via net share buyback.
The market seems to fairly value the company, taking into account its modest growth, its stability, and its management aligned with shareholders. I would consider buying some shares at a PER below 12, corresponding to a market capitalization of $12.2B and a share price of $75.
Conclusion
Despite growing, Check Point has been losing market share during the last couple of years. The company did not keep up with aggressive sales and marketing strategies from competitors like Palo Alto and Fortinet.
The management is taking measures to overcome these issues.
The market seems to fairly value Check Point. Considering the quality of the company, I would be happy to buy shares should the price drop below $75.