Here Are Key Housing Market Data
On July 17, the National Association of Home Builders announced that its Housing Market Index for July held steady at 68, still well above the neutral reading of 50, but the buyer traffic rose 2 points to a still anemic reading of 52. Homebuilders continue to tout strong demand for homes on steady job growth and income gains, but the NAHB is concerned about higher lumber prices.
On July 18, the Census Bureau reported that single-family housing starts fell by 9.1% in June to 858,000 units versus the non-revised level of 936,000 in May. This questions the sustainability of the housing market index. Of concern is that single-family permits were at the lowest level of 2018. Homebuilders were buoyed by the fact that single-family starts are up 7.8% year over year. Keep in mind that the January 2006 peak was above was above two million single-family units.
Monthly Graph of the NAHB HMI Vs. Single-Family Housing Starts
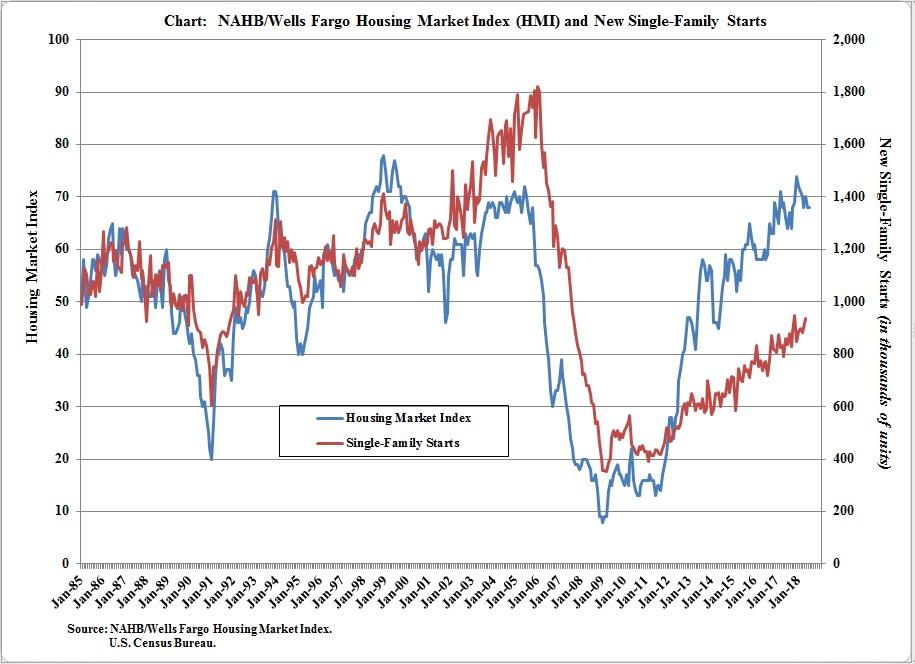
Courtesy of the National Association of Home Builders
The NAHB HMI at 68 in July is shown in blue with the scale at the left side of the graph. Single-family housing starts are shown in red with the scale on the right side of the graph. This reading is the original one for May.
Note that the HMI continues to lead the rise in starts by a significant margin which remains a warning. When the index was 72 in June 2005, single-family starts were approaching 1.8 million units, now struggling at half that pace.
New Home Sales
On July 25, the Census Bureau reported that new single-family home sales fell by 5.3% in June to an annual rate of 631,000 units, The NAHB is becoming concerned that tariffs on lumber and potential trade wars are keeping some potential home buyers on the sidelines. In July 2005, this measure was approximately 1.3 million units, so current sales remain well below potential.
Home Prices Are Too High
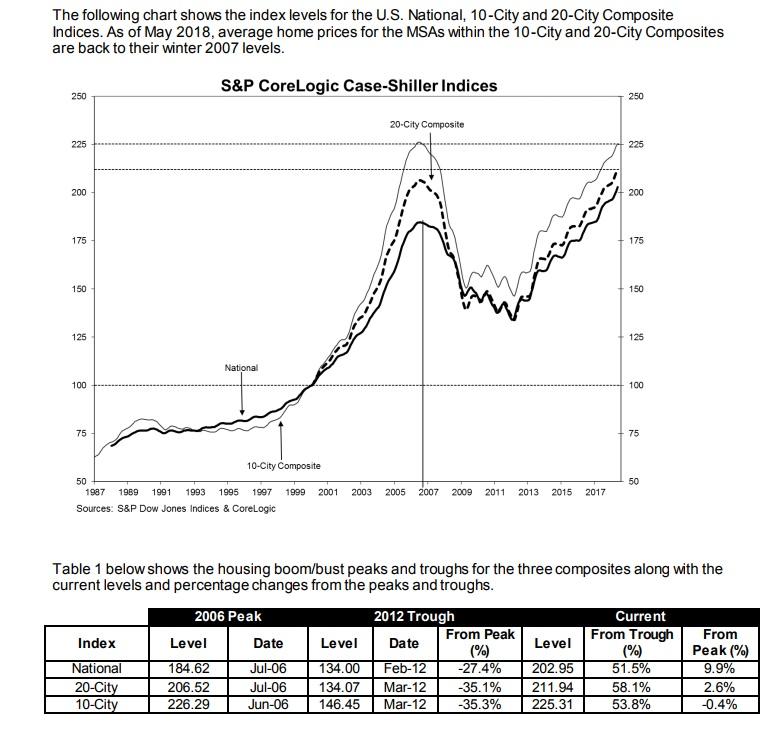
On June 31, we learned that the S&P/Case-Shiller Home Price Indices continued to rise in May. The benchmark 20-City Composite was up 6.7% year over year to a new all-time high.
To review, the 20-city composite peaked in July 2006. The price-bubble popped, and home prices fell by 35.1% to a trough set in March 2012. Since then, the composite is up 58.1% and is 2.6% above the prior peak. This is a "re-inflated bubble".
Other Housing Bullet Points
- Sales of existing single-family homes peaked in November and have declined three months in a row.
- Sales of new homes are down, and housing starts are at best flat.
- Home affordability has worsened over the last 18 months as rising home prices and higher mortgage rates are a double-edged sword.
- On Aug. 9, we learned that the NAHB is concerned about housing affordability citing that it's at a 10-year low. It reports that national median home price increased to $265,000 in the second quarter, up from $252,000 in the first quarter, the highest price in history. At the same time, the average 30-year mortgage rate rose to 4.67% from 4.34%.
Here's A Scorecard for Five Major Homebuilders
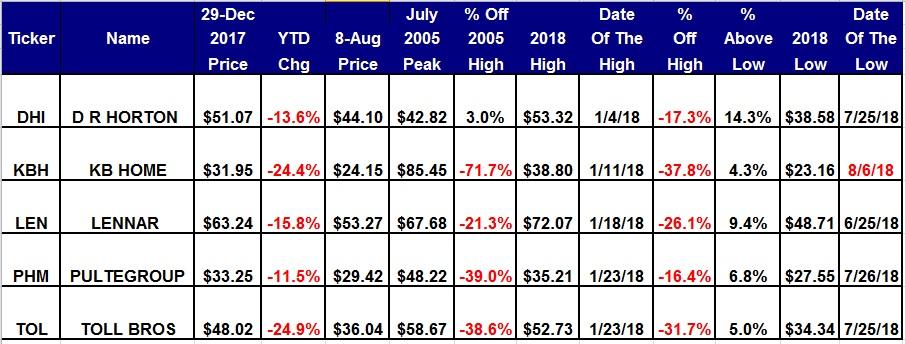
Let's look at the weekly charts and key trading levels.
D. R. Horton (NYSE:DHI)
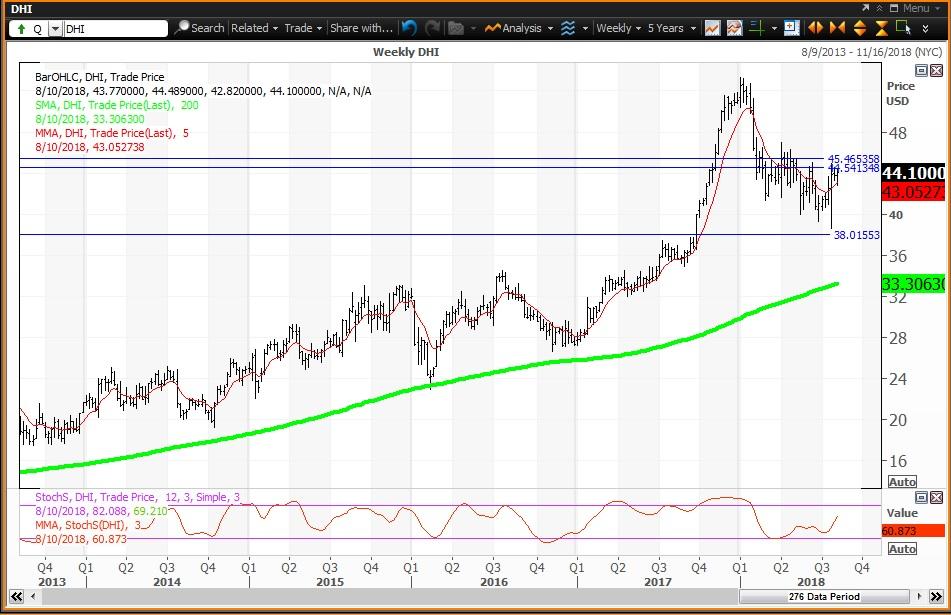
Courtesy of MetaStock Xenith
The weekly chart for D. R. Horton is positive with the stock above its five-week modified moving average of $43.24 and well above its 200-week simple moving average of $33.31, which is also the "reversion to the mean" last tested during the week of Feb. 12, 2016, when the average was $23.31. The 12x3x3 weekly slow stochastic reading is projected to end this week at 62.16, up from 50.27 on Aug. 3. The stock is among my quarterly, semiannual and annual pivots of $44.58, $44.56 and $45.45, respectively.
Trading Strategy: Buy weakness to my monthly value level of $38.02. If you bought recent weakness, reduce holdings on strength to my annual pivot of $45.45.
KB Home (NYSE:KBH)
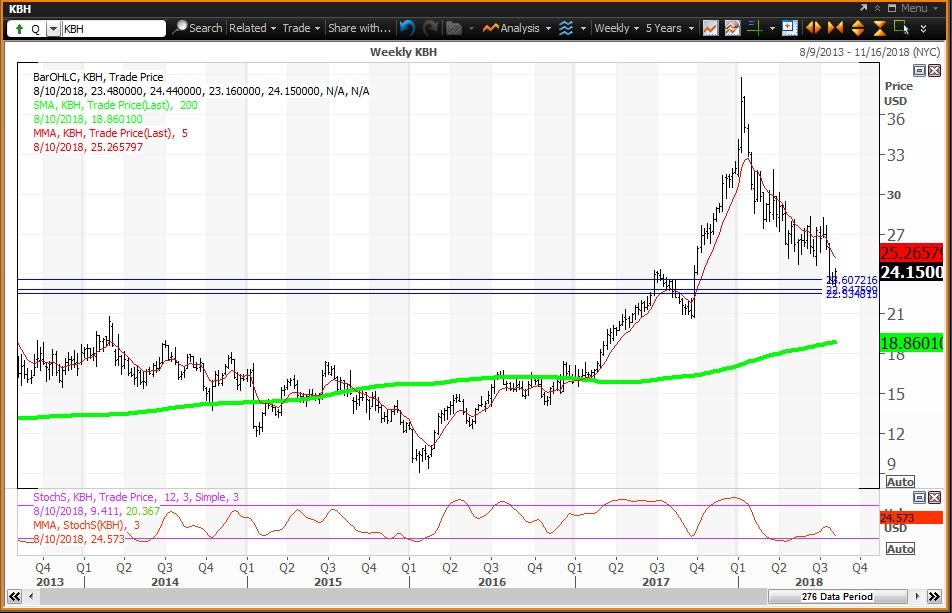
Courtesy of MetaStock Xenith
The weekly chart for KB Home is negative with the stock below its five-week modified moving average of $25.28 and above its 200-week simple moving average of $18.86, which is considered the "reversion to the mean" last tested during the week of Feb. 10, 2017 when the average was $15.97. The 12x3x3 weekly slow stochastic reading is projected to end this week at 24.74, down from 32.15 on Aug. 3.
Trading Strategy: Buy weakness to my monthly, quarterly, semiannual and annual value levels of $23.60, $22.52, $22.85 and $22.52, respectively, and reduce holdings on strength to the 200-day simple moving average at $28.60, which is not shown on the weekly chart.
Lennar (NYSE:LEN)
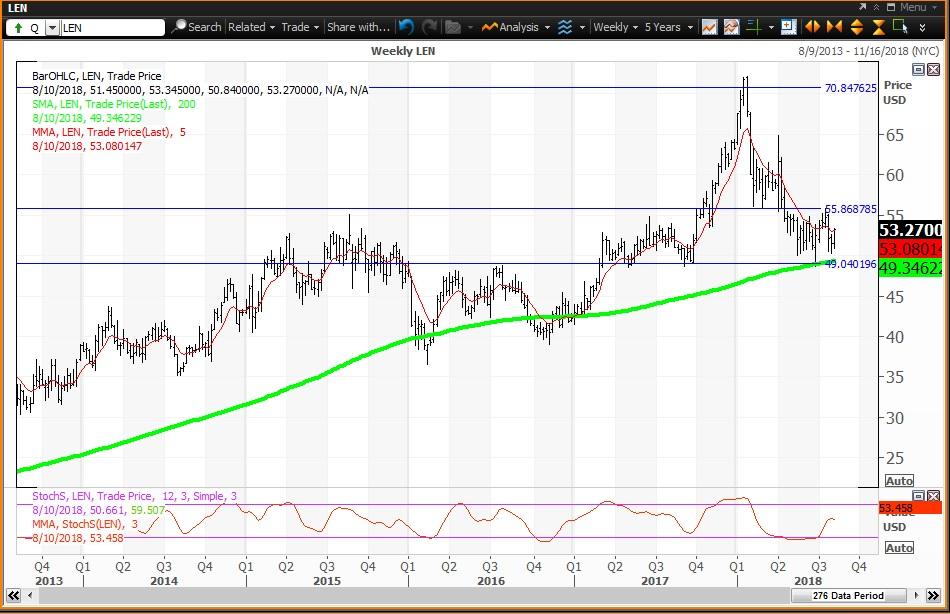
Courtesy of MetaStock Xenith
Lennar will have a positive weekly chart if the stock ends this week above its five-week modified moving average of $53.14. The stock tested and held its 200-week simple moving average during the week of June 29 providing a buying opportunity at its "reversion to the mean". The 12x3x3 weekly slow stochastic reading is projected to end the week at 53.80 which is not higher than on Aug. 3, so the weekly chart may be neutral, not positive.
Trading Strategy: Buy weakness to my monthly value level of $49.02 and reduce holdings on strength to my quarterly and semiannual risky levels of $58.16 and $58.84, respectively. My annual risky level is $70.88.
PulteGroup (NYSE:PHM)
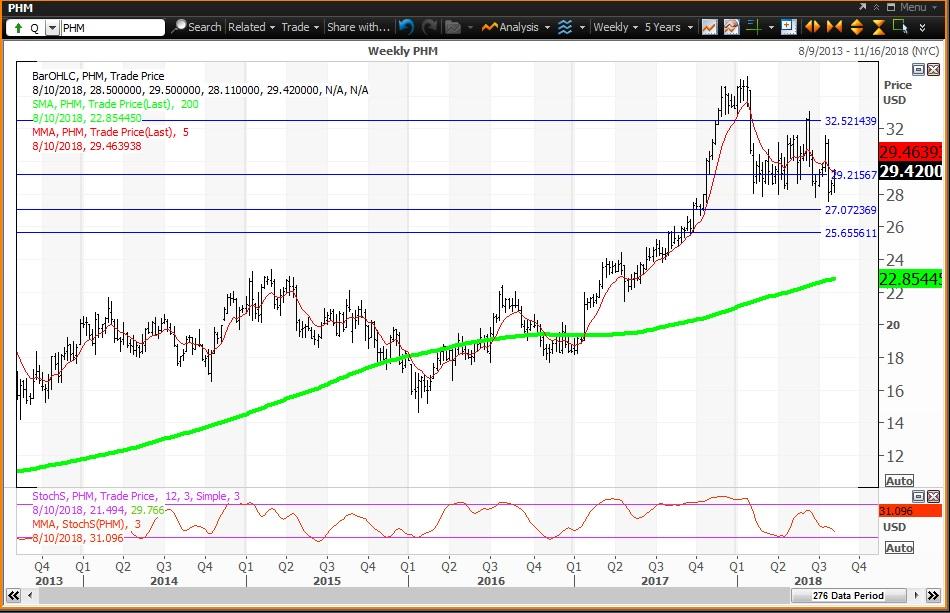
Courtesy of MetaStock Xenith
PulteGroup has a negative weekly chart with the stock below its five-week modified moving average of $29.46. The stock is well above its 200-week simple moving average of $22.85, which is the "reversion to the mean" last tested during the week of Jan. 27, 2017, when the average was $19.36. The 12x3x3 weekly slow stochastic reading is projected to end this week at 31.04, down from 35.90 on Aug. 3. Note how my annual pivot of $29.23 has been a magnet since the week of Feb. 9.
Trading Strategy: Buy weakness to my semiannual and monthly value levels of $27.08 and $25.64, respectively, and reduce holdings on strength to my quarterly risky level of $32.53.
Toll Brothers (NYSE:TOL)
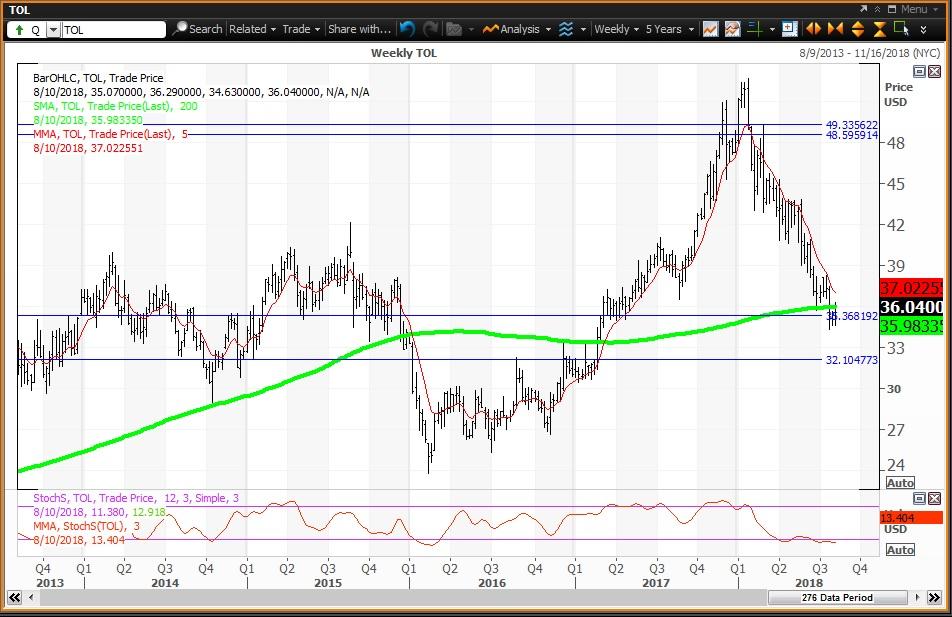
Courtesy of MetaStock Xenith
Toll Brothers has a negative but oversold weekly chart with the stock below its five-week modified moving average of $37.10. The stock is just above its 200-week simple moving average of $35.99, which is the "reversion to the mean" which has been a magnet for the last three weeks. The 12x3x3 weekly slow stochastic reading is projected to end this week at 13.88, well below the oversold threshold of 20.00. Note how my semiannual pivot of $35.36 has been a magnet for the last three weeks.
Trading Strategy: Buy weakness to my semiannual and monthly value levels of $35.36 and $32.08, respectively, and reduce holdings on strength the 200-day simple moving average of $43.59, which is not shown on the weekly chart. My annual and quarterly risky levels are $48.60 and $49.36, respectively.