
(Source: imgflip)
Due to reader requests, I've decided to break up my weekly "Best Dividend Stocks To Buy This Week" series into two parts.
One will be the weekly watch list article (the best dividend stocks to buy right now). The other will be the update on the Deep Value Dividend Growth Portfolio.
To also make those more digestible, I'm breaking out the intro for the weekly series into a revised introduction and reference article on the 3 rules for using margin safely and profitably (which will no longer be included in those future articles).
I'm also tracking updates to my new Bunker Dividend Growth Portfolio (100% undervalued dividend aristocrats and kings) anytime there is a change to that portfolio.
Introduction To The Deep Value Dividend Growth Portfolio
I've spent 23 years trying to find an investing strategy that can consistently achieve great returns that will enable me to achieve my dream of financial independence.
While there are many good investment strategies to choose from after five years as a professional analyst/investment writer, I've determined that for me (and many of my readers), three approaches work best.
First, I'm focusing on dividend growth stocks because historically, these have tended to significantly outperform the market, both on an absolute and risk-adjusted basis (total returns/volatility).

Second, I'm adding a value focus ("be greedy when others are fearful") because like dividend growth, value is a proven alpha factor that generally beats the market over the long term.
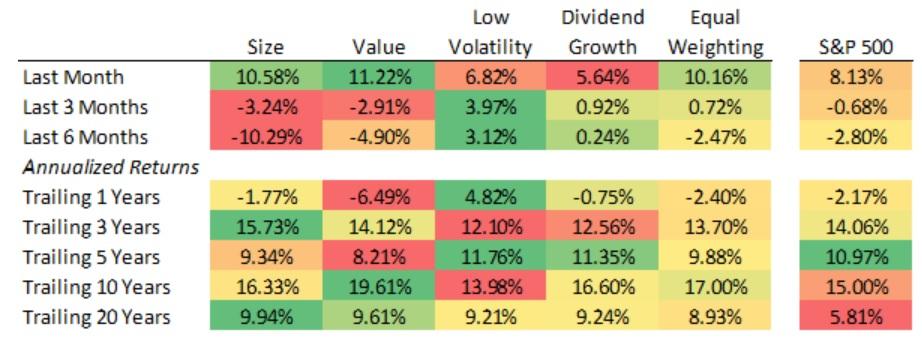
(Source: Ploutos Research) - note data through January 2019
Finally, I'm targeting low-risk dividend stocks, primarily sleep well at night or SWAN blue-chips (such as dividend aristocrats and kings) because they have shown a remarkable ability to generate safe and steadily rising income as well as market-beating total returns over the long term.
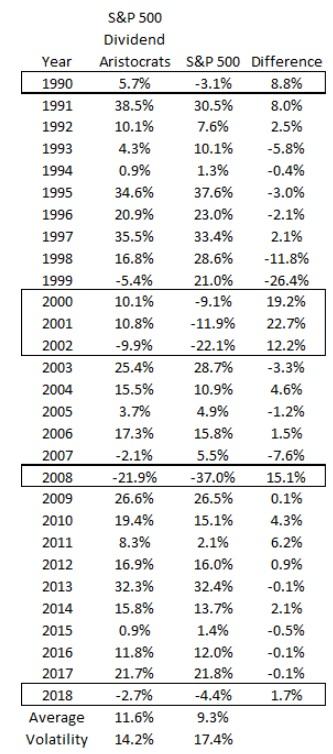
(Source: Ploutos Research)
That's thanks to usually keeping up with stocks during a bull market but falling less during bear markets. In other words, low-risk dividend growth stocks manage to outperform not by "hitting grand slams" but by "avoiding striking out".
What evidence do I have that such a value-focused low-risk dividend growth approach actually can beat the market over time?
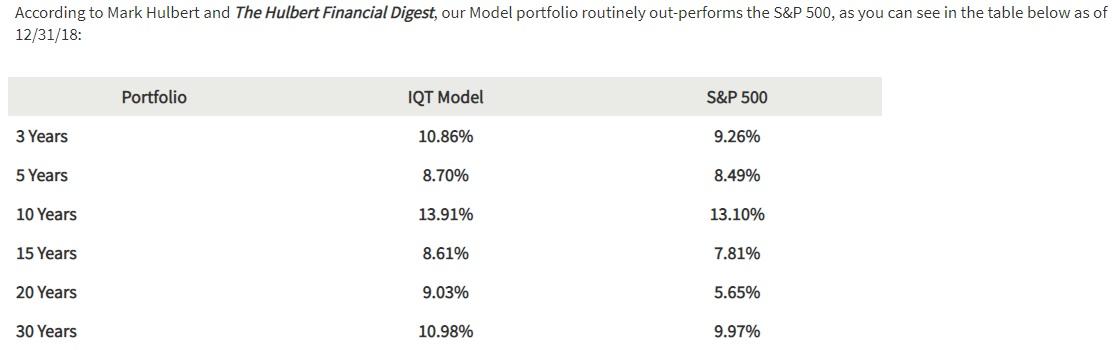
(Source: Investment Quality Trends)
Because asset manager/newsletter publisher Investment Quality Trends has been using a pure valuation approach on nothing but blue-chip dividend stocks (based on six quality criteria) since 1966 and has managed to consistently beat the market by about 10% with 10% lower volatility.
1% annual outperformance for 30 years doesn't sound like much but just 7% of mutual fund managers can even match the S&P 500 over 15 years. Beating the market by 1% over 30 years puts IQT in the elite of professional money managers/analysts.
I'm applying the same system to things like younger companies, as well as REITs, YieldCos, and MLPs, which due to the 25 years of uninterrupted dividends requirement IQT has, excludes these kinds of investments from their recommendations.
Basically, my investing strategy can be summarized like this:
- Only buy deeply undervalued blue chips (off my watch lists) during a market decline.
- Save 50% of weekly cash (invested in the form of T-bills or long-term Treasury bond ETFs) and wait for pullbacks/corrections/bear markets.
- During a pullback (average one every six months since WWII), deploy 50% of cash (sell the bonds) in stages.
- If the pullback becomes a correction, deploy 50% of remaining cash (in stages).
- If the correction becomes a bear market, deploy the remaining 50%.
This approach ensures that I'll be able to avoid hoarding cash for years on end (because market declines are frequent) and will always be able to buy some quality undervalued dividend growth stocks at highly attractive valuations.
I'm also considering deploying 50% of my real savings into the best-undervalued dividend growth opportunities on a monthly basis with the other 50% building up liquidity for market pullbacks (more on this in a second).
I use the same valuation-adjusted total return model that Brookfield Asset Management (BAM) uses, and they have a great track record of delivering 12-15% CAGR total returns (in fact, it's their official goal as a company and they usually exceed that target).
There are four carefully curated lists designed to focus on:
- Quality companies
- Safe dividends (they are all low-risk stocks)
- Good long-term growth potential
- Good margin of safety (attractive valuations)
The portfolio also uses size caps for risk management purposes (in case a thesis breaks)
- sector cap: 25%
- industry cap (like tobacco): 15%
- individual holding cap: 5%
This is currently a paper portfolio I'm maintaining on Morningstar and Simply Safe Dividends to not just provide in-depth portfolio stats but also the total returns over time. The rules for the portfolio are:
- Each month, I buy $500 worth (rounded up to the nearest whole share) of any existing portfolio positions that remain on the active buy list (fair value or better).
- Each week, I buy $500 worth of any new stocks that make it onto the "top 5 high-yield blue-chips/fast growers, aristocrats/kings" watch lists (stocks rotate on and off). But that's only if the long-term total return potential is 13+%, which is the official portfolio hurdle rate.
- If opportunistic buying opportunities appear (like a 5+% one day crash due to an earnings freakout), then I can move up the next month's buy to that day.
- Dividends are reinvested.
- Stocks are only sold if the thesis breaks or a stock becomes 25% overvalued (then sell half) or 50% overvalued (sell all of it), and the capital is reinvested into new active recommendations.
Again, this is purely a tracking (model) portfolio. I'm not yet putting real money into it until the late 2019 or early 2020, once I've eliminated all margin from my portfolio and started saving up cash (in the form of either ultra-short-term bonds or long-term bonds, depending on the state of the economy).
The reason I'm tracking this portfolio is to determine if the best use of my savings in the future is a combination of 50% dollar cost averaging and 50% opportunistic buying during downturns, or a 100% focus on downturns only.
Late 2018 (worst correction in 10 years) was an ideal time to buy quality dividend growth stocks at steep discounts. DVDGP's early returns have been sensational (small profit in December and 10% gain in January vs. S&P 500's 8% January rally) mainly due to starting the portfolio when valuations were at their lowest levels in years. But many investors want to also deploy cash on a consistent basis. The monthly DCA buys of all active buy recs is our way of simulating that and testing how much alpha this investing system generates in a rising market (beating S&P 500 by 0.7% in February so far).
Ultimately, DVDGP represents the culmination of my 23 years of experience and is designed to be a safe income growth portfolio that almost anyone can use. Or to put another way, if I were managing a pension/endowment fund, this is what the equity portion of that portfolio would look like. Thus it's also safe for most readers, as most of its holdings are "widows and orphans" stocks including plenty of dividend aristocrats and kings.
How can you use DVDGP? Mainly for investing ideas, and not necessarily tracking it move for move (it owns 76 companies and most people prefer a more concentrated portfolio). Since I'm an analyst for Simply Safe Dividends (researching over 200 companies per year) I am basically building out a smart beta ETF with DVDGP. One that yields double the S&P 500, has faster dividend growth and that should be able to outperform it by a wide margin over time (or so my total return model says which is why I'm testing it).
If the strategy works as well as expected I may partner with Brad Thomas and Chuck Carnevale to turn it into a closed-end fund. That would allow investors to profit from the portfolio but avoid the problems money managers have with redemptions forcing them to sell during market declines when they should be buying instead.
Think of DVDGP as a quality screening tool and master watch list of dividend stocks I consider worth owning for most investors. Then use it to help build your own watch lists and then buy those companies when they hit fair value or better.
2 New Companies Added This Week...Plus Our Monthly Dollar Cost Averaging Buys
I added $500 to the following companies.
LNC was added when a reader asked me to look at the company and I liked what I saw. That's based on my new "Sensei Quality Score", a three-variable analysis of the quality of a dividend stock based on
- dividend safety (cash flow trends, payout ratio, balance sheet)
- business model risk (moat, disruption risk, ability to generate ROIC above cost of capital)
- management quality (capital allocation track record)
The score has a range of 3 to 11, with 9+ being a SWAN stock and companies with 7 and 8 being good buys at the right price. LNC scores a 9 on my quality scale, making it a SWAN stock. That's courtesy of a very safe dividend (steady 16% payout ratio since 2015 despite 21% CAGR dividend growth over the past five years).
It's also courtesy of a no moat, but stable and thriving insurance business built on strong underwriting standards, a better than average brand portfolio, and above average management. Specifically, the company's returns on invested capital have been above 8% (a benchmark for good insurers) since 2011 and in the past year hit 11%. Given how low interest rates have been over the past decade (which makes profit growth harder for insurers), that's a testament to the high-quality of this insurance company.
Intercontinental Exchange (11/11 SWAN) is a wide moat, very well run and rapidly growing company (about 50% CAGR dividend growth over the past five years) that also happens to be trading near its 52 week low (and is 14% undervalued per DYT).
ICE owns several stocks exchanges, including the NYSE and the Brent Crude futures market (the international oil standard), but that's not the biggest reason to own the company. Rather, it's the selling of order flow data that is incredibly valuable to financial companies that have turned Intercontinental into a profit minting machine.
Today about 40% of operating profits are from the fast-growing information services segment which has helped drive the operating margin to 53% and FCF margin to 39% (one of the most cash-rich companies in the world). That's why, despite a torrid dividend growth rate, ICE's FCF payout ratio has been stable at a very safe 25%.
As part of my Quality Score watchlist, I've also programmed Google Sheets to tell me when a SWAN stock is trading near its 52 week low, making it an "ultra value" dividend stock.
Each week I'll check which quality companies are near 52-week lows, and add one or two to my master watchlist (and the quality watchlist as well). That will drive new company additions to the DVDGP as well as be of immense use to me and readers via article ideas and possibly a future model portfolio.
So far since I completed the new "ultra value" watchlist I've used it to make 3 real money purchases for my retirement portfolio (selling lower-quality stocks at a profit to buy higher-quality ones at firesale prices). The first week's results are outperforming the S&P 500 (in a week when the market rose 3%) by 2.2%.
Basically, I intend to use this powerful new spreadsheet tool to generate great investing ideas for readers, my model portfolios, and my retirement portfolio.
The Deep Value Dividend Growth Portfolio - 79 Total Holdings
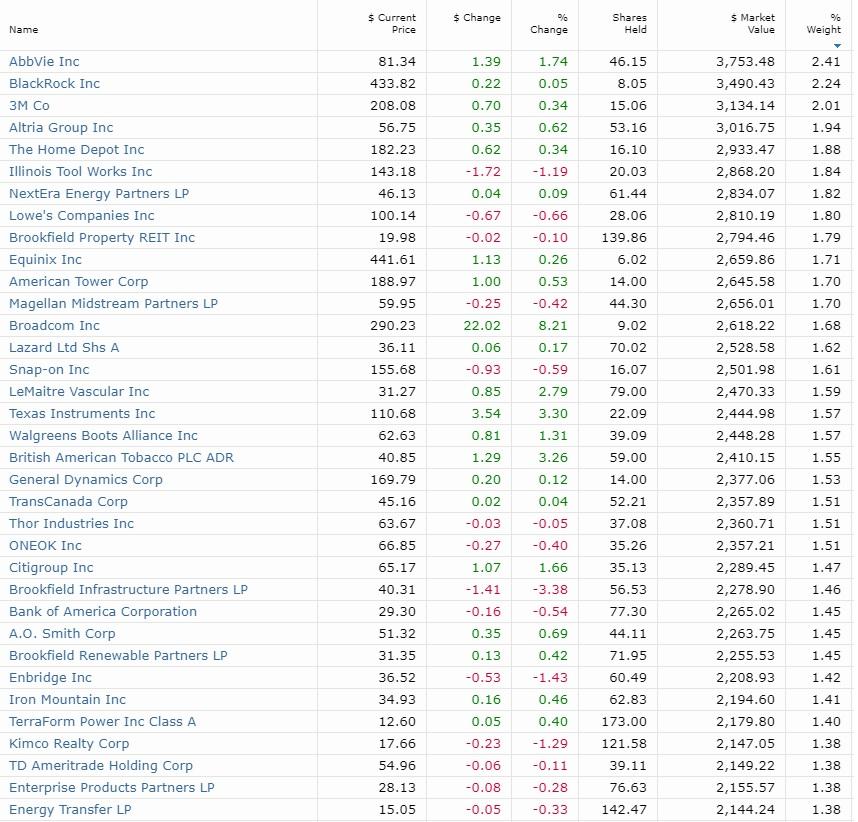
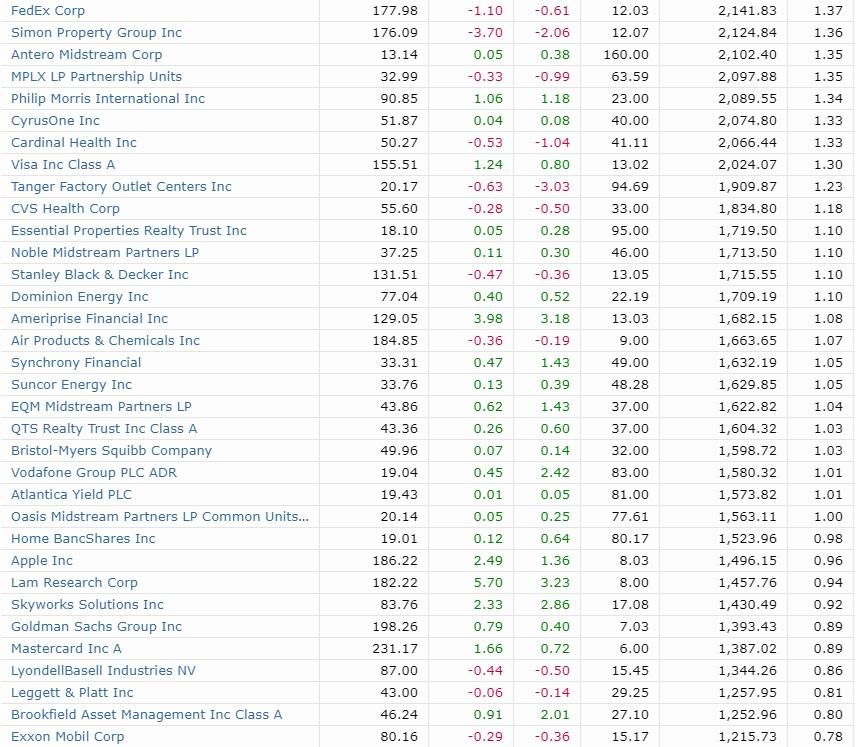
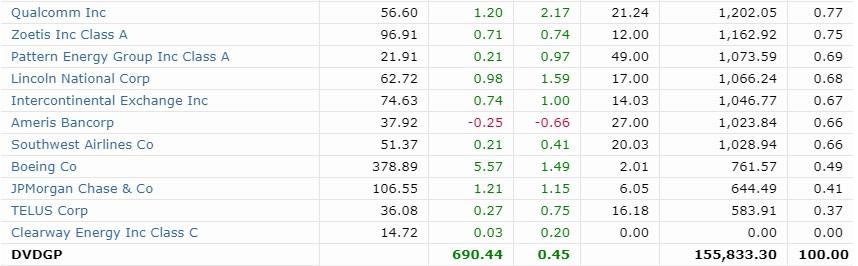
(Source: Morningstar) - data as of March 15th close, CWEN is no longer owned by the portfolio because I sold it before it cut its dividend by 40%.
Our Highest Yielding Stocks
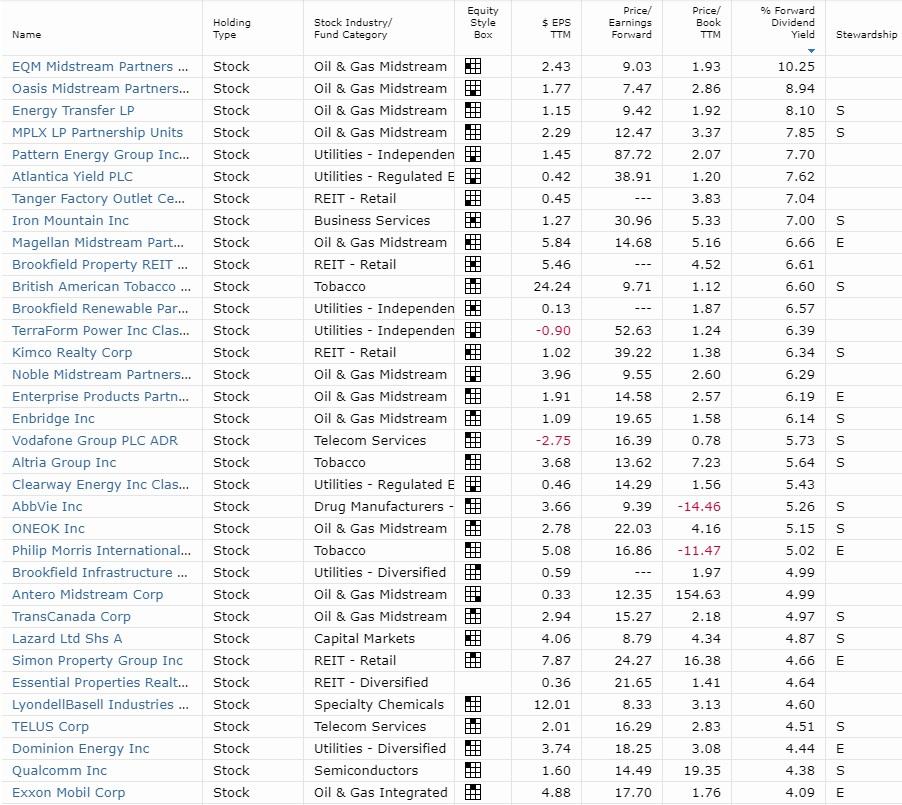
(Source: Morningstar) - data as of March 15th
(Source: Morningstar)
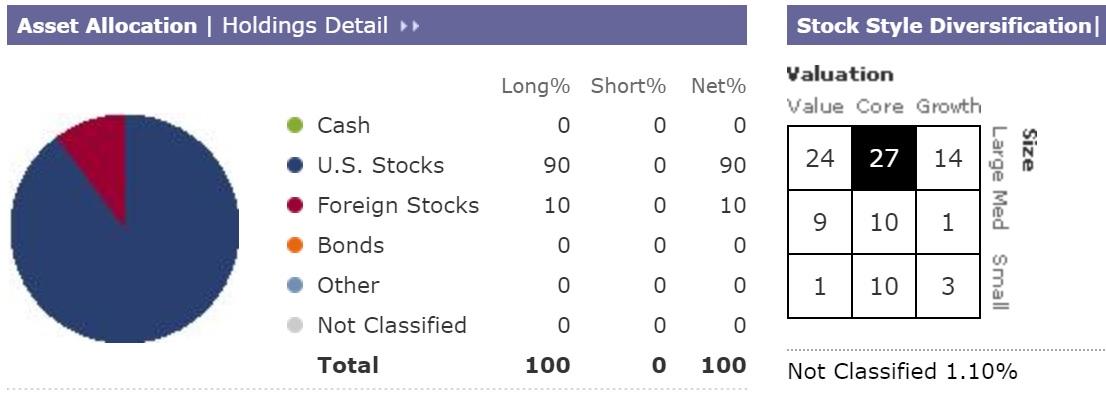
We're mainly focused on large-cap US dividend stocks because the goal of this portfolio is to only own low-risk SWAN stocks. Low-risk is defined as low-risk of a dividend cut during a recession. Note that in reality many of our large cap blue-chips have significant overseas sales so we have plenty of exposure to global growth markets.
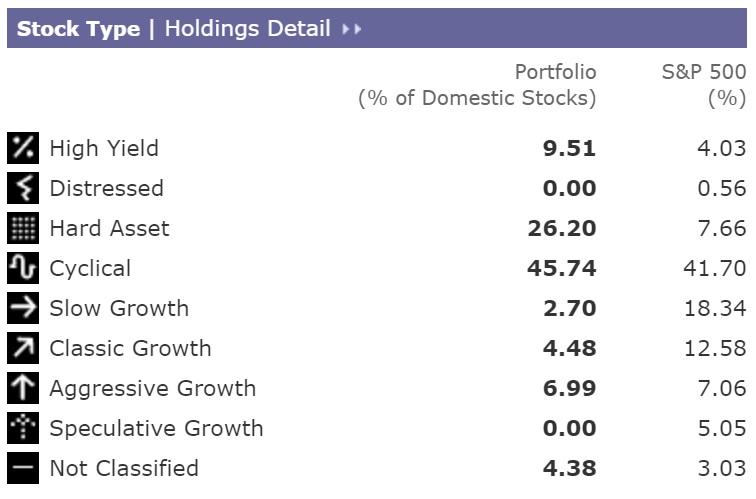
(Source: Morningstar)
Due to the preference for undervalued stocks we're overweight high-yield, hard asset, and cyclical companies.
Sector Concentration (25% Sector Caps, 15% Industry Caps, And 5% Company Caps In Place)
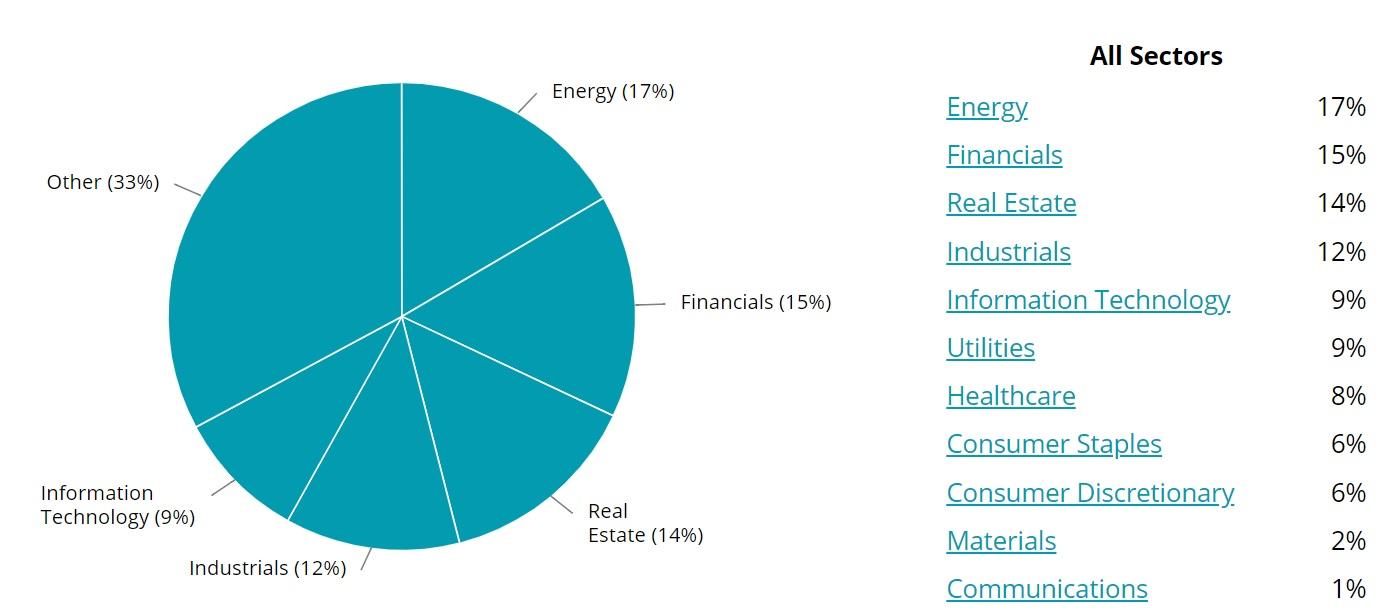
(Source: Simply Safe Dividends)
I'm imposing firm sector caps to ensure good risk management. No matter how good the bargains may be, it's never a smart idea to let your portfolio get too risky. Due to most of our energy stocks being midstream corporations or MLPs, I'll be capping that sector at 20% to limit exposure to that industry to 15%.
Income Concentration
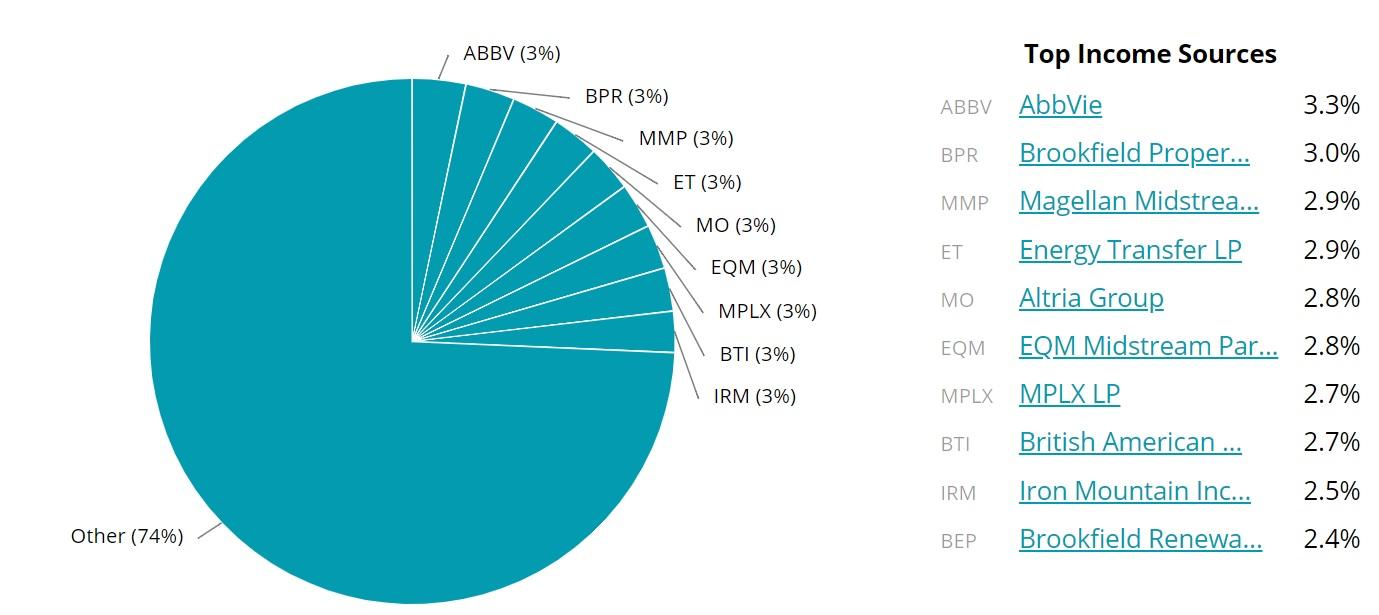
(Source: Simply Safe Dividends)
The portfolio's income is likely to be concentrated into the highest-yielding names, at least until it becomes more diversified over time. A good rule of thumb is you want to limit income from any one position to 5% or less. We've now achieved that goal in DVDGP.
Annual Dividends
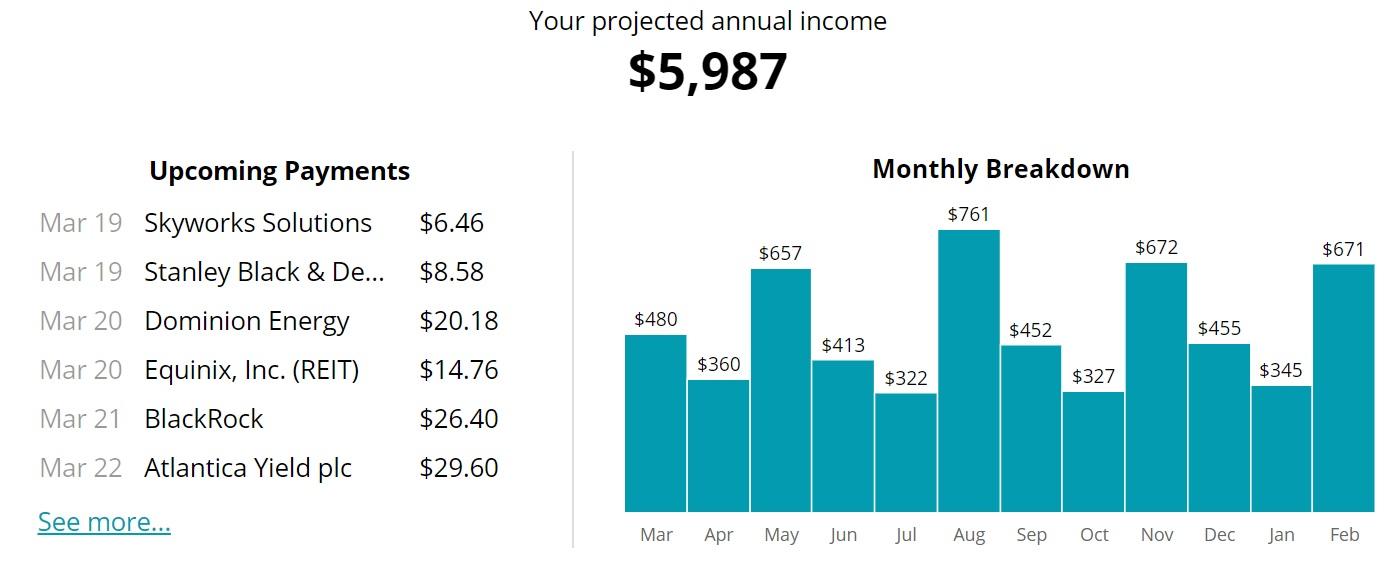
(Source: Simply Safe Dividends)
While we may never fully get to the dream of daily dividend payments, the portfolio might get close. And the monthly income flow will smooth out nicely over time and should continue growing rapidly (double-digits is the goal).
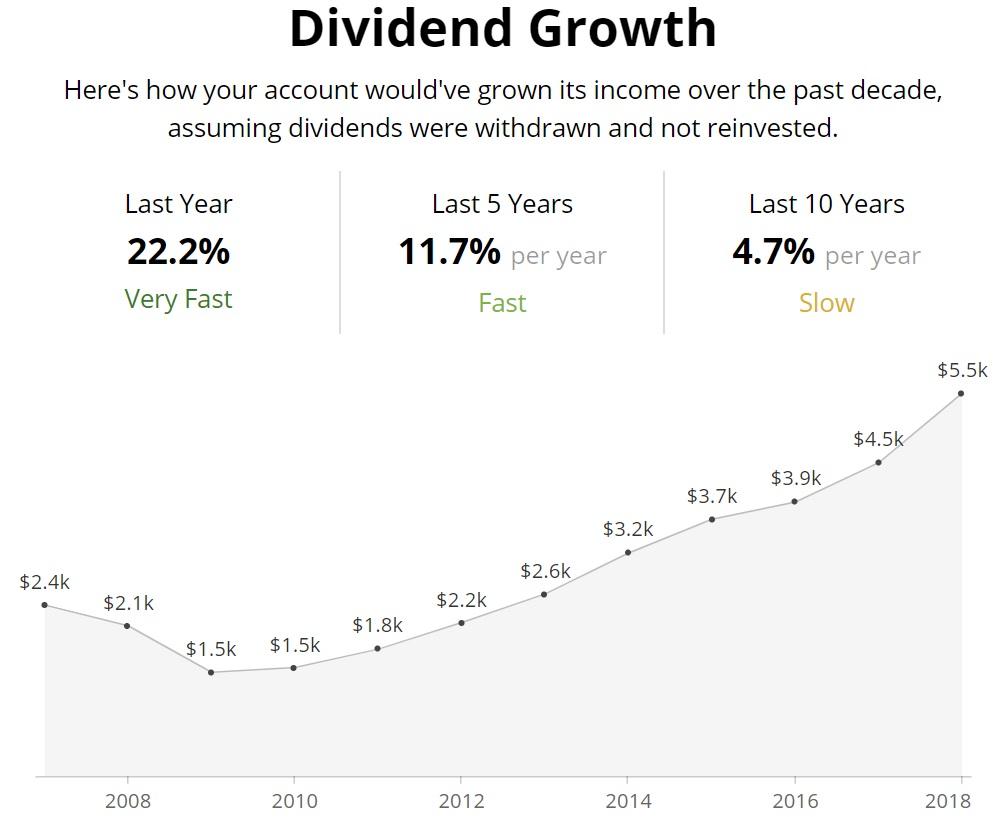
(Source: Simply Safe Dividends)
Note that the 10-year dividend growth figures are artificially low because my tracking software doesn't average in anything that hasn't existed for those time periods. Some of these stocks have IPO-ed in the last five years, and so, the 1-year and 5-year growth rates are the most accurate. These figures are purely organic growth rates and assume no dividend reinvestment.
The dividend declines during the Financial Crisis were due to REITs (such as Kimco and Simon) which cut their dividend (as 78 REITs did during the Great Recession) as well as our large exposure to mega-banks. Fortunately, since then, the REIT sector has deleveraged and enjoys the strongest sector balance sheet in history.
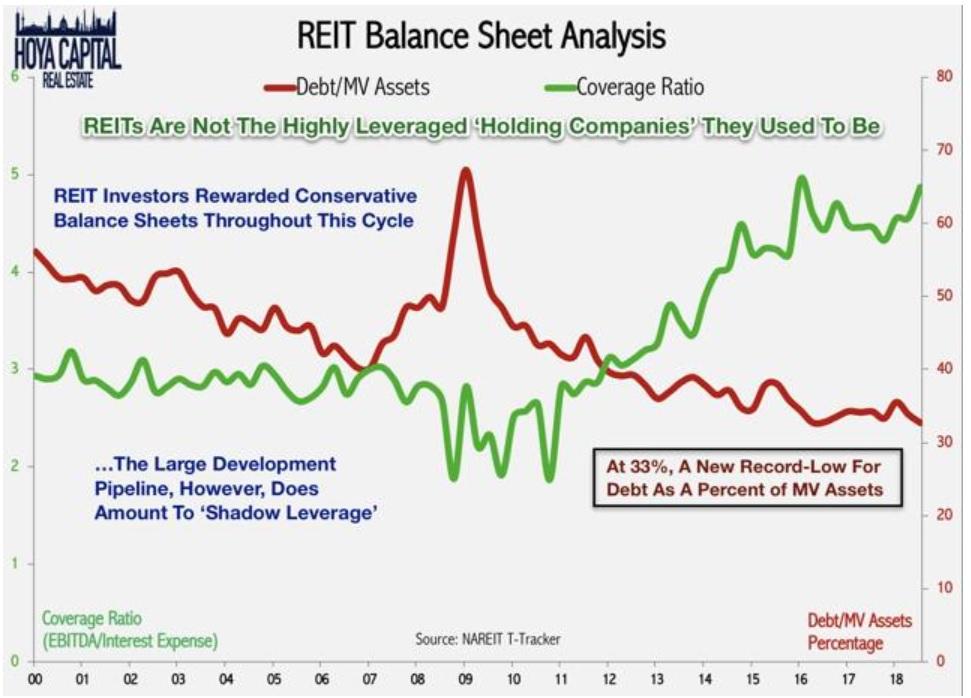
(Source: Hoya Capital Real Estate)
This means that during the next recession, most REITs will not cut their payouts, especially Kimco, which has a BBB+ credit rating and will be getting an upgrade to A- in 2019 or 2020. Simon is one of just 2 REITs with an "A" credit rating.
Top REIT Credit Ratings (S&P)
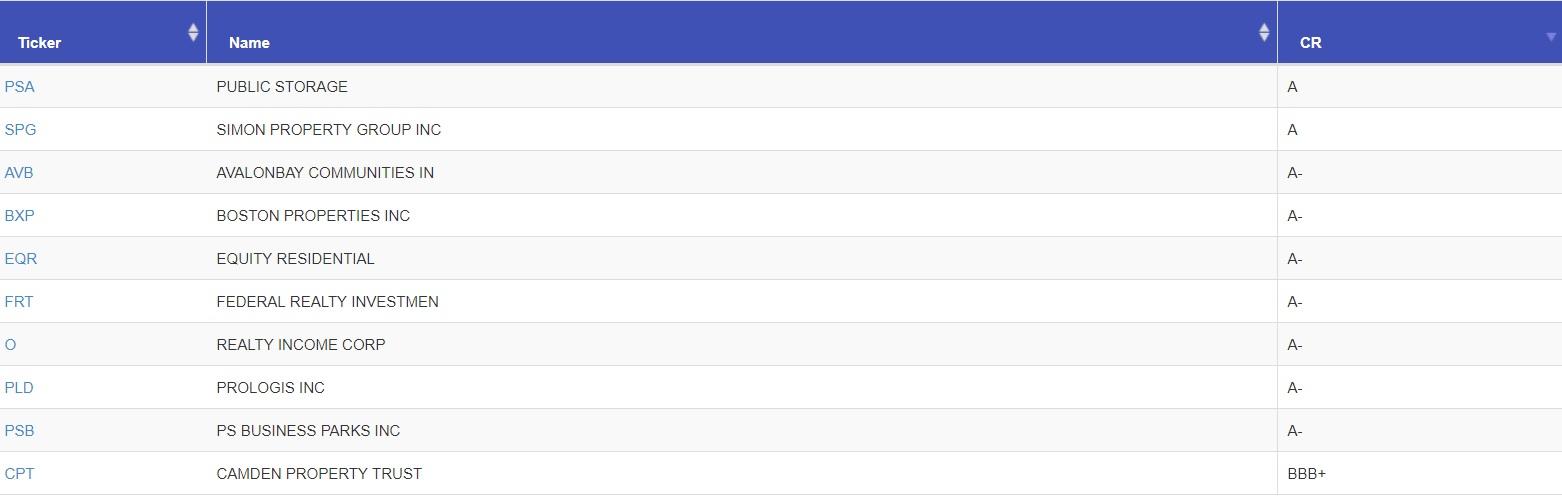
(Source: F.A.S.T.Graphs)
Similarly, I am confident that every bank we own (C, JPM, BAC, GS, HOMB, ABCB) will maintain its dividends through future recessions (though they are likely to be frozen).
There is no official dividend growth target, though I'd like to at least maintain long-term dividend growth (either 1-year or 10-year) which is above the market's historical 6.4% payout growth rate. The huge jump in the 1-year dividend growth rate is courtesy of some of our semiconductor stocks, several which raised their dividends by over 100% in the past 12 months.
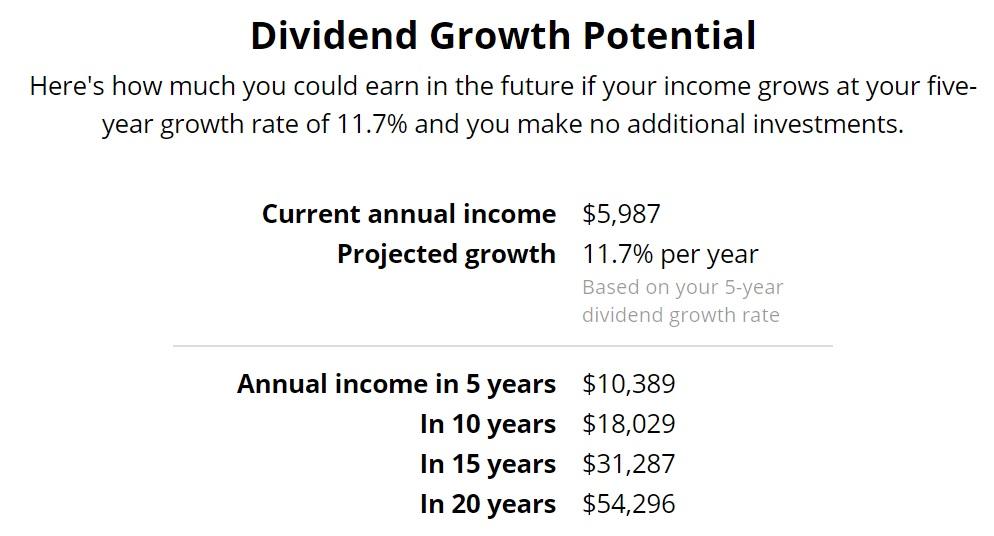
(Source: Simply Safe Dividends)
While maintaining 11.8% dividend growth for 20 years is likely beyond the portfolio's ability, according to Morningstar, the projected EPS (and thus likely dividend) growth rate is about 11.6% over the next five years.
Fundamental Portfolio Stats: (Total Return Potentials Are From Current Levels)
- Yield On Cost: 4.1%
- Yield: 3.9%
- Expected 5-Year Dividend Growth: 11.6%
- Expected 5-Year Total Return (No Valuation Changes): 15.5%
- Portfolio Valuation (Morningstar's DCF models): 10% undervalued
- 5-Year Expected Valuation Boost: 2.1% CAGR (20% margin of error)
- 10-Year Expected Valuation Boost: 1.1% CAGR (20% margin of error)
- Valuation-Adjusted Total Return Potential: 16.6% to 17.6% (market's historical return 9.1%) - note margin of error 20%
- Margin of error adjusted total returns expected: 13.3% to 21.1%
- Portfolio Beta: 1.03 (3% more volatile than S&P 500)
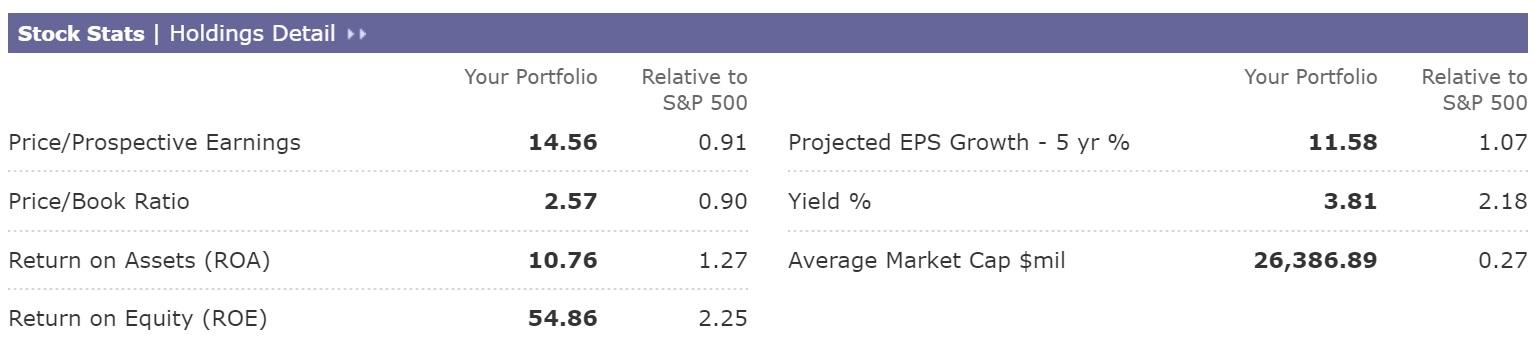
(Source: Morningstar)
The quality of these companies can be seen in the far-above-average returns on assets and equity of this portfolio (good proxies for quality long-term management and good corporate cultures) as well as faster projected earnings growth rates.
DVDGP is also far more undervalued, offers a much higher yield and should achieve far superior dividend growth compared to the broader market. That's due to corporate America's bigger focus on buybacks vs. dividend hikes for most non-dividend focused companies.
As an added benefit, the average market cap is smaller, providing yet another alpha factor (smaller stocks tend to outperform). Note that the overall focus is on blue chips, which means that the average market cap is likely to rise over time (but remain far below the market's $100 billion average).
Portfolio Performance
- CAGR Total Return Since Inception (December 12, 2018): 14.8%
- CAGR Total Return S&P 500: 9.1%
- Market Outperformance: 5.7%
- Long-Term Outperformance goal: 2+%
- YTD: 12.3% vs. S&P 500 13.1%
(Source: American Enterprise Institute)
Beating one's target benchmark is extremely difficult, even for professional money managers. That's because "hot funds" see lots of new money flows which makes it harder to recreate that success the next year.
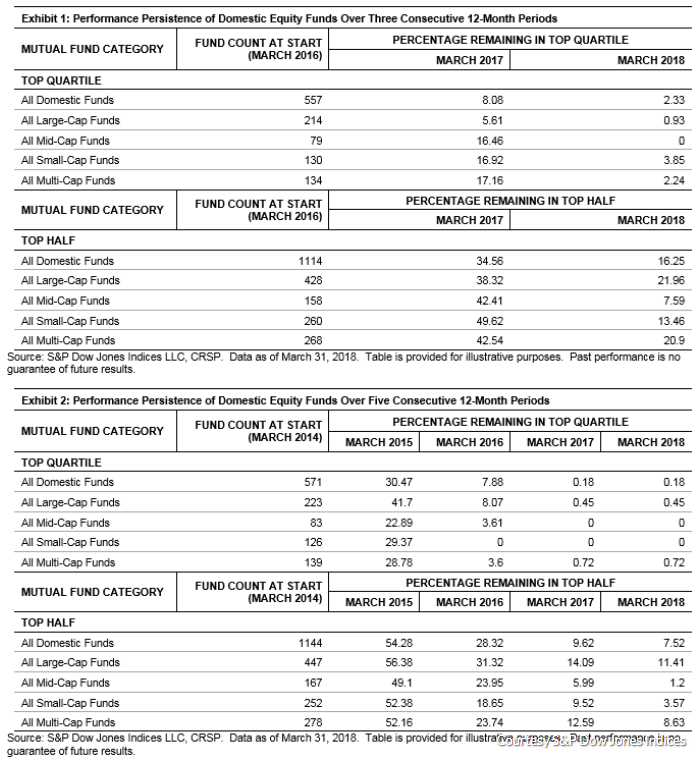
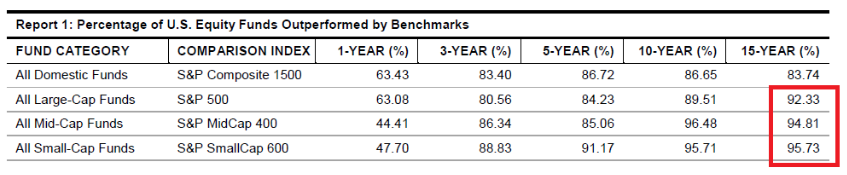
(Source: S&P)
In addition, during market declines retail investors pull money out causing professional money managers to be forced sellers instead of buying at fantastic valuations. Thus, just 0.45% of mutual funds remain in the top quartile of performers for five consecutive years.
This is why DVDGP is a margin-free portfolio, using steady cash inflows (simulating steady and high savings) to buy opportunistically. There is no guarantee that the strategy can beat the market over time, but avoiding the biggest pitfalls of active money managers means I believe we have a very good chance.
Worst Performers
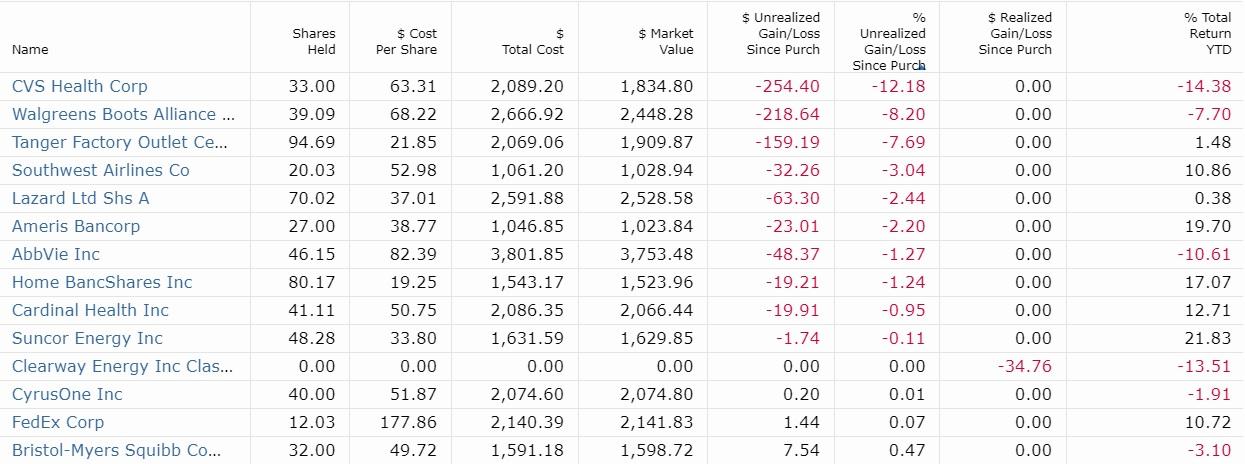
(Source: Morningstar) data as of March 15th, Clearway is no longer owned, and thus shows up as a 0% gain.
The good news is that due to our monthly additions to all stocks that remain active buy recommendations, the more any stock falls in the short term, the lower our cost basis will become, boosting long-term gains. That's assuming the thesis doesn't break, which is where the high diversification comes in to lower the risk of a permanent loss of capital.
Best Performers
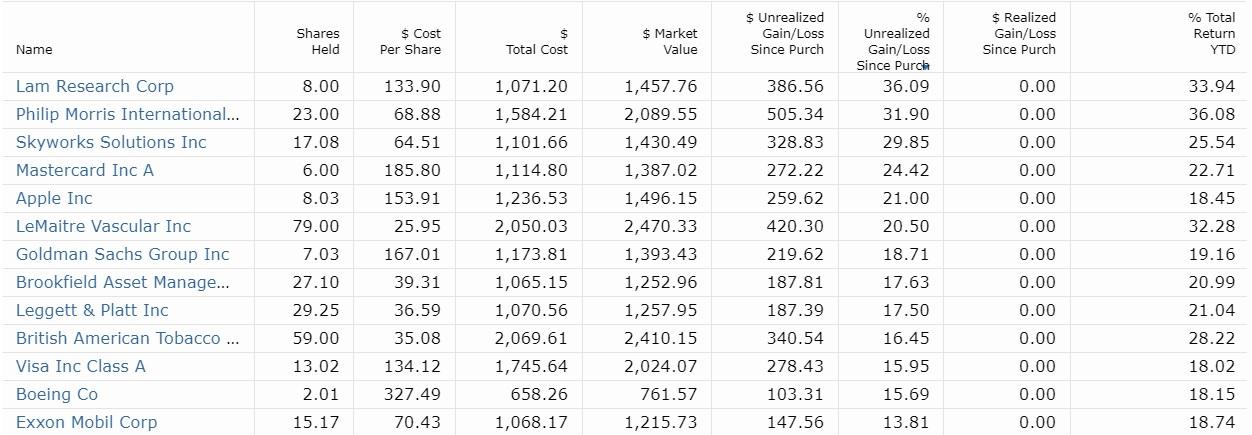
(Source: Morningstar) data as of March 8th
The downside of our dollar cost averaging approach is that we also raise our cost basis for early winners. This is why I'm testing the DCA approach to see if it can continue to generate alpha outside of steep market declines.
However, since we only buy great companies at good to great valuations, ultimately, we should be able to deliver very strong returns. That's because winners tend to keep on winning, and thus adding to winners even at a higher cost basis should help keep the portfolio well balanced and avoid getting too top-heavy with out of favor companies that could cause very long stretches of underperformance.
This is why the monthly DCA buys are mostly based on target yields from the DVDGP Bear Market Buy List, to help keep the portfolio well balanced. The sector caps are also in place to avoid becoming too top heavy in any one sector.
Bottom Line: Thus Far This Portfolio's System Appears To Be Working
I know that a lot of readers think that owning nearly 80 companies is way too much and that effectively creating your own index fund is a recipe for market-like returns but with a lot more work.
But remember that the goal of DVDGP is to not just provide good returns over time, but to test out various time tested investing strategies, specifically focusing on proven alpha factors like
- strong dividend growth
- above average quality (as seen via profitability)
- undervaluation
Thus far the results have been roughly what my valuation-adjusted total return model predicts, which is about 6% market outperformance. It's too early to tell if that is sustainable over time, or if I'll have to make adjustments in the future.
But for now, DVDGP is offering double the market's yield, with faster dividend growth, owning a diversified collection of quality companies in every sector. I remain confident that 2+% long-term alpha is achievable with this strategy, especially given my new approach to expanding the UV SWAN watchlist, which should provide many great investing ideas in the future.