Our Savvy Senior Income Factory started off strong in 2019, recovering all the ground lost in 2018 (in terms of total return, which was minus 9.8% last year) and then some, as it continued to produce its "river of cash" at an 11.5% weighted average distribution rate.
Meanwhile most of its assets - the machines that produce that cash - climbed out of bargain basement territory, producing an overall 21% total return as we go to press here just over a week into April.
Of course, given our strategy of growing our long-term wealth by re-investing and compounding cash distributions, rather than depending on earnings or stock-price growth, the paper profits we have accumulated so far this year may be seen as a mixed blessing.
While it gives us a warm and fuzzy feeling to see the prices of our securities shoot up, from a non-emotional, analytical perspective we already miss the bargain prices and ultra-high yields that we were able to take advantage of in our re-investing and compounding throughout the 4th quarter and into early 2019.
If bemoaning the rise in prices of our own portfolio does not sound like your typical "total return" strategy, that's because it's not. Readers who are new to our Income Factory approach, and can't wait to read the book about it to be published later this year by McGraw Hill, may wish to check out these articles: links here and here.)
But I am not complaining. Neither are the "Widows & Orphans" or anyone else who may have adopted the lower risk/reward "W&O" portfolio that we introduced about a year ago. Unlike our original Savvy Senior portfolio, also known as the Income Factory, which is a real portfolio I have been managing for over 25 years and writing about for about 8 years, the Widow & Orphan portfolio still only exists in theory. (Although I have owned all of the funds at one point or another in my own accounts or in accounts I manage for family and friends.) But I have been tracking the performance of its components on a pro forma basis.
As readers know from past articles, the W&O portfolio, despite its supposedly being less risky, actually outperformed its Savvy Senior sibling portfolio throughout 2018, at least on a total return basis. But our Factory has come roaring back and eclipsed the W&O portfolio's 15.5% year-to-date total return with its own return of 21%.
Of even greater significance is the difference in distribution yields, where our Income Factory is still earning a current cash distribution rate of 11.5% versus about 8% for the W&O portfolio. At that rate the W&O portfolio will double and then re-double its income stream, again and again, about every nine years. If it manages to continue at an 11.5% rate, our Income Factory's cash output should double and re-double itself about every six years. Both are attractive long term returns, although the higher potential return of the Savvy Senior/Income Factory portfolio obviously brings with it higher potential risk of volatility, distribution cuts, etc. along the way.
As I have discussed in previous articles (like this one) I am prepared to endure some downside surprises, like occasional dividend cuts or some erosion of principal over time through return of capital (ROC), when I deliberately opt for an "ultra" high yield strategy that utilizes CLO funds (like ECC and OXLC) that pay distributions in the 14 to 16% range, or leveraged exchange-traded-notes (like MORL, REML or BDCL) with their nose-bleed yields of around 20%. By including funds like these in my portfolio, I can increase the current distribution from a "normal" high yield of perhaps 9 or 10% by another 1% or 2%. Even if I end up giving some of the ultra-high yield back in ROC or NAV erosion over the years, if it boosts the yield at which I am re-investing and compounding by even a portion, say 1/2% to 1% of the nominal yield differential, over several decades that will be well worth it.
Here is our asset class distribution as we go to press in early April, which shows little change from last quarter, as the side-by-side comparison underneath shows.
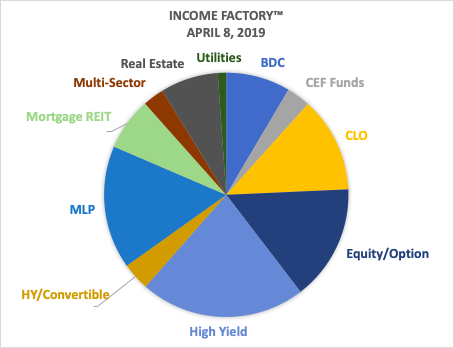
| Asset Class | 1/5/19 | 4/8/19 | Change |
| BDC | 8% | 9% | 0.5% |
| CLO | 13% | 13% | -0.4% |
| CEF Funds | 4% | 3% | -0.9% |
| High Yield | 18% | 22% | 3.9% |
| HY Convertible | 3% | 4% | 0.7% |
| MLP | 19% | 16% | -2.7% |
| Mortgage REIT | 7% | 7% | 0.0% |
| Real Estate | 7% | 8% | 0.6% |
| Utilities | 1% | 1% | 0.1% |
| Equity/Option | 16% | 15% | -0.7% |
| Multi-Sector | 3% | 3% | -0.2% |
| Bank Loan | 1% | 0% | -1.0% |
| 100% | 100% |
I have made few major changes. Some changes reflect distribution cuts (EMO, AMZA, NCZ, KYN) and others reflect conscious reductions in the holding. AMZA falls into both categories. AMZA has been a big disappointment, although I have kept a chunk of it in hopes that it will still end up benefitting from the slow but steady recovery in the MLP sector, and that management has learned some lessons that we will all eventually benefit from. We shall see.
I also sold VVR, which readers may remember I bought in December having misread an item on CEFConnect and thought it was a bigger bargain with a higher distribution that turned out not to be the case. Fortunately for me, it gave me a nice capital gain before I ended up selling it and replacing it with ACP, which I had ungraciously kicked out of the portfolio a month or so earlier but decided to invite back in after reading some more positive analysis right here on Seeking Alpha (Thanks to @Stanford Chemist and @Arbitrage Trader!).
I have been re-investing new cash from distributions in:
- Advent Claymore Convertible Securities (AVK): 9.4% yield, -11% discount
- Wells Fargo Multi-Sector Income (ERC): 9.9% yield, -8.2% discount
- Voya Global Equity Dividend & Premium Opportunity (IGD): 11.4% yield, -8.4% discount
- Apollo Tactical Income Fund (AIF): 8.6% yield, - 11.2% discount
In summary, our portfolio is doing its job. It's cranking out cash at an 11.5% rate which we are re-investing in funds that are still attractively priced. There is still lots of geopolitical and economic uncertainty ahead, but as we have discussed many times before, our portfolio is well diversified and primarily represents a big bet on companies across the board to continue what they are currently doing: stay alive and meet their interest and routine dividend payments; i.e. "finish the race." Unfamiliar reference? Check out this article.
One asset class that continues to get a lot of attention is collateralized loan obligations (CLOs), which we invest in through Eagle Point Credit (ECC) and Oxford Lane Capital (OXLC). There have been a number of good articles on both funds and on CLOs in general by @StanfordChemist, @Treading Softly and @Rida Morwa that I recommend to readers who wish to be brought up to date on these funds and the asset class. Read the comment strings especially, for additional insights. In general there is a lot of misunderstanding by retail investors about CLOs, which are essentially cash flow vehicles whose mark-to-market pricing is reported (estimated, actually) because it is legally required to be and has little relationship to the underlying value of the assets and cash flows. This all means that we are getting premium yields because of what I consider to be complexity and liquidity risk, not so much credit risk, especially to long-term holders. So, in short, I'm happy with my holdings in both OXLC and ECC. They are not without risk, but at an average cash distribution yield of 15%, I think I am paid appropriately for taking it.
Here is the entire Income Factory, as of the beginning of this week. Below it is a list of the funds in the Widow & Orphans portfolio, and their performance for the year to date. Those interested in more information about the W&O funds may wish to visit the CEF Connect site.
| Income Factory - April 8, 2019 | Symbol | Distribution Yield | Discount/ Premium | Total Quarterly Portfolio Income % | Total Portfolio Income % Last Quarter | Asset Class | |
| First Trust Spec Fin'l Oppty | (FGB) | 11.48% | 1.84% | 7.27% | 7.27% | 0.00% | BDC |
| Brookfield Real Assets | (RA) | 10.88% | -7.74% | 7.00% | 7.00% | 0.00% | High Yield |
| Eagle Point Credit | (ECC) | 13.70% | 24.56% | 6.61% | 6.61% | 0.00% | CLO |
| Oxford Lane Capital | (OXLC) | 16.50% | 29.89% | 6.02% | 6.02% | 0.00% | CLO |
| Centercoast Brookfield MLP | (CEN) | 14.60% | 0.00% | 5.13% | 5.13% | 0.00% | MLP |
| Miller Howard High Income | (HIE) | 12.05% | 2.58% | 5.12% | 4.43% | 0.69% | Equity/Option |
| Guggenheim Enhanced Eq Inc | (GPM) | 12.06% | -0.25% | 4.61% | 4.61% | 0.00% | Equity/Option |
| CS XLinks 2XLev Mtge REIT | (REML) | 20.00% | NA | 4.49% | 4.49% | 0.00% | Mortgage REIT |
| Neuberger Berman RE | (NRO) | 9.62% | -11.21% | 4.19% | 4.19% | 0.00% | Real Estate |
| Nexpoint Credit Strategy | (NHF) | 11.12% | -12.09% | 3.95% | 3.95% | 0.00% | High Yield |
| Barings Global Short Dur | (BGH) | 9.58% | -4.33% | 3.48% | 3.14% | 0.34% | High Yield |
| Clough Global Opps | (GLO) | 10.84% | -10.54% | 3.19% | 3.36% | -0.17% | Equity/Option |
| Aberdeen Global Property | (AWP) | 10.02% | -11.13% | 3.17% | 2.96% | 0.21% | Real Estate |
| Rivernorth Opportunity | (RIV) | 12.15% | -5.14% | 3.15% | 3.89% | -0.74% | CEF Funds |
| Calamos Global Dyn Inc | (CHW) | 10.38% | -1.46% | 2.80% | 2.68% | 0.12% | Multi-Sector |
| ETRACS Lev REIT | (MORL) | 21.00% | NA | 2.48% | 2.47% | 0.01% | Mortgage REIT |
| Clearbridge Energy MLP | (EMO) | 9.38% | -12.02% | 2.33% | 3.24% | -0.91% | MLP |
| ETFIS InfraCap MLP ETF | (AMZA) | 16.00% | NA | 2.22% | 3.05% | -0.83% | MLP |
| Fiduciary Claymore MLP | (FMO) | 11.87% | -4.22% | 2.17% | 1.89% | 0.28% | MLP |
| Allianz Convert & Inc II | (NCZ) | 10.11% | 4.91% | 2.14% | 2.74% | -0.60% | HY/Convertible |
| Aberdeen Income Credit Strat | (ACP) | 11.68% | -5.86% | 2.02% | 0.00% | 2.02% | High Yield |
| KKR Income Opportunity | (KIO) | 9.52% | -5.91% | 1.75% | 1.75% | 0.00% | High Yield |
| Nuveen All Cap Energy MLP | (JMLP) | 10.65% | -5.76% | 1.60% | 1.60% | 0.00% | MLP |
| Kayne Anderson MLP | (KYN) | 9.0% | -7.82% | 1.54% | 1.70% | -0.16% | MLP |
| Advent Claymore Conv Sec | (AVK) | 9.44% | -11.10% | 1.52% | 0.00% | 1.52% | Convertibles |
| Duff & Phelps Sel Energy MLP | (DSE) | 11.67% | -8.38% | 1.32% | 1.32% | 0.00% | MLP |
| Apollo Tactical Income | (AIF) | 8.62% | -11.16% | 1.24% | 0.00% | 1.24% | High Yield |
| ETRACS Lev BDC | (BDCL) | 15.5% | NA | 1.24% | 1.24% | 0.00% | BDC |
| Reaves Utility Income | (UTG) | 6.01% | -1.68% | 1.12% | 1.12% | 0.00% | Utilities |
| Wells Fargo Multi-Sector Inc | (ERC) | 9.87% | -8.01% | 1.05% | 0.00% | 1.05% | HighYield |
| Wells Fargo Incom Opp | (EAD) | 8.89% | -10.73% | 1.05% | 0.87% | 0.18% | High Yield |
| Eaton Vance Risk Mgd Div.Eq Inc | (ETJ) | 9.89% | -3.15% | 1.00% | 1.76% | -0.76% | Equity/Option |
| Eaton Vance Tax Mgd Global Div | (EXG) | 9.08% | -6.00% | 0.81% | 1.26% | -0.45% | Equity/Option |
| Voya Global Equity Div | (IGD) | 11.45% | -8.53% | 0.57% | 0.00% | 0.57% | Equity/Option |
| New America Income | (HYB) | 7.73% | -12.05% | 0.33% | 0.00% | 0.33% | High Yield |
| Nuveen Real Estate Income | (JRS) | 7.27% | -7.03% | 0.28% | 0.28% | 0.00% | Real Estate |
| Barings Corporate Investor | (MCI) | 8.60% | 5.66% | 0.00% | 1.44% | -1.44% | High Yield |
| Invesco Senior Income | (VVR) | 5.89% | -10.83% | 0.00% | 1.27% | -1.27% | Bank Loan |
| Cohen & Steers Global Inome | (INB) | 9.28% | -10.84% | 0.00% | 0.41% | -0.41% | Equity/Option |
| Savvy Widow & Orphans Income Factory - 2019/First Quarter Results | |||
| Asset Class | Fund Name | Fund Symbol | YTD 2019 Total Return |
| Senior Loans | Ares Dynamic Credit Alloc | ARDC | 11.0% |
| Blackstone/GSO LS Credit | BGX | 14.1% | |
| Black Rock Debt Strategies | DSU | 12.6% | |
| Apollo Floating Rate | AFT | 6.9% | |
| TSL Credit Sr Loan | TSLF | 7.8% | |
| Nuveen Credit Strat Inc | JQC | 12.1% | |
| Eaton Vance Sr Float Rate | EFR | 6.5% | |
| Nuveen Sht Duration Credit | JSD | 12.7% | |
| Apollo Tactical Income | AIF | 10.6% | |
| High Yield | KKR Income Opportunities | KIO | 13.3% |
| Barings Glo Short Duration | BGH | 19.3% | |
| Pimco Dynamic Credit Inc | PCI | 15.0% | |
| Credit Suisse Asset Mgmt | CIK | 14.3% | |
| Black Rock Corp High Yield | HYT | 13.8% | |
| New America High Income | HYB | 14.4% | |
| Barings Corporate Invest | MCI | 4.5% | |
| Multi-Asset | Brookfield Real Assets | RA | 18.3% |
| Clough Global Opportunities | GLO | 21.8% | |
| Cohen & Steers CEF Oppty | FOF | 15.6% | |
| Calamos Strategic Total Ret | CSQ | 20.7% | |
| Black Rock Multi-Sector Inc | BIT | 12.4% | |
| Real Estate | Nuveen Real Estate Income | JRS | 25.8% |
| Cohen & Steers REIT & Pref | RNP | 18.5% | |
| Utility/Infrastructure | Cohen & Steers Infra | UTF | 27.2% |
| Reaves Utility Income | UTG | 16.6% | |
| Preferreds | JH Preferred Income III | HPS | 22.4% |
| Convertibles | Advent Claymore Conv & Inc | AVK | 21.8% |
| Equity | Sprott Focus Trust | FUND | 22.8% |
| EV Tax-Managed Div Equity | ETY | 15.6% | |
| Average | 15.5% | ||
Thanks to all my readers and especially my fellow contributors, whose research and support I could not do without.