This publication is sent with a heavy heart to all those who have been afflicted by COVID-19 thus far, understanding that we are likely just in the first few innings of a sharp recession and medical crisis. This experience should be a reminder of what is truly 'essential' in life, and we are proud of any small part we can contribute to a client's financial security so that he or she can focus on these essentials. It is for this reason we will continue to wake up each day with the goal of producing total returns above the benchmark, regardless of the environment.
In 2008, the Chilton REIT Composite produced a total return of -23.3% net of fees, which compared to the MSCI US REIT Index (Bloomberg: RMZ) at -38.0%. However, when the market bottomed and recovered in 2009, the Chilton REIT Composite produced a total return of +34.1% net of fees, which compared to +28.6% for the RMZ for the calendar year. We believe our process can outperform in multiple economic environments and are hopeful that we can continue the track record of our past successes.
From February 21 to March 31, 2020, the RMZ produced a total return of -31.6%, which compares to -22.4% for the S&P 500 (Bloomberg: SPX). From February 7, 2007, to March 6, 2009, the RMZ produced a total return of -73.9%, which compared to the S&P 500 at -50.6%. As we will explain below, the REIT market was very different in 2008. Most importantly, the REITs were not well capitalized, and dividend payout ratios were too high, which meant many were on the brink of bankruptcy, even if cash flows were holding up relatively well.
In 2020, REIT balance sheets are healthier than they have ever been, but near-term cash flows could be more at risk due primarily to rent deferrals across most core property sectors. In our opinion, the market reaction thus far has been too negative despite the uncertainty surrounding the economy and COVID-19. We believe the market is not giving REITs enough credit for their balance sheets, which will give them ample liquidity to survive a reasonable decline in cash flow. By several measures, REITs are more inexpensive today than they were in 2009, despite having much lower risk of bankruptcy. Therefore, we believe there is a unique opportunity to buy high quality commercial real estate at an unwarranted discount.
This Is Not 2008-2009 All Over Again
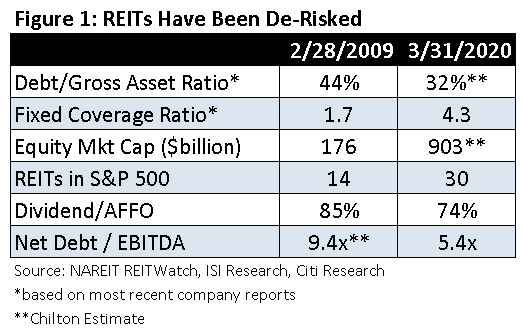
The painful lessons learned in 2008 for equity REITs have positioned them well for the current crisis. As shown in Figure 1, the margin of safety provided by the average REIT is completely different today. Most importantly, management teams of most REITs learned the perils of too much leverage, and many were forced into two major decisions that were not shareholder-friendly at the time: sell equity at dilutive prices to shore up finances, and/or cut the dividend. Importantly, with balance sheets in much better shape today with average debt to gross asset ratios of 32% and a weighted average debt maturity well over five years, we do not envision a repeat of the high number of dilutive equity offerings in order to 'save the company'. Dividend cuts to the degree seen in 2008 are unlikely, but certain sectors such as lodging and some retail are at risk. Many of the lodging names have already suspended dividends, and a few regional mall REITs have recently reduced payouts significantly. One REIT has instituted paying a portion of the dividends in stock, a tactic that was used by several REITs in 2008 to maintain the REIT payout rules while preserving cash.
The economic outlook is worsening by the day. Our biggest concerns are job losses, retail closures, and bankruptcies, and weakening demand for space. These conditions are much different than was the case in 2008-2009. Even then, REIT occupancy only fell to 91.8% (in 1Q2010), and same-store net operating income fell by less than 3% in the worst quarter (4Q09). While demand will likely fall further than in 2009, new supply should grind to a halt in all property types due to less capital availability, albeit with a 1-2 year lag.
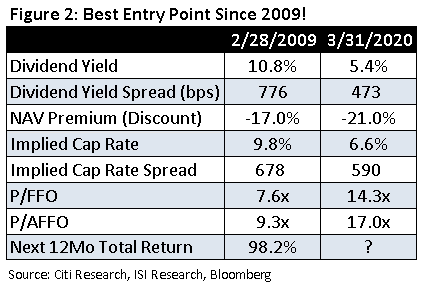
Despite a bleak economic outlook, the valuations today are attractive due to the solid balance sheets and low payout ratios. As shown in Figure 2, the lows in 2009 are near today's valuations despite the balance sheet enhancements. Note that the dividend yield spread versus the 10 yr Treasury yield has averaged 130 basis points (or bps) over the past 25 years, and the implied cap rate spread has averaged 360 bps.
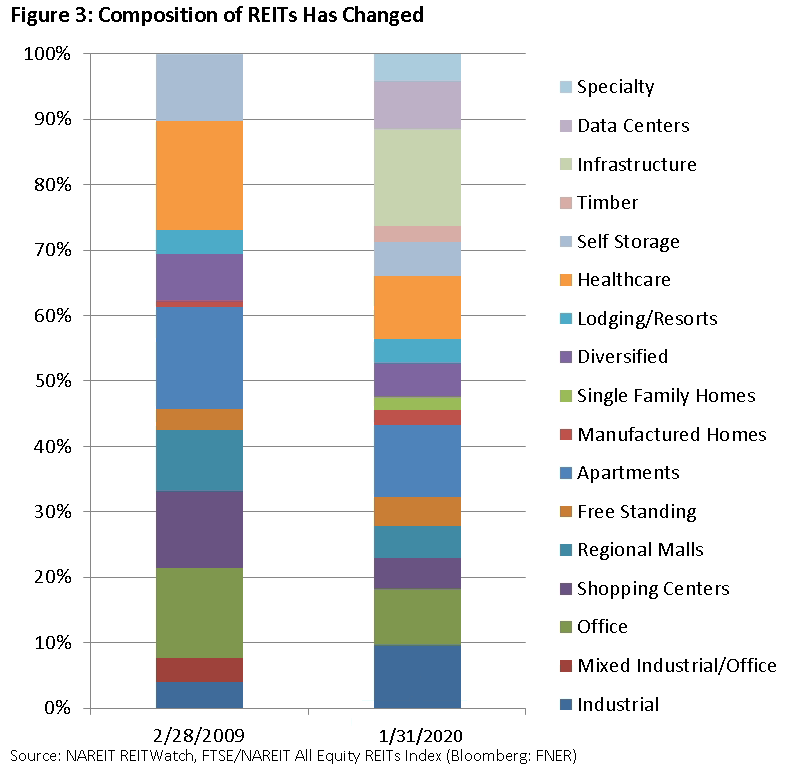
Furthermore, a comparison versus 2009 should be caveated with the fact that the REIT averages today are comprised of very different businesses. Traditional property types such as office, retail and apartments, only comprise 60% of the market capitalization in 2020 versus 100% in 2008. As shown in Figure 3, newer sectors such as cell towers (infrastructure) and data centers account for the balance and are much less susceptible to being hurt by current economic conditions.
All REITs Are Not Equal!
While we did not foresee the coronavirus causing a recession affecting all Americans, we entered 2020 with a portfolio that we believed could outperform in multiple economic scenarios. As we have articulated many times, all REITs are not equal. Therefore, our fundamental bottom-up research process has produced (and will continue to produce) a portfolio that is radically different than the index. The term 'active share' is used to describe how different a portfolio is from the index, with 100% being completely different and 0% being the exact same. As of March 31, 2020, the Chilton REIT Composite had an active share of 68% versus the MSCI US REIT Index. In comparison, the average active share for a real estate mutual fund according to Morningstar was 56% as of December 31, 2019.
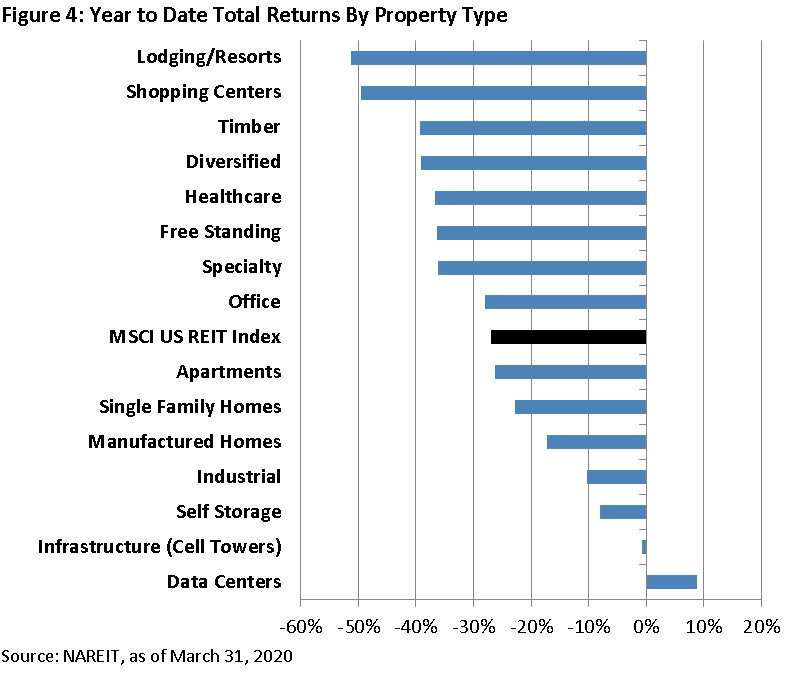
As shown in Figure 4, the performance of the 16 property types since the peak on February 21, 2020, through March 31, 2020, has varied dramatically. Even within these property types, performance has varied based on balance sheet strength, payout ratio, and development pipeline. In our opinion, this is the time that active management should be stressed in client portfolios, given the pitfalls of investing blindly in ETFs that hold positions that are slated to underperform. Not only can we position the portfolio away from stocks that are affected by the present conditions, but we can also take advantage of companies that we believe are safer than what the market has thus far decided. For example, the underperformance of office and only slight outperformance of residential does not reconcile with the research we have done on the durability of their cash flows.
Property Types That Should Outperform
The most durable property types are cell towers and data centers. Both should have no changes to near-term earnings due to COVID-19. Long term, this could be beneficial as any increase to working from outside of the office would necessitate investment in the cloud and stronger mobile networks.
Industrial, gaming, office, self storage, timber, single family residential, and multifamily residential will feel some short-term effects, but should recover back to 2019 levels fairly quickly relative to other property types.
Since gaming REITs have triple net leases with casino operators, they may have little to no effect on earnings provided the duration of this pandemic allows for a return to normal operations by the end of the summer. Even if they must remain closed and government stimulus funds available cannot help them endure, these properties are essential for their businesses and would likely be affirmed in the unlikely case of a bankruptcy.
Office REITs have long-term leases with high quality tenants; while we expect new leasing to fall below expectations, we expect current tenants to continue to pay rent unless they also file for bankruptcy, using it as a mechanism to downsize and/or close operations. Energy markets such as Houston carry additional bankruptcy risk to the decline in oil prices, which will have a much longer lasting effect on demand. As of March 30, 2020, the Chilton REIT Composite has approximately 0.1% exposure to the Houston office market.
Industrial properties will have some fallout from industries that are dependent upon a strong economy. However, the e-commerce secular trend will likely gain steam from a 'stay at home' order. Additionally, the pitfalls of the 'just in time' supply chain has demonstrated just how little protection exists when the economy suffers such a disruption. We believe this will lead to a comprehensive review and subsequent investment in logistics real estate, potentially at the expense of brick-and-mortar retail.
We believe residential will be resilient, as it was in 2008-2009, and has traditionally been in natural disasters, the only precedent we have for the current scenario. We acknowledge that bad debt (missed lease payments) will reach an unprecedented level, but believe that the tenancy of such high quality apartments and single family residences will make rent a priority. Therefore, net operating income, after falling in 2020, should regain 2019 levels much sooner than those property types that are mentioned below as the most vulnerable. The apartment REITs we own have implemented several policies such as flat renewal rental rates, payment plans for deferred rent, and a grace period for evictions. This will be somewhat offset by lower turnover, leading to less vacant days and lower capital expenditures.
Self storage may have fallout from not being able to push rents, and the property type is also suffering from a supply problem. However, the relocation of students back to their parents' homes has helped to fill up vacant units that may not have otherwise been filled until the summer. At the same time, people will be less likely to move their items out of a storage unit under the current shelter rules.
Timber REITs are dependent upon the single family construction market, which will certainly take a hit in a recession. However, a large part of the business is selling pulp, which can be used for cardboard boxes and toilet paper, which as we have seen is going to be a strong market. We believe new home starts will rebound rather quickly when we emerge from the recession driven by potentially falling construction costs, which will help these companies to get back to 2019 earnings level faster than most other property types. In the meantime, the trees will continue to grow and increase in value!
Property Types That Should Underperform
Regional malls, shopping centers, triple net, lodging, and healthcare will have a more pronounced near term and potentially long term negative effect from this recession.
Healthcare's underperformance in a 'risk-off' scenario is a new phenomenon due to the unique aspects of COVID-19. In fact, healthcare was among the best performing property types in the past two recessions! In this case, however, senior housing, a large component of the sector, is going to be one of the hardest hit. Already, the annual flu season can be detrimental due to fatalities among tenants. As COVID-19 mortality rates are highest in the 70+ age group, this is going to be much worse.
Furthermore, the demand to fill vacancies will likely fall during this period and potentially longer term from the desire to stop the spread to loved ones. With lower revenues and spiking operating expenses due to the premiums having to be paid for labor, earnings will fall sharply and take an extended period to recover.
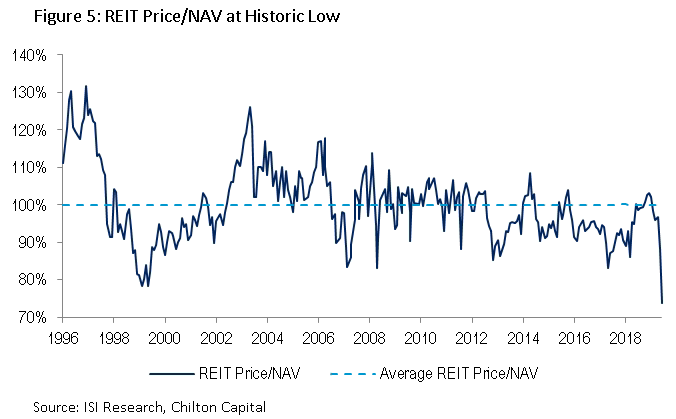
This sector also has been hit extremely hard because it was trading at a 24% premium to net asset value (or NAV) on February 21, which compared to the REIT average of 2%. The change in the healthcare and triple net NAV premium to a discount has been a huge contributor to the decline in the overall REIT price/NAV, which has declined from 103% to 74% in a month (see Figure 5).
Regional malls and shopping centers will be negatively affected from their tenants not being able to operate their stores. One of the bright spots for the malls has been the healthy demand from 'experiential' tenancy such as restaurants, cinemas, and fitness concepts that have filled many vacant department stores. Many retailers are now closed and will not pay rent, and we believe many retailers will end up having to declare bankruptcy due to this recession to reorganize. A number of them will simply never reopen! As a result, many highly leveraged private landlords may also have to declare bankruptcy, causing a drop in market rents nationwide.
Lodging is going to have a similarly negative experience, as travel has come to a standstill around the world. Many private owners will have to declare bankruptcy, but we believe most REITs are capitalized well enough to make it through. When the world does decide to travel again, we believe there will be some pent-up demand, resulting in a pronounced upward move in stocks and earnings.
For triple net companies, which mostly lease freestanding buildings to retailers, we are also expecting bankruptcies due to closures, particularly in portfolios with a high concentration in restaurants. There could also be lasting issues mostly due to the lack of a cost of capital advantage which has historically fueled accretive acquisitions. Without acquisitions, most of these companies will have zero to negative earnings growth.
What We Don't Know
We are not doctors. And our research has only shown us that many doctors aren't sure how long this will last. Much will depend on how the country responds, both by the people and the government. Our society continues to learn more about the novel coronavirus on a daily basis. However, it is important to acknowledge what we do not know about COVID-19 as we assess investment opportunities. The main areas of uncertainty are:
- Severity and duration of domestic and international spread
- Governmental response (i.e. school and business closures, potential quarantines, etc.)
- Further fiscal and monetary policy initiatives
- Real economic impact on jobs
- Lasting societal effects and permanent behavioral changes
In addition to the short-term uncertainties in global health community and the economy, there is also a long-term question of what are the lasting impacts and changes to society? Since the majority of a business' value is determined by the cash flow stream beyond the current year, this is a critical question to answer as we continue through and come out of this uncertain period.
What We Do Know
As of March 30, we know that globally there have been over 838,000 confirmed cases, over 41,000 deaths, and over 175,000 recoveries according to the Center for Systems Science and Engineering at Johns Hopkins University. In the US, there have been 177,000 confirmed cases, 3,400 deaths, and 6,000 recoveries as of the same date.
Since there is no vaccine or pharmaceutical treatment for COVID-19, authorities and experts have deemed spread prevention as the best way to fight the virus, or 'breaking the curve'. Therefore, international travel from Europe to the United States was banned on March 11. In addition, large municipalities are beginning to impose ordinances limiting social gatherings and business operations, with many enforcing a 'shelter in place'. On March 26, the Senate passed the CARES Act, which provides a $2 trillion stimulus to help individuals and businesses that are suffering due to the pandemic, while also providing aid to the healthcare sector that is struggling to cope with the infected.
Additionally, the Federal Reserve has taken significant actions to keep markets liquid and functioning. On March 3, the Fed cut the Fed Funds rate by 0.5% to a range of 1.0%-1.5%. Then, on March 15, the Fed went all in and lowered the overnight lending rate by 1% to a range of 0%-0.25%. Furthermore, the Fed will use its balance sheet to increase its holdings of Treasury securities by at least $500 billion and agency mortgage-backed securities by more than $200 billion in order to keep a steady flow of credit to households and businesses. If one thing is clear, it is that both the Fed and the government are stepping in with drastic measures to support the economy.
Balancing Risk With Opportunity
We believe that the market has underappreciated the strength of REIT balance sheets and the durability of their cash flows. Furthermore, our analysis has, and should continue to, isolate attractive relative investment opportunities from further mispricing of risk within the REIT sector. We can't be sure when the market will properly recognize these attributes, but we believe our portfolio is positioned to outperform over the long term. As Benjamin Graham said,
"The market is voting machine in the short run, but a weighing machine in the long run."