This article is meant to serve as a continuation in my coverage of the four pure-play private mortgage insurance companies, MGIC Investment Corp (MTG), Radian Group (RDN), Essent Group (ESNT), and NMI Holdings (NMIH). Since the publication of my first article on May 12th, the stocks have returned roughly 29%, 11%, 36%, and 31% respectively though June 17th versus a 8.5% return for the S&P 500, and I still believe that all of these stocks still have significant upside. My previous articles would serve as a good introduction for those who are interested and are linked here: Mortgage Insurers: Market's Misunderstanding Creates Significant Opportunity, and here: Quantifying The Private Mortgage Insurers' Significant Upside And Comparing The Firms
Evolution of Residential Mortgage Forbearance Rates
As we continue to progress through the COVID-19 initiated recession, I continue to be encouraged by the data that has continued to trickle in. The below table displays weekly data from the Mortgage Bankers Association (MBA) on total mortgage loans in forbearance since the CARES act was put into place in early March. They began reporting this figure for Fannie Mae/Freddie Mac as well in the back half of May.
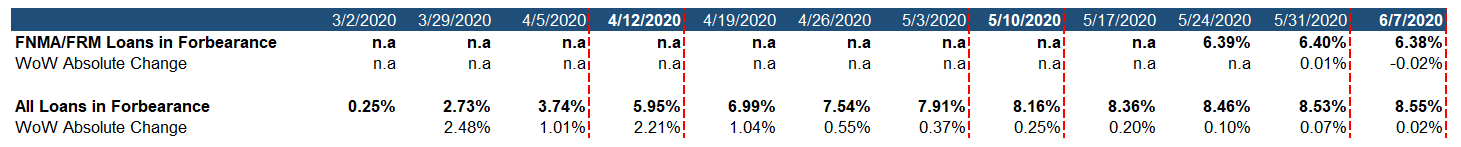
Source: MBA Weekly Reports
As can be seen, the growth in new forbearance requests significantly slowed from April forward. Whats more is that the GSEs actually reported a decrease in their share of loans in forbearance as of the latest week ending June 7th, an encouraging sign that we have hopefully reached the peak in forbearances.
Another crucial piece of information was Black Knight's latest mortgage monitor report which was released June 8th. While the report contained a large amount of important data points, I had a few key takeaways.
First:
While 46% of homeowners in forbearance as of April 30 made their April mortgage payments, just 22% of those in forbearance as of May 26 have made their May payments, signaling a likely rise in the national delinquency rate
This in important point in trying to project default rates that the PMIs will be reporting given a borrower must miss at least two consecutive payments to be considered as "in default".
Second:
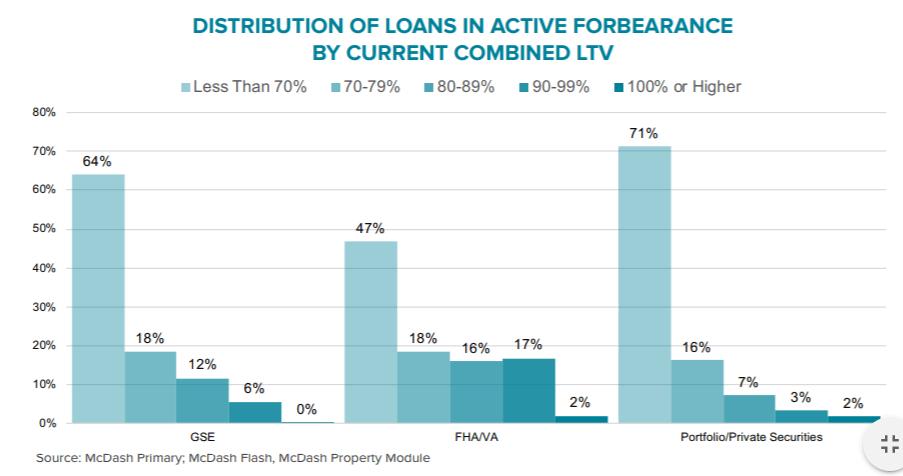
Source: Black Knight Mortgage Monitor
This chart gives us another critical piece of information. Of the total amount of GSE loans in forbearance, 12% of them have a LTV between 80-89% and 6% of them have a LTV between 90-99%. Given stable housing prices, we can assume that the combination of these two populations (18% of their total) should likely be loans which carry mortgage insurance given an LTV at or above 80%.
With all of this information, we can attempt to approximate the default rates that the PMIs are likely to be experiencing as of the end of May. First I'll take the MBA's FNMA/FRE total percantage of loans in forbearance (6.4%) and multiply by the share with LTVs at/above 80% (18%) to arrive at the total PMI population of loans in forbearance, which would be 1.15%. Then I'll assume that per Black Knight's data, a borrower who missed April's payment will also have missed May's payment, so I will assume 54% of this population has missed at least two payments. This would give me default rate at the end of May of 0.62% (6.4% x 18% x 54%). Conveniently, NMI Holdings has begun reporting their default rates on a monthly basis. And as it turns out, my estimate is spot on with their reported May default rate of 0.61%.
NMIH reported loans in default:
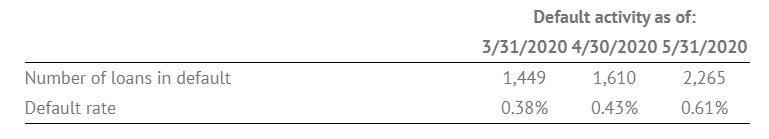
Source: NMIH Monthly Operating Report
This gives me a level of comfort that I'm on the right track in trying to extrapolate default rates for the PMIs based on these various data sources. Now we can think about what this could mean going forward.
Given Black Knight saw an increase in missed payments for loans in forbearance from 54% to 78%, I think it is safe to assume that June will see an increase in default rates for the PMIs. If I use 78% in our previous calculation, I arrive at a June 30th default rate of 0.90%. If we assume the worst case that everyone under forbearance stops paying, we get to 1.15%. The PMIs would easily be able to handle default rates in this range and its likely that a majority of them would eventually be cured when borrowers exit forbearance.
In summary, as the data trickles in, we have strong reason to believe the PMIs can easily handle defaults and eventual claims payments from this downturn. If we see significant decreases in new unemployment claims, this would also give me added comfort. It is also critical that the housing market continues to stay strong and that we do not begin to see threats of declining housing prices.
Update to Price Targets
My previous article went through a valuation exercise for our four PMIs and I would encourage the reader to take a look at the article for further background on the below table. I am now using sell-side FY 2021 revenue estimates and applying them against my updated claim payout rates. I am now assuming peak default rates of 1.1% and cure rates of 40%, 60%, and 80% under the bear, base, and bull case respectively. The key to this valuation is attempting to estimate the impact to book value of equity from claims payouts. The price targets can be thought of as my 12 month targets.
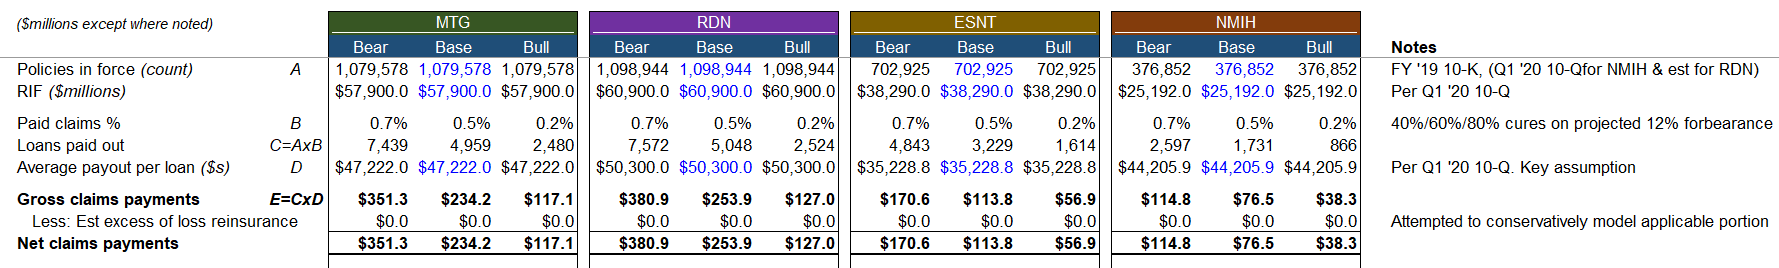
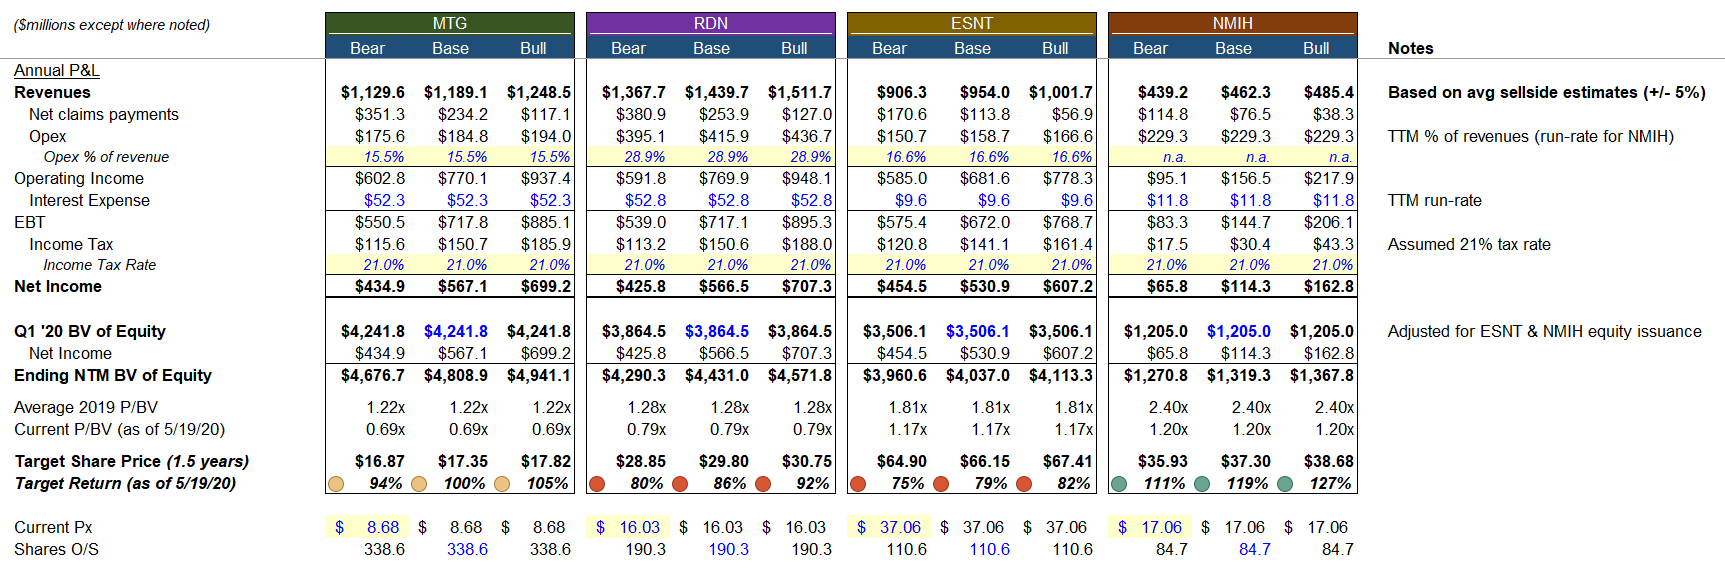
These figures would suggest that the PMIs should continue to have +75% upside over the next 12 months if defaults and claims rates come in as I am outlining. An alternative way to think about this is that if the PMIs guide towards sub 1% claims payments with insignificant impacts to earnings, its reasonable to expect that these stocks should be back to their 2019 highs within a 12-month time frame.
My target prices are a fair amount higher than the average sell-side estimates and are closer to the most bullish analyst price targets, but the sell-side estimates were also largely updated after Q1 earnings announcements and are likely not yet incorporating the latest clarity on default rates which I would expect to be highlighted in Q2 earnings calls.