Investment Thesis
Orange SA is a low-risk bond proxy, offering a market-beating 8% rate of return. It has possible upside from operations in Africa and ventures into Content, e-Health and Cybersecurity.
Introduction
I run a quite concentrated portfolio, preferring to deploy capital into whatever obvious (I'm not the brightest, so they have to be!) opportunities there are and diversifying over time. Europe is more attractive in market valuation (implying easier to find opportunity) and allows me to reduce exposure to the dollar.
Telecoms are essential to everyday life, something that has been highlighted over the past year. However, a lot of them haven't recovered from their March lows despite offering excellent yields in a low yield world and having shown resiliency in their operating and financial results.
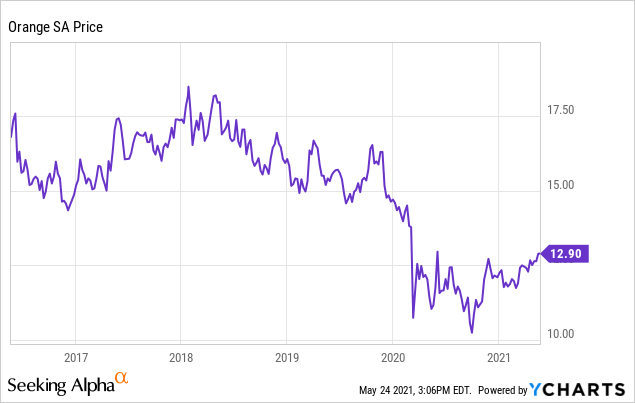
Figure 1 - 5-yr stock chart
Orange (NYSE:ORAN) stood out on all the market screeners with its big shining yield, low P/E and P/B ratios. However, as I researched the company I was surprised by the number of innovations and the market presence in Africa – the next frontier of growth. This would be an impressive yield if being "paid to wait" with a call option on significant growth, however, that requires business stability as these businesses develop and the market matures.
Business Summary
Orange is the 11th largest telecom in the world by subscriber count and the third-largest in Europe. Whilst its origins are in France (23% ownership by French Government) it has a telecoms presence in over 26 countries and operations in over 200.
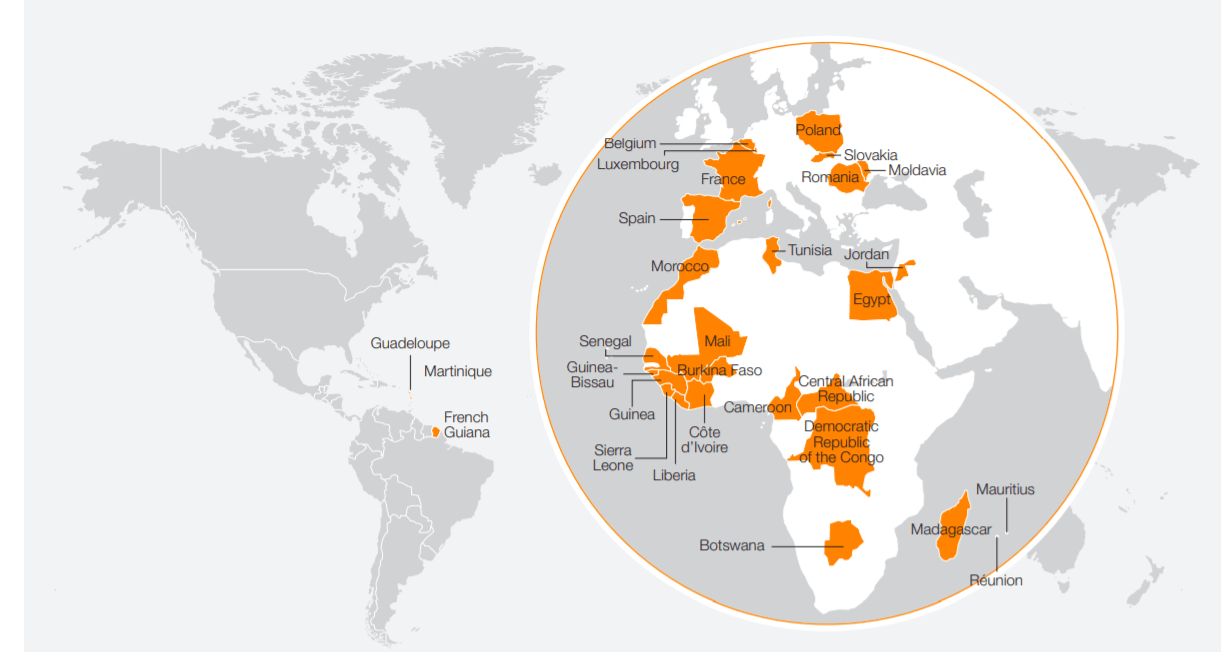
Figure 2 - Main operating countries - Universal Registration Document 2020
It splits its operations into Networks, Financial Services, Cybersecurity, Business Services, Health and Content. However, its actual organisational and financial structure is actually quite "interconnected".
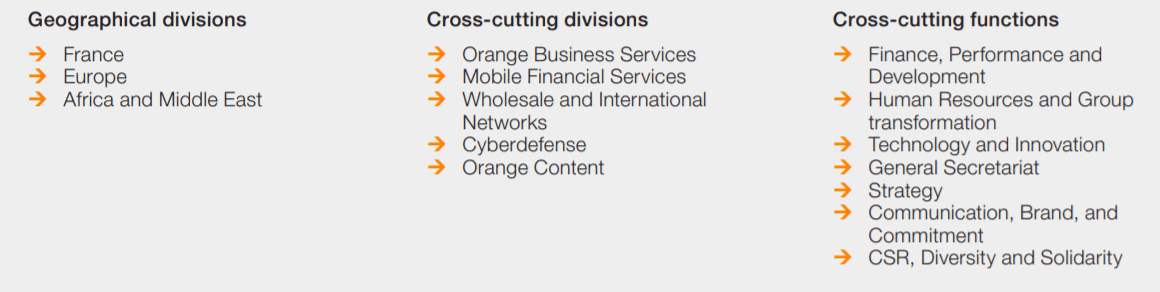
Figure 3 - Orange groups structure - Universal Registration Document 2020
As you can see it is cut and sliced in various ways, this has made it a little bit harder to understand but shouldn't impact the company operationally (except through implied bureaucracy).
Qualitative
In an attempt to structure my qualitative research I focus information within key areas. These areas are then each given a subjective mark, by yours truly, to help me quantify the quality of the company as an input to valuation.
The main sections are Business and Management. Business evaluates the industries of operation and the company's product/position in each market. Management assesses the demonstrated & implied competence of management and how aligned they are with the shareholders.
Business
Industry
Networks are really quiet a simple business, own the infrastructure charge people for using it, upgrade the network with new technology keeping regulators and customers just happy enough. Rinse and repeat. The revenue is highly visible (monopolistic), the moat is near absolute between technology cycles (prohibitively expensive to overlay cables or build towers in saturated areas) and the service is now essential. As such they simply throw off cash.
So, we have to ask, why are they not priced at a premium? Why do they offer such fantastic yields? For me, this comes down to debt (discussed later), CAPEX, regulation and asset allocation.
We are currently, going through one of the largest ever CAPEX cycles for networks. Copper cables are being replaced by fibre. 5G is replacing 4G. All of this requires new technology that must be integrated into the networks.
BCG estimates that overall investments of €300 billion by 2025 are necessary to achieve both gigabit speeds and realize the full 5G vision in Europe. About €150 billion will be necessary to achieve broadband speeds of 1Gbit and faster across Europe via fiber to the home or office (FTTX) and 5G FWA. Massive growth in wireless data traffic, especially as the IoT ramps up, will mandate an additional €150 billion to build the infrastructure to enable the full 5G vision. - BGC Analysis
European telecoms have been a dreadful investment for years. The disparity between American and European telecoms is drastic. The regulatory environment seems to penalise the large incumbents and subsidise smaller players to "get the best deal for the customer". This has to lead to a fragmented market with many players each competing not only for customers but also for spectrum. As such costs have increased whilst revenue has stagnated and has been regulated to protect the customer. Seems like quite the poison chalice for investors.
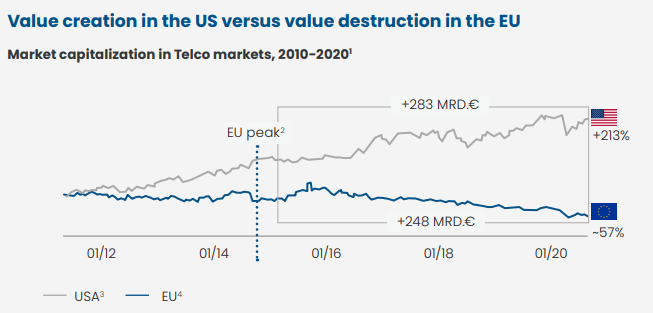
Figure 4 - EU Telecoms Total Shareholder Return - BGC Analysis
Regulation in Europe can make it incredibly difficult to scale due to competition management and even build assets such as cell towers due to bureaucracy. Whilst the industry does attempt to put pressure on governments to change this, it will likely be an arduous process.
Asset allocation in the telecoms industry has been "sub-par". Value destruction by attempting to inorganically purchase content and investments that have failed to grow the top-line. Investors, therefore, rightly have lost confidence in management ability.

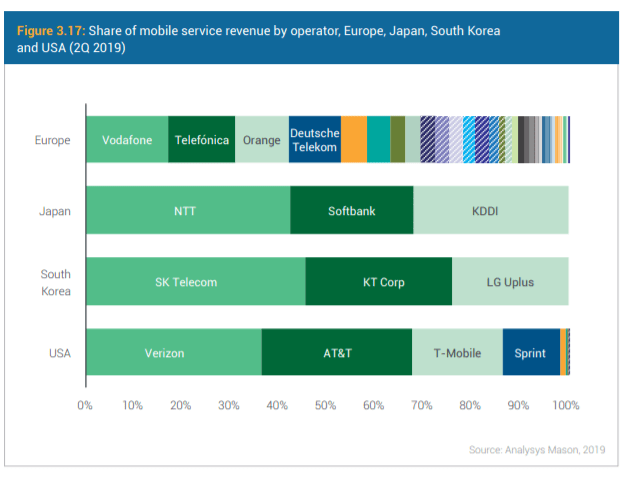
Figure 5.1 - No. of network providers per region - Delta Partners Group
Figure 5.2 - Revenue by Operator in different regions - ETNO
Clearly, Europe suffers from a lack of consolidation. It has 2 times more operators per billion people than America and nearly 15x that of Asia. Consolidation will be key as this level of fragmentation leads to a lack of profitability. This decreases the level of investment and reduces product quality. As such a large market share for the company in each region is vital.
Product/Position
Network operators (TNOs) have a circular relationship with GDP. They contribute significantly to it and they are heavily reliant on GDP growth for their own growth. Another key (high-level) metric is market-share, representing the % of value captured by the company in that region. Scale also leads to greater efficiencies and therefore greater profitability. The table below uses the IMF's 5-yr GDP growth projections, the current % of Orange's revenues and the current market share in both mobile and broadband.
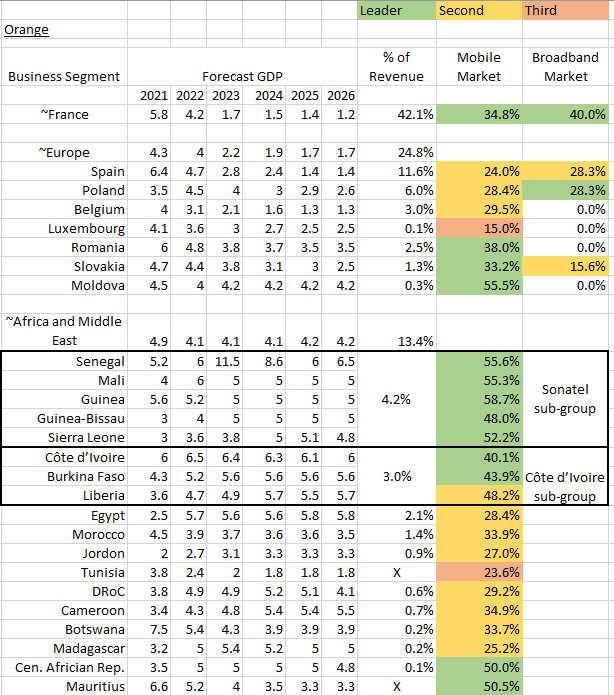
Figure 6 - Regions of operation growth and dominance - Authors table using IMF data and Universal Registration Document
Clearly, the most dominant markets affecting revenue are not expected to see significant growth. Also, market share in these regions is unlikely to increase significantly due to high levels of competition. However, some of the other regions in Europe expect growth and market share may still increase against these smaller/more regional players.
Clearly, GDP growth in Africa is larger and Orange has high levels of market share and dominance in the region. These regions are only 13.4% of current revenues, so both the rewards of these networks and the volatility are minimised. However, if they can maintain market share in their low growth markets whilst enjoying the emerging markets' growth, then the networks segment may return to growth. The issue is that subscriber growth may not lead to proportional revenue growth due to low ARPU (Average Revenue Per User). More on that later.
25,000 of the European sites (40,000 total) are being separated into a TowerCo called TOTEM and will be allowed to operate independently. The amount of Towers transferred to this company is low and has disappointed many. Unlike other Telecoms they seem to be adamant about retaining control of the towers instead of spinning it off/selling it at currently favourable valuations. An interesting decision to make...
I use mobile banking approximately 99% of the time. Orange Bank intends to be the default service of this function for all of its customers.
Relying heavily on telecom functions, Orange Bank’s innovations offer customers the ability to make contactless payments with credit cards or via mobile handsets, immediate access to their bank account balance, temporary blocking and unblocking of their credit card from the application, and to request and send money by text message. Universal Registration Doc.
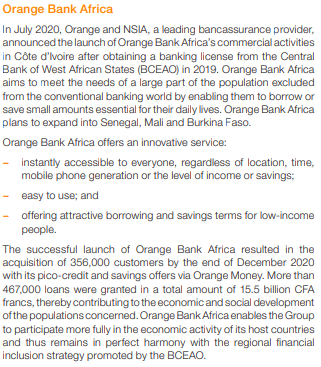
Figure 7 - Orange Africa -Universal Registration Document
Whilst it may well be a success in Europe, I believe that Africa is a much more fertile ground for this type of activity. Whilst there are other services in the region, Orange has the benefit of being able to offer air-time as incentives. This pre-paid airtime is already used in this way sometimes! The average ROE for African banks fell by 50% from 14% in 2019 to 7% in 2020, this is expected to recover. This could become a strong growth driver utilising the dominant market position that Orange has in many countries.
Orange is also investing in areas such as Telehealth and Content, however, along with banking, I see this as being outside of the core competency of the business. Due to my uncertainty, I won't be valuing this section as I would not be willing to rely on it.
Management
I feel like most discussions about management quality can fall into two categories: Competence and Alignment to Shareholder Interests.
Competence
This can be difficult to measure. We will be looking at Glassdoor ranking, some personal information on the CEO and a look at return metrics and debt levels as an indicator of management ability.
Glassdoor often offers a good insight into the management and business perception of Employees.
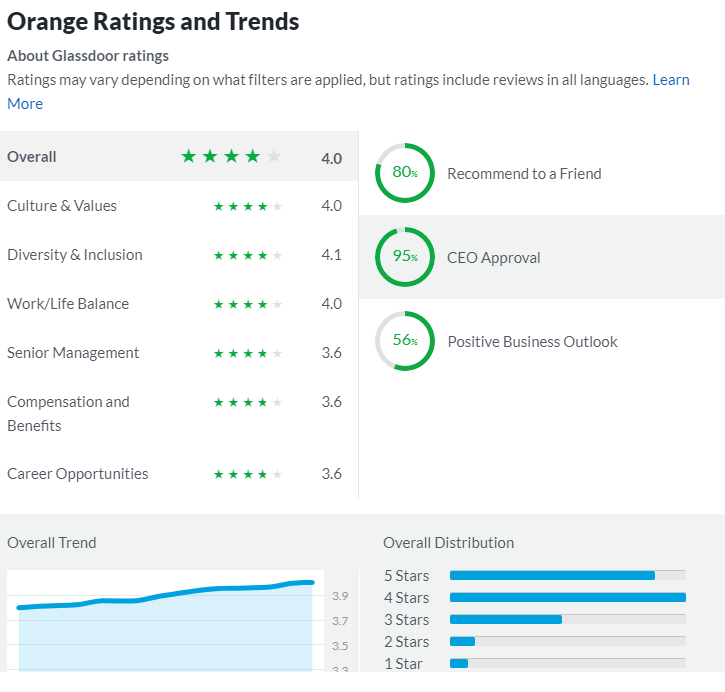
Figure - 8 - Glassdoor Summary - Glassdoor
The CEO approval metric is definitely an above-average rating and senior management approval is probably average. The positive business outlook is balanced but not as positive as I would prefer.
Stéphane Richard has been CEO for approximately 10 years and is a bit of a mixed bag. I came across a book he has written based on providing internet access for all/reducing digital inequality. Also, from 2007 until 2009 he was Chief of Staff to Christine Lagarde, then French Minister for the Economy, Industry, and Employment. All of which is quite impressive. He has been involved in a long-running fraud case but this was dismissed in 2019. Not the kind of attention that you want a CEO to bring to the company. In any event, he seems to have good political intelligence (required in France, with government ownership stake) and genuinely committed to reducing digital inequality.
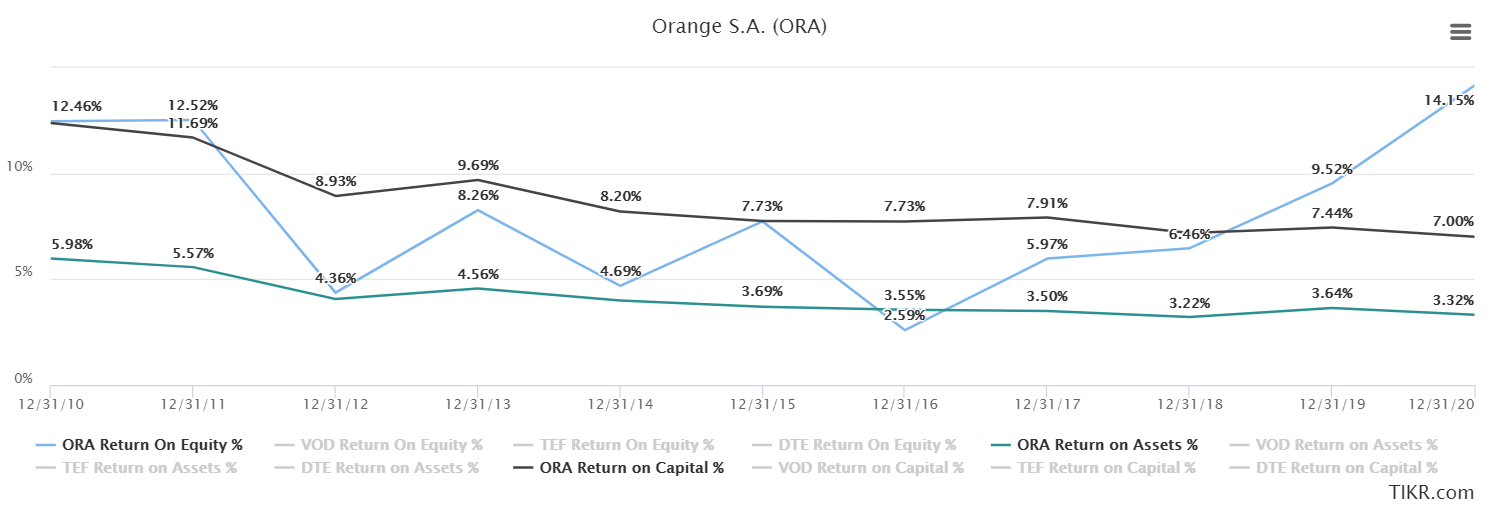
Figure 8 - Historical ROE, ROA and ROIC - TIKR
ROE has been sporadic but has only recently increased above 10%, the lack of consistency is not abnormal due to sales cycles. ROIC & ROA have been steadily decreasing to a number that is actually below the current dividend yield. As such share buybacks might be a good use of capital. A factor to mitigate this may be the long investment cycles that Telecoms go through where current investments may take years to become fully profitable. However, I am impressed as they haven't further levered up in an attempt to artificially improve/distort these numbers. A sign of prudent management as these numbers are reasonable in the industry.
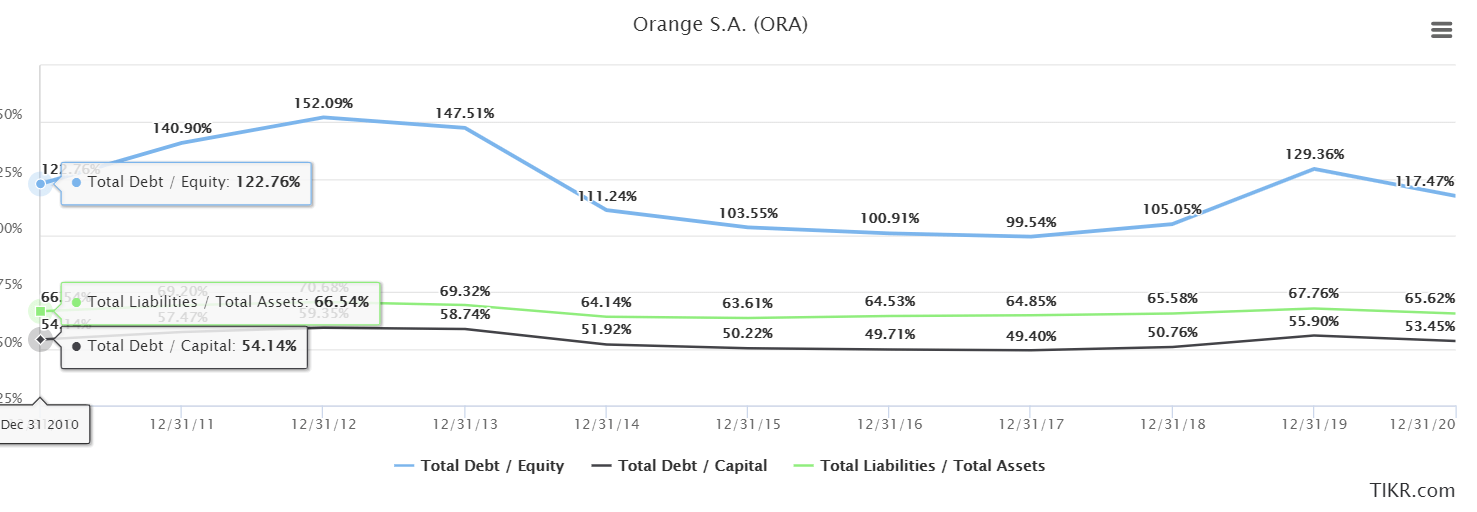
Figure 9 - D/E , D/C and L/A - TIKR
Alignment
Alignment can come in many different shapes. Metrics like insider ownership and buying, coupled with stated incentives and compensation packages can provide a firm base. Other attributes can also be attractive in this area. For example, employees who have worked their way to a top management position or company founders who are often long-term thinkers dedicated to the company.
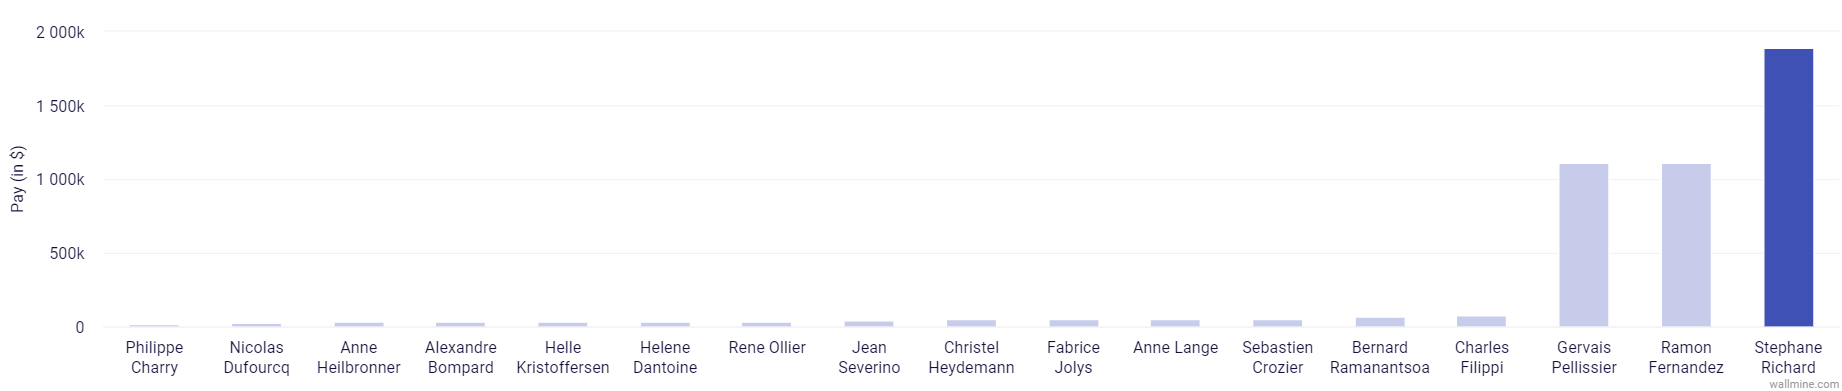
Figure 10 - Insider Compensation - Wallmine
I hate seeing this disparity in compensation, especially as performance has not been of any great quality. S. Richard and R. Fernandez have entered the company from working within the French government. However, G. Pellissier has been with the company for quite some time. This is also disappointing as I prefer to see people who have worked their way up through the industry.
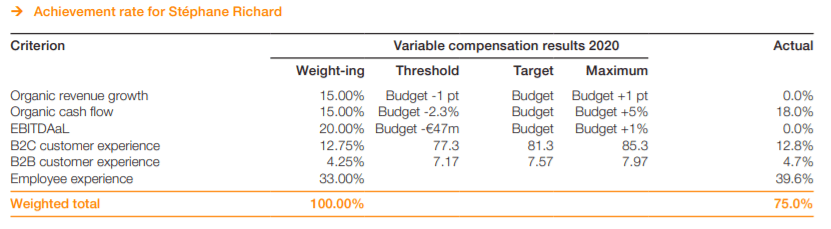
Figure 11 - Stéphane Richard Incentives - Universal Reg. Doc.
Clearly, the directors largest incentives are in non-shareholder experience. Employee and customer experience totals 50%, with operating efficiency metrics at 35% and revenue growth at 15%. Not aligned with rewarding shareholders. Considering this, we at least hope for high insider ownership, we would be disappointed.
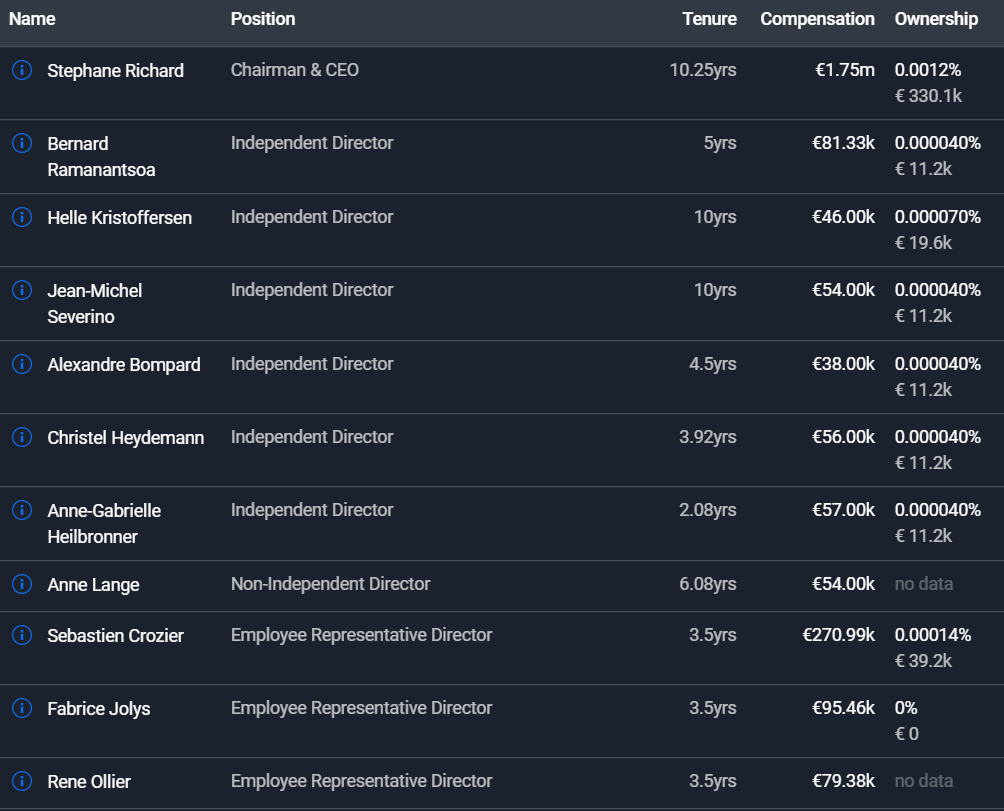
Figure 12 - Insider Ownership - Simplywallst
However, 6% of the company is owned by its employees and 23% by the French State. The employees have 3 board positions and therefore would (hopefully) want good performance for shareholders. Similarly, this is true for the French government.
Summary
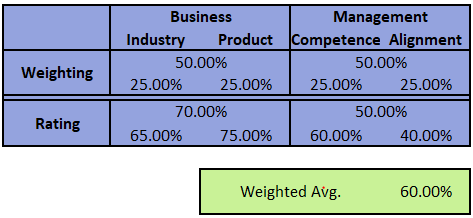
Figure 13 - Qualitative to Quantitative
Figure 13 is a quantitative representation of the qualitative information discussed above. I believe that the Telecoms industry is above average. It will have increased usage and criticality but Europe is a tough place to operate. Orange is the leading operator in most of its regions, which are predominantly developed and safe countries. Management alignment is low with below standard incentives and tragic insider ownership.
Quantitative
This section focuses on the balance sheet and KPIs.
As seen in figure 9 the leverage of the business has remained reasonable for many years. In terms of long-term solvency, it seems strong with investment-grade credit ratings and good metrics.
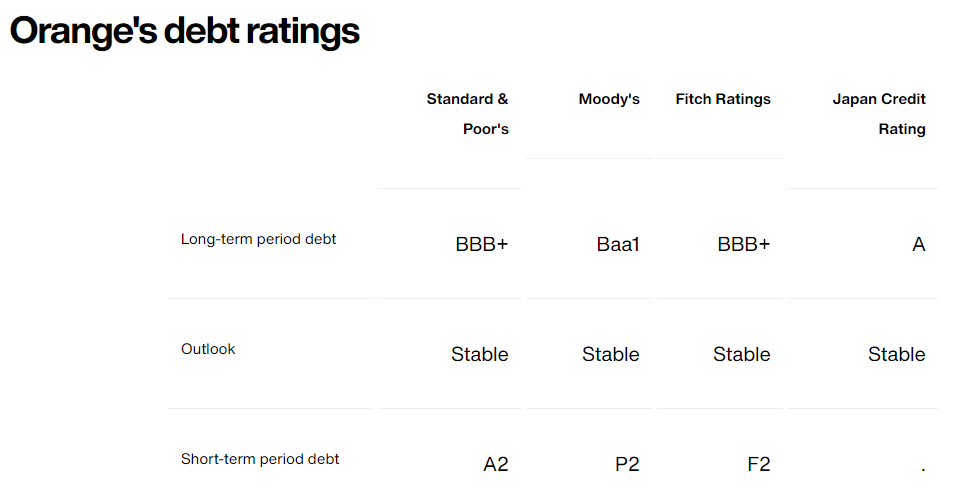
Figure 14 - Credit Rating - Orange Debt Rating
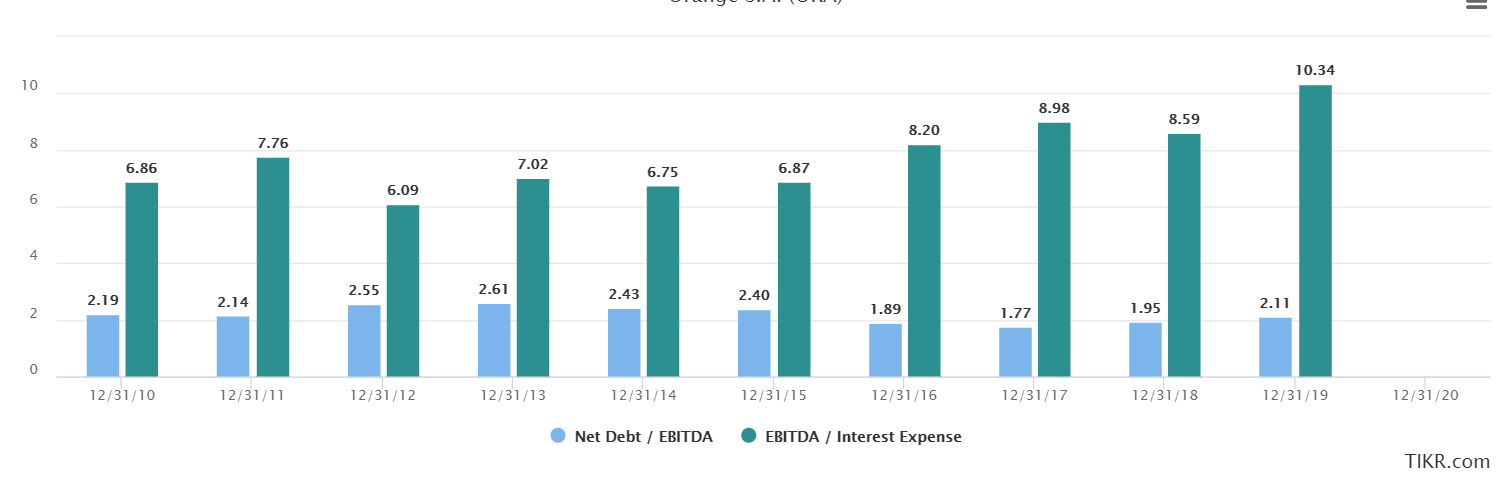
Figure 15 - Solvency Metrics - TIKR
However, short term liquidity has been consistently lacking. This is currently manageable as interest rates are so low and it is warped by the high levels of CAPEX that have occurred during the investment cycle. However, this situation must improve as the CAPEX level decreases.
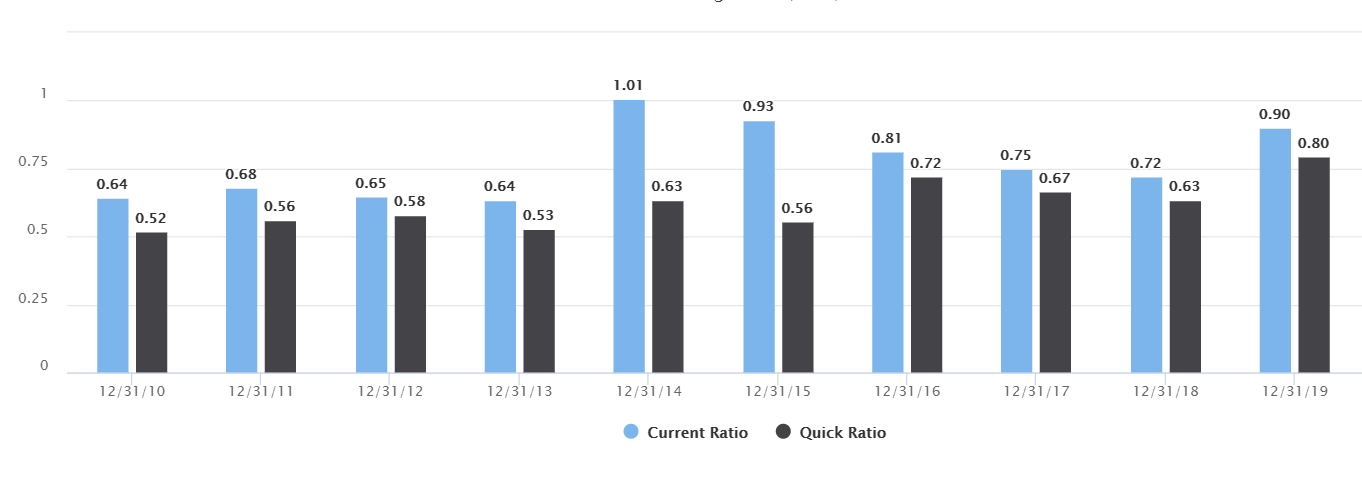
Figure 16 - Current & Quick Ratio - TIKR
As of Q1 2021 KPIs, the company has over 50.4 million connectable FTTH (Fibre To The Home) and cable homes that are connectable. Yet, there are only 5 million customers on these plans in France and only 10.2m in total. While the company intends to grow their total homes connectable to 65 million, the current utilisation appears incredibly low. Only once these homes connect will they contribute to ROI.
As Orange expands its operations in Africa there is an excellent opportunity to increase its subscriber count. Technologically many people are "leapfrogging" older generation technology in Africa. The subscriber increase opens up new revenue opportunities, however, the Average Revenue per User (ARPU) will limit this.
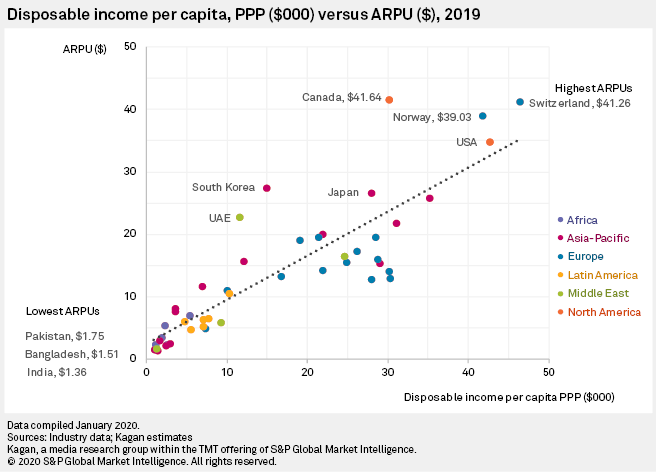
Figure 17 - ARPU per country - S&P Global
ARPU is highly correlated with disposable income which is correlated to GDP. As such, the current low levels of disposable income in Africa means that there is little revenue to be gained. However, as GDP grows, disposable income should also increase enabling a higher ARPU. Coming off such a low base this has the potential to cause a disproportionate increase in revenue.
Spectrum costs are globally eye-watering. With the USA coming out close to the top but with most European countries filling up the rest of the list.
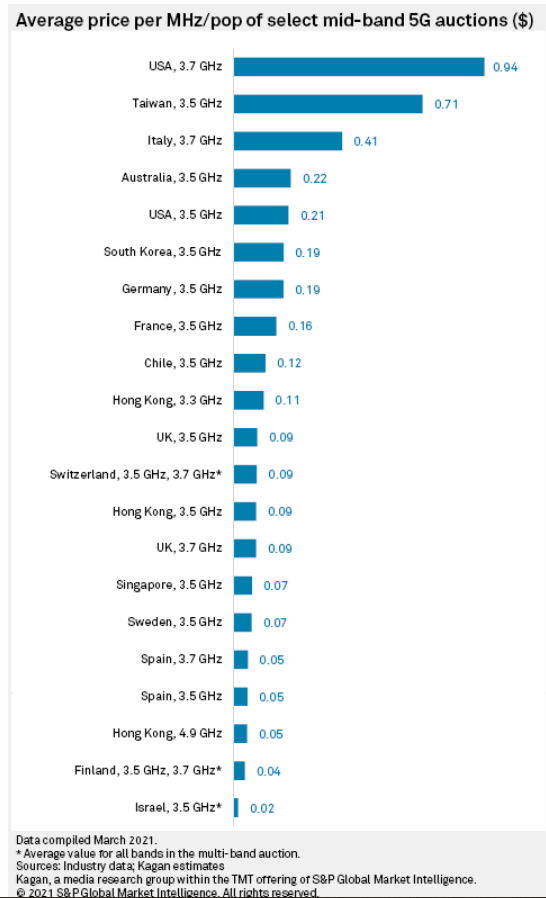
Figure 18 - Cost of the spectrum - S&P Global
Valuation
Orange provides 5-year analysis consensus estimates on its financial performance. The tables below contain the inputs to my valuation model and the sources of the data.
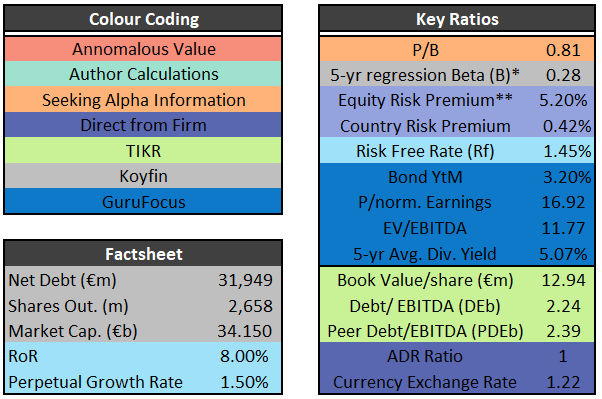
Figure 19 - Factsheet - Authors
Instead of using the typical market beta, here we have used the industry average beta then re-levered it.
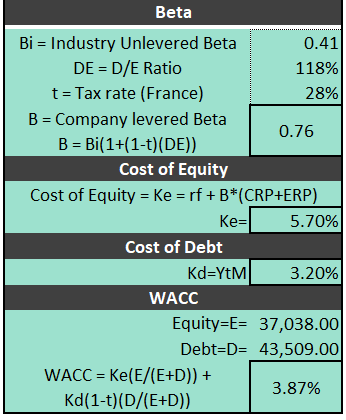
Figure 20 - Costs of debt/equity and WACC - Author
This is a much more accurate way to measure the market risk. Dividends will be the main method of reward for shareholders rather than buybacks and growth. As such Dividend Discount Model (DDM) has been used here for valuation. An extra €0.2 per share has been declared due to a legal settlement.
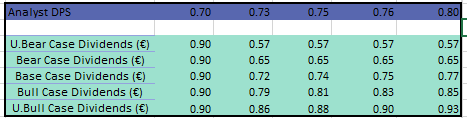
Figure 21 - Dividends per share used in DDM
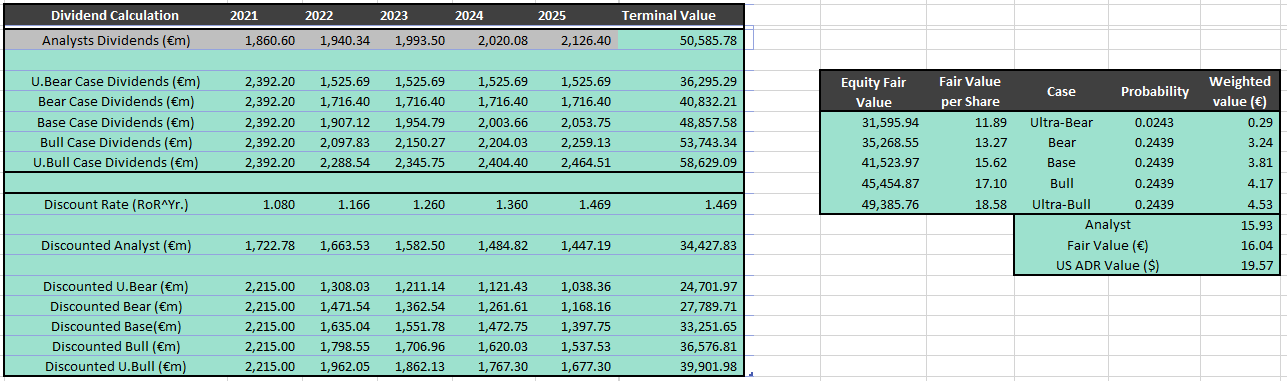
Figure 22 - Case Weighted DDM
DPS cash flows have been taken to a total business level. Terminal value has then been either calculated used terminal growth rate or using 80% of the current book value, to be as conservative as possible.
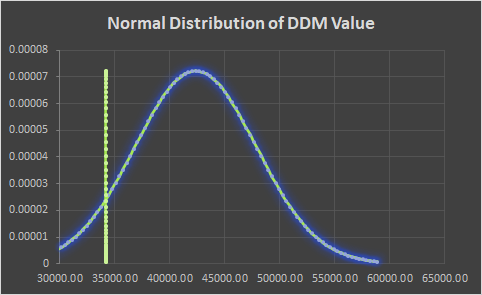
Figure 23 - Normal distribution of case values vs market value
As such it looks significantly undervalued and is can be seen as low risk due to its tight range of calculated values. The market is currently offering a significantly higher rate of return than that of its cost of equity.
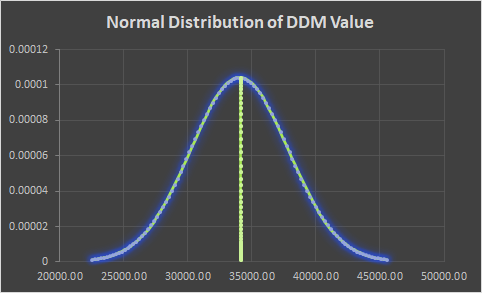
Figure 24 - Rate of Return at 8%
This seems incredibly attractive! With an upside using a historical cost of equity of at least 50%!
Orange is currently trading at 80% of book value and offering a market-beating 8% RoR and is significantly discounted to its history. Backing this up is its relative position to its peers where it also appears to be undervalued.
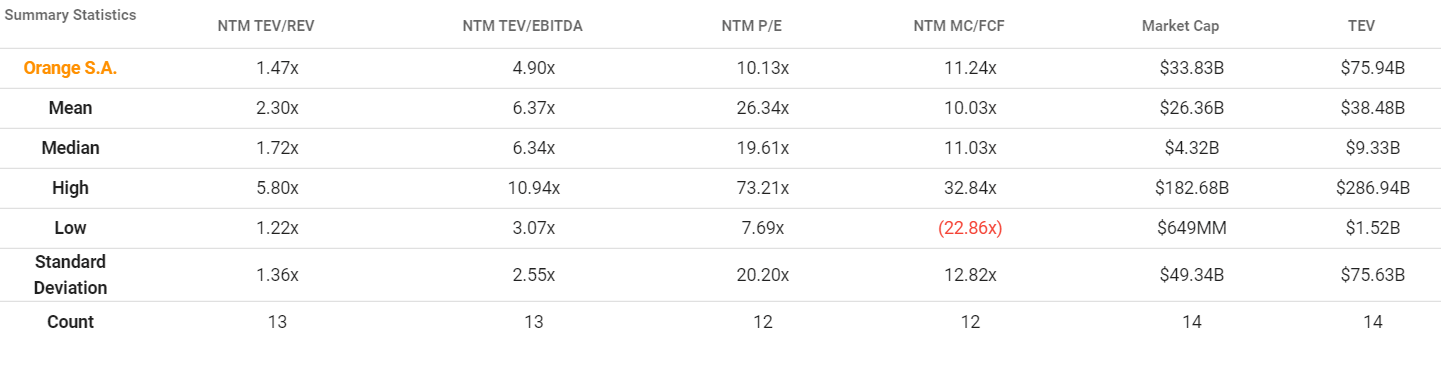
Figure 25 - Competitor Comparison - TIKR
Conclusion
Orange can be seen as a bond substitute. It offers an excellent yield and is has a low probability of (over the long-term) delivering any capital losses. It is more likely that it will revert to a more normal value over the next few years.
In addition, there is strong potential from its African operations and its ventures into Content, e-Health and Cyber. 5G and Fibre can also offer the potential of increased ARPU in its home countries. I may follow up on this in future articles.
In conclusion, I usually target a 10% discount rate on my investments. However, with the low P/B ratio and stable cash flows, this can act as ballast against some of my higher risk and volatility investments. To conclude Figure 26 shows my personal entry and exit points for this position. As such I am currently willing to build up to a 10% position in Orange. I will periodically review the company, especially before ay sales.
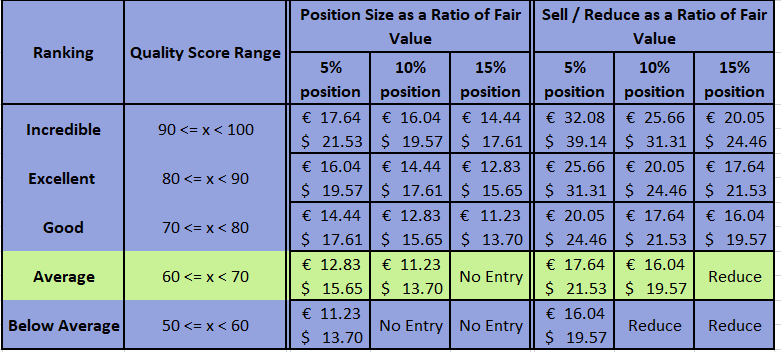
Figure 26 - Personal Guidelines
Short Message
I would really appreciate it if you would take some time and post in the comments any suggestions that you have for this article so that I can improve in the future.
Stay safe - Tom.