This dividend ETF review series aims at evaluating products regarding the relative past performance of their strategies and quality metrics of their current portfolios.
JDIV strategy and performance
The JPMorgan U.S. Dividend ETF (JDIV) has been tracking the JPMorgan US Dividend Index since 11/08/2017. Its SEC yield is 2.84% and the total expense ratio is 0.12%.
The underlying index is owned by JPMorgan Asset Management and administrated by FTSE Russell. As described on FTSE Russell website, "The JP Morgan US Dividend Index is comprised of US securities selected from the Russell 1000 Index and uses a rules-based factor selection process developed by J.P. Morgan Asset Management. The index is designed to reflect a sub-set of US securities selected for their factor characteristics. The index seeks to diversify risk across sectors and securities while selecting constituents to deliver high dividend yield."
The selection and weighing process of the underlying index is based on the trailing 12-month dividend yield (higher is better) and the ICB industry classification. Companies above a dividend score threshold are selected in equal weight in every industry. The weights of constituents are adjusted using an industry volatility factor, then re-adjusted so that every industry aggregate weight is between 5% and 20%. The methodology is detailed here.
JDIV holds about 230 large and mid caps. The next table lists the top 15 holdings with their weights and valuation ratios. They represent about 10% of the portfolio value. All positions are below 1%, so the risk related to individual stocks is low.
Ticker | Name | Weight | P/E ttm | P/E fwd | P/Sales | P/Book | P/FCF | Yield% |
Olin Corp. | 0.72% | N/A | 7.53 | 1.14 | 4.20 | N/A | 1.81 | |
UnitedHealth Group Inc. | 0.66% | 27.38 | 22.14 | 1.46 | 5.50 | 29.16 | 1.40 | |
United Parcel Service Inc. | 0.66% | 35.39 | 19.29 | 2.08 | 26.04 | 49.83 | 1.92 | |
Eaton Corp. Plc | 0.65% | 43.70 | 24.70 | 3.51 | 4.16 | 47.96 | 1.95 | |
Johnson & Johnson | 0.65% | 25.48 | 17.61 | 5.08 | 6.88 | 44.31 | 2.50 | |
Procter & Gamble Co. | 0.65% | 25.60 | 24.83 | 4.82 | 7.89 | 43.81 | 2.50 | |
Hubbell Inc. | 0.64% | 30.52 | 23.26 | 2.59 | 5.18 | 35.61 | 1.99 | |
Medtronic PLC | 0.64% | 47.75 | 22.33 | 5.73 | 3.36 | 97.78 | 1.98 | |
PepsiCo Inc. | 0.64% | 26.26 | 24.90 | 2.89 | 14.08 | 147.58 | 2.77 | |
AbbVie Inc. | 0.63% | 41.31 | 9.28 | 4.14 | 15.15 | 24.98 | 4.44 | |
Eli Lilly and Co. | 0.63% | 35.52 | 30.06 | 8.50 | 31.38 | 78.04 | 1.43 | |
Duke Energy Corp. | 0.62% | 59.12 | 19.86 | 3.30 | 1.72 | N/A | 3.82 | |
Emerson Electric Co. | 0.62% | 27.78 | 24.86 | 3.47 | 6.49 | 30.42 | 2.06 | |
Paychex Inc. | 0.62% | 36.77 | 32.99 | 9.96 | 13.70 | 176.97 | 2.37 | |
FirstEnergy Corp. | 0.61% | 15.52 | 14.94 | 1.89 | 2.77 | N/A | 4.16 |
Ratios from Portfolio123
Since inception (November 2017), JDIV has lagged its parent index Russell 1000 (IWB) by a wide margin: the difference is over seven percentage points in annualized return. It is also more risky regarding drawdown and volatility (standard deviation of monthly returns).
Annual.Return | Drawdown | Sharpe ratio | Volatility | |
JDIV | 10.37% | -42.19% | 0.51 | 20.49% |
Russell 1000 | 17.88% | -34.60% | 0.9 | 17.84% |
Data calculated with Portfolio123
The next chart plots the equity value of $100 invested in JDIV and IWB since JDIV inception, reinvesting dividends.
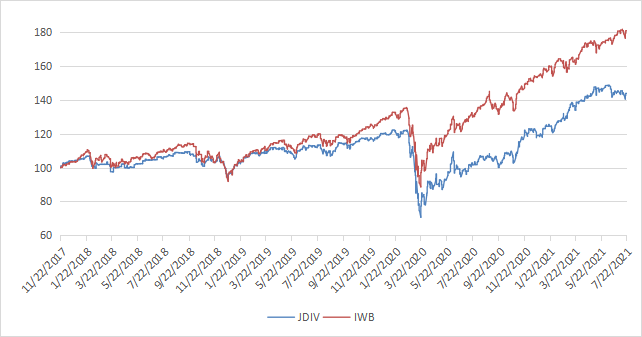
Chart: author; data calculated with Portfolio123
JDIV has steadily underperformed its stock universe since 2017.
Comparing JDIV with a reference strategy
Most dividend-oriented strategies have lagged since 2014, so comparing JDIV with a broad index on a relatively short period may be irrelevant. I will add a comparison with my dividend-quality benchmark. In previous articles, I have shown how three factors may help cut the risk in a dividend portfolio: Return on Assets, Piotroski F-score, and Altman Z-score.
The next table compares JDIV since inception with a subset of the S&P 500: stocks with an above-average dividend yield, an above-average ROA, a good Altman Z-score, a good Piotroski F-score and a sustainable payout ratio. The subset is rebalanced quarterly.
Annual Return | Drawdown | Sharpe ratio | Volatility | |
JDIV | 10.37% | -42.19% | 0.51 | 20.49% |
Dividend-quality subset | 14.25% | -32.78% | 0.71 | 18.50% |
Past performance is not a guarantee of future returns. Data Source: Portfolio123
My dividend-quality subset beats JDIV by almost four percentage points in annualized return and shows better risk metrics. However, the ETF performance is real and this subset is hypothetical. My core portfolio holds 14 stocks selected in this subset (more info at the end of this post).
Scanning JDIV with quality metrics
Among 230+ holdings, 77 are risky regarding my metrics. These are companies with at least two red flags: bad Piotroski score, negative ROA, unsustainable payout ratio, bad or dubious Altman Z-score. Risky stocks weigh over 30% of the portfolio. According to my calculations, the position-weighted average ROA is inferior to the S&P 500: 4.7% vs 6.5%. The Altman Z-score and Piotroski F-score are also worse than for the broad index: 2.73 vs. 3.76 and 5.4 vs. 5.7, respectively. These metrics point to a portfolio quality significantly inferior to the benchmark.
JDIV vs. SCHD
The Schwab U.S. Dividend Equity ETF (SCHD) is one of the most popular dividend ETFs in the same yield range. SCHD has a lower management fee (0.06% vs. 0.12%) and better return and risk metrics since JDIV inception.
Annual Return | Drawdown | Sharpe ratio | Volatility | |
JDIV | 10.37% | -42.19% | 0.51 | 20.49% |
SCHD | 16.24% | -33.37% | 0.84 | 17.89% |
Conclusion
JDIV holds about 230 dividend stocks selected with systematic rules across all sectors. It has underperformed its stock universe Russell 1000 since inception in 2017. Historical data also point to a higher risk in drawdown and volatility. Portfolio quality is significantly below the benchmark according to my metrics. Risk-adjusted performance is disappointing compared to SCHD, one of its competitors in the same yield range. JDIV performance history is too short to make a definitive judgment. However, based on current portfolio metrics and comparison with its peers, it is certainly not among the best dividend ETFs. For transparency, my equity investments are split between a passive ETF allocation and an actively managed stock portfolio, whose positions and trades are disclosed in Quantitative Risk & Value.
My model portfolio of high quality dividend stocks is designed to beat dividend ETFs. QRV Members get timely updates paired with risk indicators. Get started with a two-week free trial now.
