
My bullishness on gold has grown dramatically over the last couple of weeks, as Federal Reserve Chairman Powell has pushed the crazy idea that QE tapering is not guaranteed this year, and interest rate increases to match spiking inflation (5.4% YoY CPI) are nowhere on the radar. The Jackson Hole meeting speech was a clincher in my mind that emergency U.S. money printing is not about to end. So, a weaker dollar currency and rising gold/silver/platinum prices into 2022 have an even greater chance of occurring vs. my early August expectation.
As a consequence, I have increased gold bullion holdings in my brokerage account into one of the largest overall positions, centered in the low-cost iShares Gold Trust (NYSEARCA:IAU). The main long-term reason to own the product is gold's continued undervaluation vs. other assets like stocks and bonds. My research comes up with a fair value for gold, looking back at data to the 1960s, of between US$2600 and $2700 currently. It's a median average calculation, where gold half the time has traded above this adjusted valuation, and half the time below it, over many decades. This is not a wild prediction but is downright reasonable when you review a variety of data points. Here's why.
Gold's Relative Price
I wrote an article during the summer of 2018 here with gold trading around US$1200 an ounce, explaining $2000 prices were right around the corner. At the time, I think there were only three other writers left on Seeking Alpha putting out bullish articles on hard money gold. Well, the prediction proved out 24 months later, despite the fact few investors were prepared for a sharp gain in precious metals.
Today's setup for gold (silver and platinum also) is not much different. Believe it or not, the large gains in U.S. stock market pricing, foundational money supply data and U.S. public debt numbers over the past 36 months translate into a still cheap relative price for gold (assuming it holds the same value over time). Despite screams that the 50% rise in gold over the last three years has created a "bubble" in pricing, the fact is this leading precious metal, functioning as real money in the real world (not cryptocurrencies), has not risen at all vs. other asset classes and macro finance comparisons.
I have written many times about my "fair value" calculation tracked for decades, based on 60 years of relative pricing ideas, measuring the gold quote vs. money supply data, Treasury debt outstanding, stock market wealth, real estate prices, economic output, current mine production costs, and the pricing of other commodities (especially crude oil & natural gas, plus the other precious metals). Let's look at some of the components of my formula, as examples to illustrate gold's undervaluation.
Stock Market Capitalization
Believe it or not, gold prices have risen about 8% compounded annually since the late 1960s, just before the U.S. left a fixed gold standard for dollars under President Nixon. This number is not much different than the S&P 500 11% total return over the same span. The only major difference between the two asset classes has been the long-term equity dividend yield of roughly 3.5% annually, especially when reinvested to create superior long-term gains. In the end, stock prices over extended periods of time are largely a function of regular increases in the money supply and liquidity throughout the financial system (mostly orchestrated by the Federal Reserve and big banks), the same as hard money gold.
Very little economic growth has seeped into actual stock pricing, if you want to be honest about the Wall Street money shuffling game, over the past century. Ever rising tax burdens for business and consumers, expanding overseas ownership of U.S. operating assets, and shifts in ownership designs toward private equity and LLCs not publicly traded are other reasons.
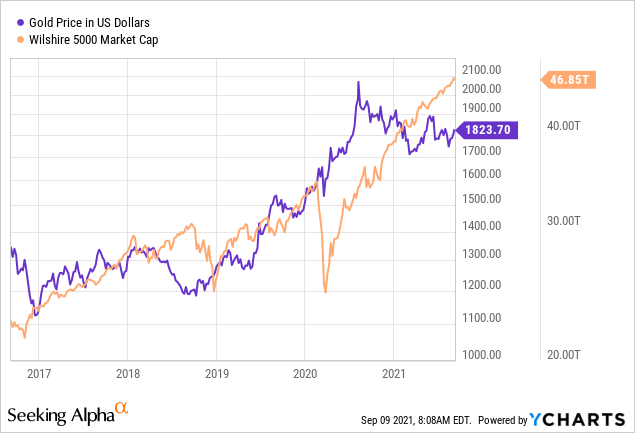
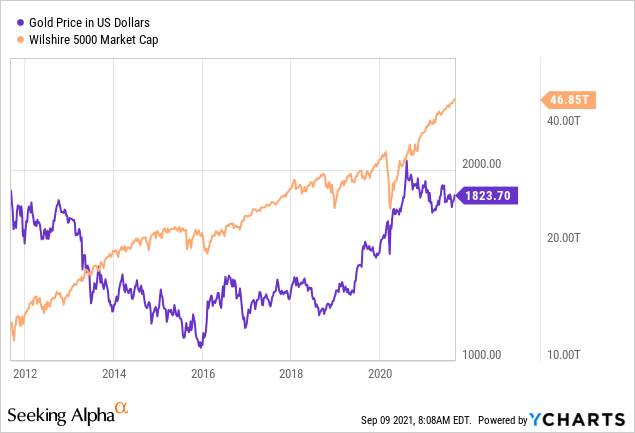
I have graphed below the gold price vs. rising equity values represented by the Wilshire 5000 market capitalization since 1978 (as far back as YCharts data goes for gold). Again, they are nearly identical growth curves on a logarithmic scale over 43 years. 1979-81 saw a peak in gold's relative value to stocks, while the dotcom boom of the late 1990s and early 2000s witnessed a modern low valuation.
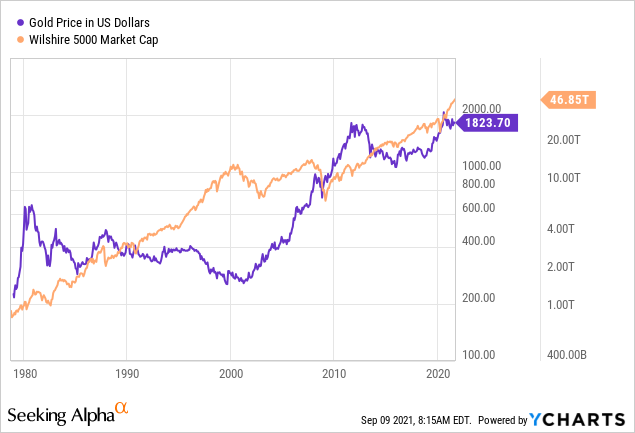
If gold traded at the same "relative valuation" to stock capitalization as 1980's $800 per ounce peak, the gold price would now be $36,000!
Another interesting point to make is gold has been a serial "underperformer" on 1-year, 3-year, 5-year and 10-year charts. In other words, gold is moving into a deep undervaluation position vs. stock prices. Far from a bubble, gold remains incredibly cheap.
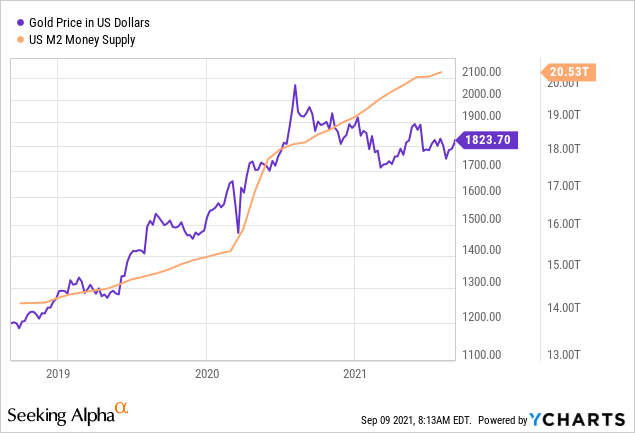
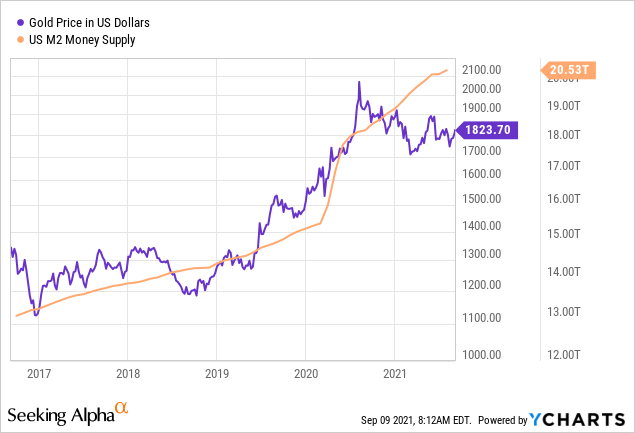
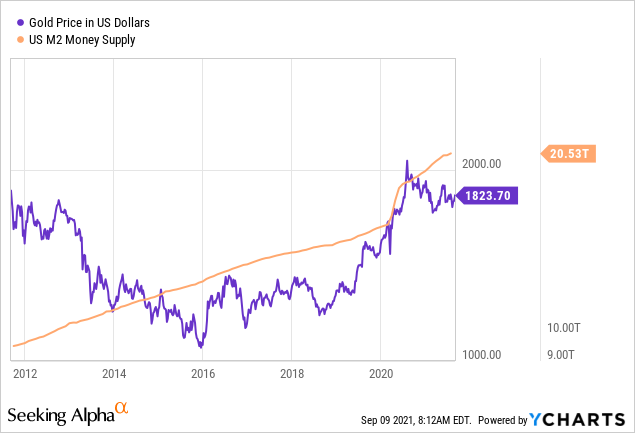
M2 Money Stock
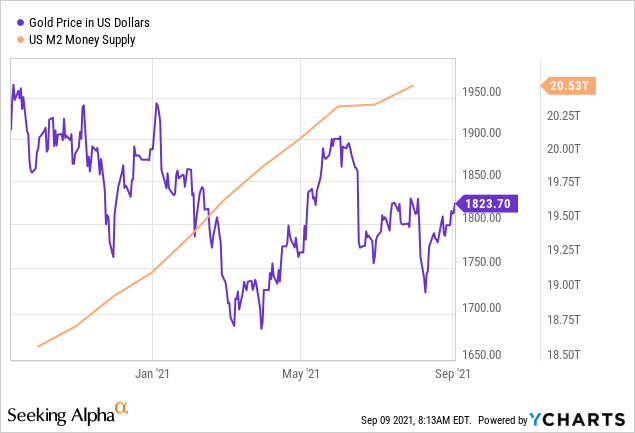
When you get down to the foundation of how gold is priced, it is almost entirely a function of a nation's money printing and sovereign debt. These are the two engines that drive economic growth and inflation rates over time. So, if gold's purpose in the world is to offset money printing and retain long-term value in a local currency (which gold has done for thousands of years), you would expect its price to mimic basic M1 and M2 money stock expansion.
Core monetary expansion has ballooned with the pandemic, more so in the U.S. than many other western nations. [The dollar's reserve currency status and use as a safe haven worldwide during economic turmoil are one reason. Record U.S. debt issuance for consumers, businesses and the government is another excuse for record money creation in America.] M2 has actually risen far faster than the gold price since 1978. If gold was rerated at the same "relative value" as the 1980 peak quote of $800 per ounce vs. M2, gold today would be trading over $12,000 an ounce!
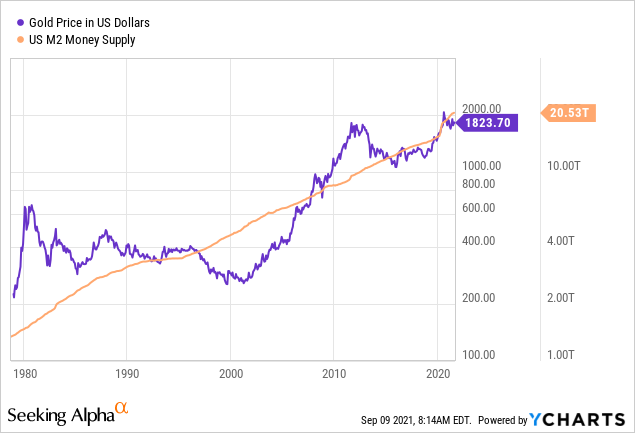
The $1100 gold low quote of 2016 would be equal to $1750 today, if you adjust for M2 growth, about the same as $1800 presently. Another ratio idea to munch on, the $1370 high quote of 2016 would be the same as $2180 today, if gold held its value vs. the dollar money printing rate over five years.
When you dive into the statistics, gold has again underperformed over 1-year, 3-year, 5-year and 10-year spans when adjusted to M2 expansion.
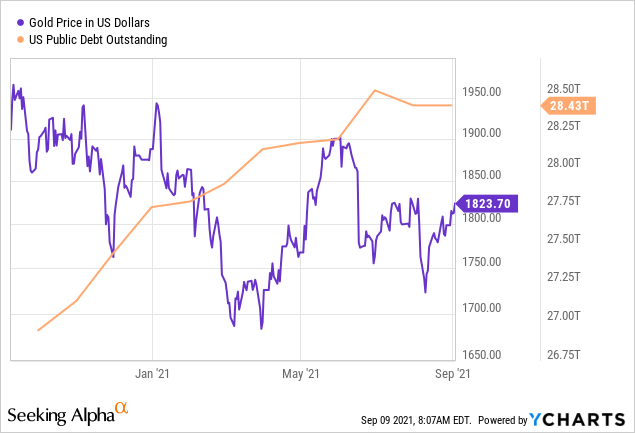
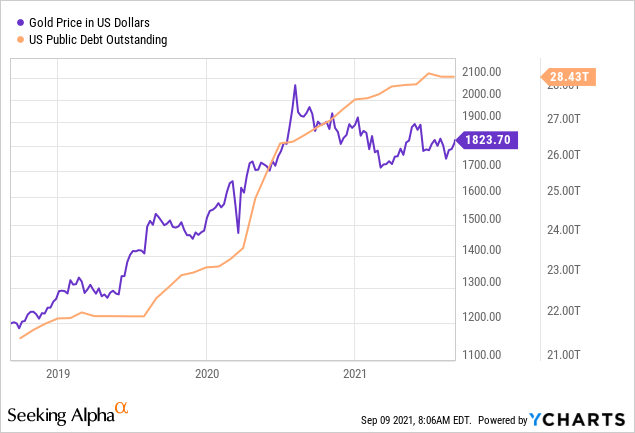
U.S. Treasury Debt
Treasury debt is effectively a representation of future money printing needs. America will require additional liquidity to paper over and prevent default on $28+ trillion in debt. Don't fool yourself. Markedly higher rates of money printing are approaching fast. Consequently, the next best "money" float idea to review for gold pricing is total U.S. Treasury obligations. More debt means more money printing and inflation in the future, when you dummy down the concept.
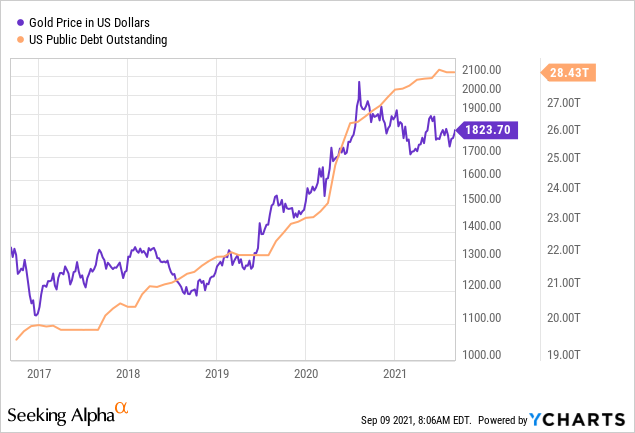
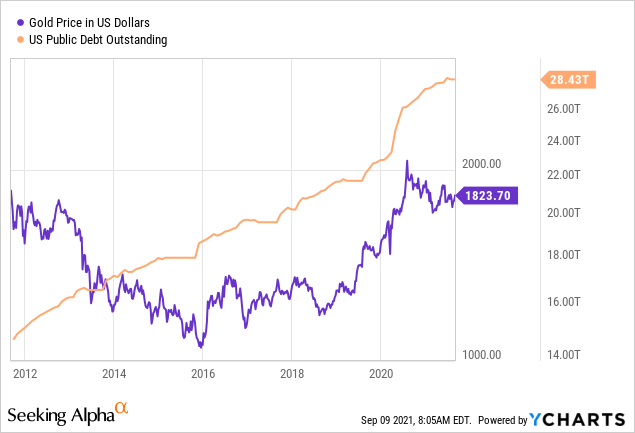
The farthest back YCharts will take Treasury debt totals is 2001, but you can easily locate both data series on your own back to the turn of the previous century in 1900, if you want. In reality, today's $1800 gold vs. $28 trillion in national public debt is almost as cheap as $275 gold vs. Treasury debt outstanding 20 years ago. In other words, the +550% rise in gold is completely supported by the amount of sovereign debt being issued.
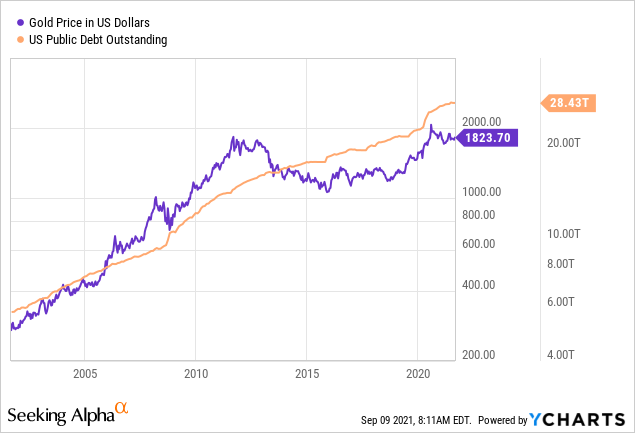
Again, gold's climb in price is lagging badly behind the debt being issued by Uncle Sam over the last 1-year, 3-year, 5-year and 10-year periods. All things considered, a rational investor in 2011 would have expected gold prices to trade even higher than $1800 in 2021, given the mammoth rise in Treasury debt over a decade. The 2011 high trade of $1900 would be the same as $3700 today, if gold kept pace with the near doubling in U.S. Treasury debt outstanding.
IAU Buy Logic
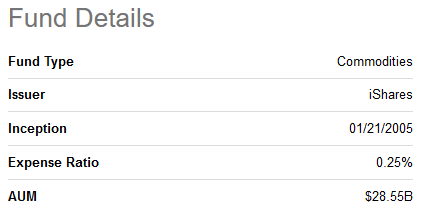
If gold seems destined to continue gaining in price, as the dollar is debased daily, how should investors position themselves? For regular brokerage accounts, I use bullion ETFs. [Of course, direct bullion holdings are best, where you take physical possession.] My favorite choice right now is the iShares Gold Trust. It holds $28 billion in gold bullion and has one of the lowest annual management fees of 0.25% annually for investors in this ETF asset class.
I wrote an article in June here explaining the strong IAU setup for investors, including superior long-term total returns vs. peers and competitors on your gold bullion ETF capital. I also like the ability to sell covered call options, and create some income, at lower round lot values with a price 1/5th that of the more popular SPDR Gold Shares ETF (GLD). IAU is one of my largest portfolio holdings today.
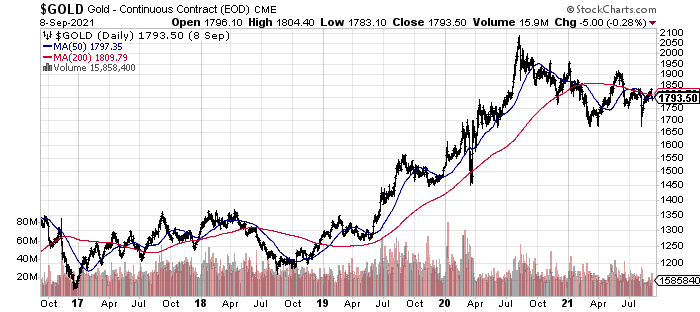
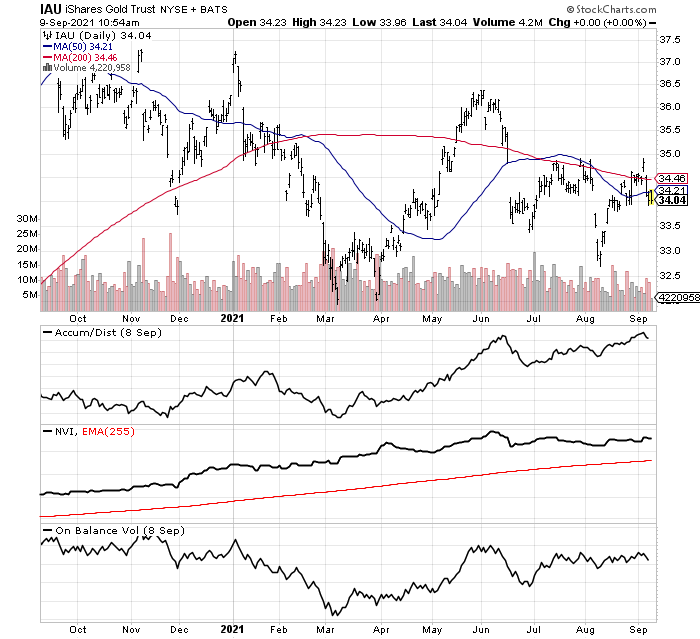
In terms of technical trading positives, most of the underlying momentum indicators I track remain in bullish patterns. Below you can review a 1-year chart of daily price and volume changes, alongside the uptrending Accumulation/Distribution Line, Negative Volume Index, plus a better than you would expect On Balance Volume reading. Other gold bullion ETFs and gold futures trading have outlined similarly strong momentum patterns.
Final Thoughts
Looking at the popular Dow Industrials to Gold Ratio, stocks are in the 90th percentile for valuation vs. gold over the last century of trading. Only a few years during the 1960s, plus the dotcom technology bubble years during the late 1990s and early 2000 were more expensive. For the Dow to Gold comparison to fall back to its 100-year average around 10x, either stocks would have to decline 50% or the price of gold rise 100%. More than likely, we could get a narrowing in the spread with both moving in opposite directions as witnessed during 2021. While a convergence in price is the most probable outcome over the next 12-24 months, if U.S. equities stay elevated, a huge jump in gold could be approaching.
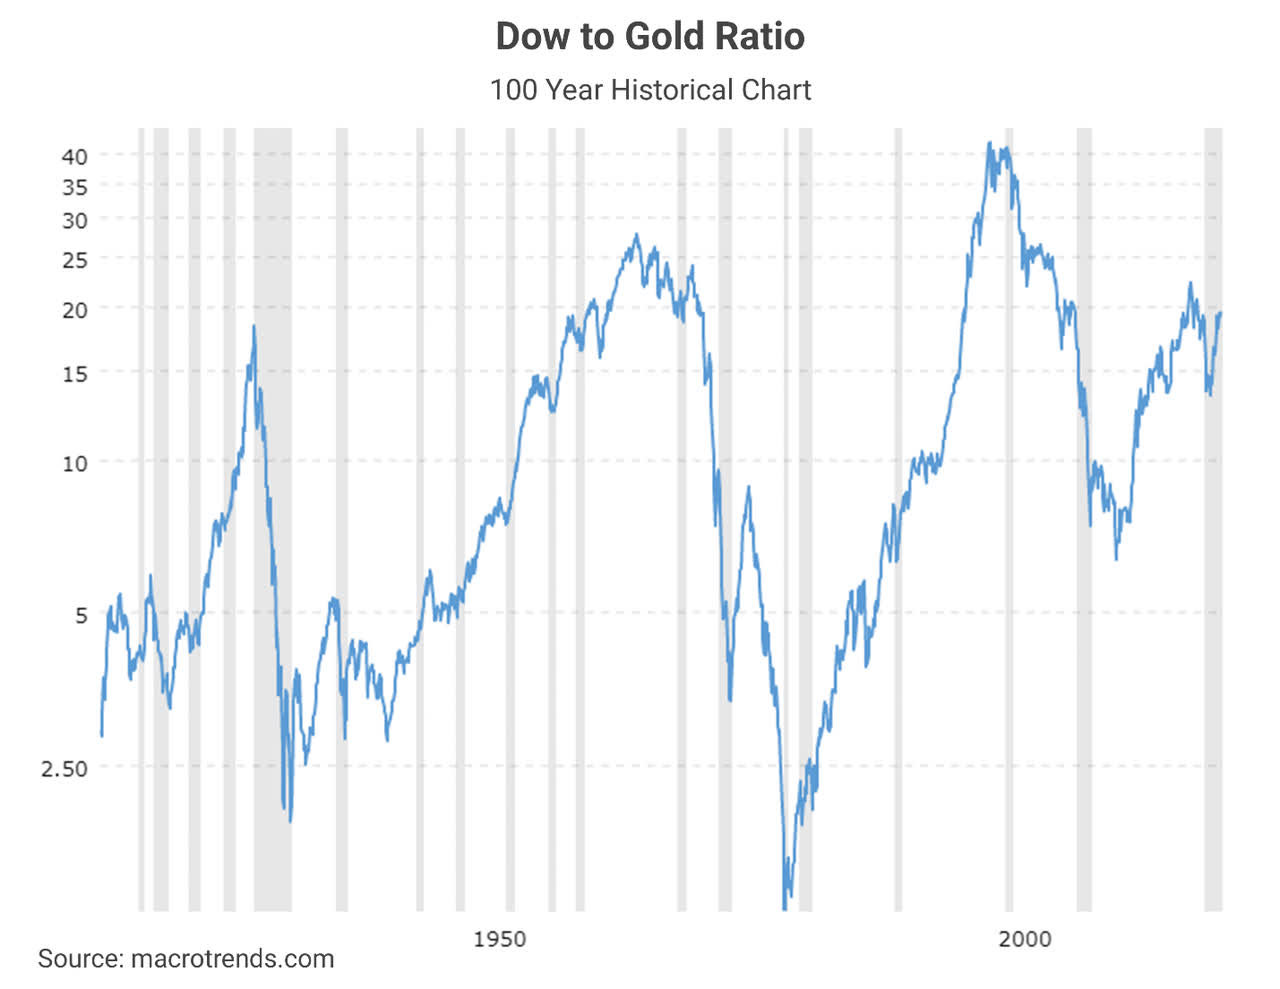 Image Source: Macrotrends Website
I am modeling a move in gold to $2500 over the next 12 months, and $3000 in 24 months. These targets would put the gold price closer to its underlying fair value of $2700+ next year, and perhaps $3000 by early 2024. Like Chairman Powell said in his Jackson Hole speech, emergency money printing to combat COVID-19 coronavirus economic dislocations is not ending anytime soon. Don't fight the Fed, listen to what they are saying and doing!
If we do experience another robust upside push in gold prices, related miners are also a bull idea to contemplate during September 2021. The whole gold/silver mining industry is today selling at super-high free cash flow yields. You can imagine what a further $700-$1000 increase in profitability per ounce will do for sector profits & cash flow in the next 2-3 years. You can review the mining free cash flow angle in an article I posted several weeks ago here, with a focus on Newmont (NEM). Honestly, the gold miners are about as cheap relative to the existing Wall Street pricing/valuation backdrop as I can remember, over 35 years of trading them.
What could go wrong with a bullish gold forecast? Two macroeconomic events could delay the strong upturn I am forecasting. Either a stock market crash or sharply higher dollar on currency exchange markets could keep liquidity in check and dissuade international hard money investors from bidding gold higher. In addition, if the Fed stopped printing money and Uncle Sam quit borrowing funds, gold would not have the fuel for new gains. Otherwise, I fully expect higher gold quotes will become the new trading trend, reversing 2021's drift lower.
Thanks for reading. Please consider this article a first step in your due diligence process. Consulting with a registered and experienced investment advisor is recommended before making any trade.