Scott Olson/Getty Images News
The investment thesis
My last article analyzed Exxon Mobil (NYSE:XOM) from a long-term perspective. The results show that XOM's profitability has turned a corner recently as oil prices stabilize, travel recovers after the pandemic, and its renewable businesses begin to contribute.
This article switches the focus to the near term and discusses XOM under the context of several unfolding market risks: inflation, interest rate, and market valuation. This is an interesting moment for investors - with so many uncertainties on the near horizon and the market valuation at a historical high. In this article, I will examine three of these uncertainties (inflation, interest rate, and market valuation) and show why XOM is an investment that is not only shielded from these risks but also help to fight against these risks.

Source: Getty images provided via SA.
Oil prices have consistently beaten inflation
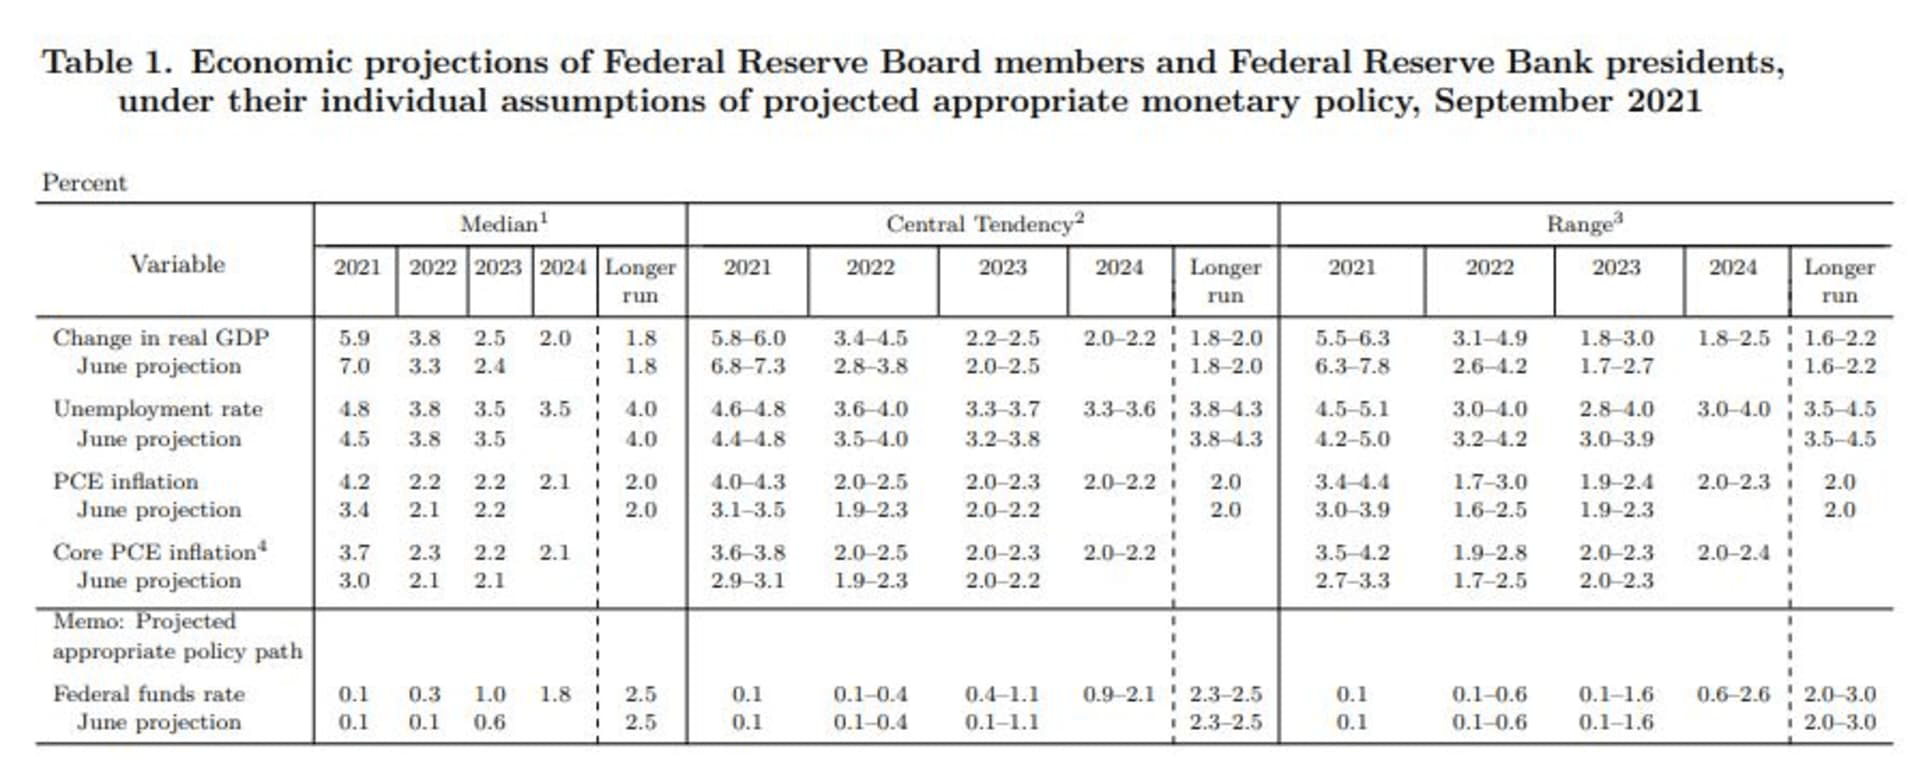
Inflation is now a larger risk than what we (and the Fed) thought even a short while ago. Earlier in the year, the Fed's narrative is that the inflation we were seeing was transitory. Then shortly afterward in June 2021, Fed Chair Powell says inflation could end up "higher and more persistent than expected". Now, in its most recent meeting minutes, the Fed increased its inflation forecast for the year. It now sees inflation running to 4.2% this year as you can see from the chart below, above its previous estimate of 3.4%.
Source: Fed's meeting minutes release Sept 2021.
So, here comes the first good reason to consider XOM - oil prices have consistently beaten inflation in the past, as shown by the long-term data tracked by the U.S. Energy Information Administration ("EIA") in the next chart. First, a bit of background information before we interpret this chart in-depth. In this chart, the orange shows the prices of oil unadjusted for inflation, and the blue line shows the real prices adjusted for inflation. And according to EIA, these prices are computed in the following way:
The real prices are computed by dividing the nominal price in a given month by the ratio of the Consumer Price Index ("CPI") in that month to the CPI in some "base" period. The Real Petroleum Prices spreadsheet and charts are updated every month so that the current month is the base period in the monthly price series. Consequently, all real prices are expressed in "current" dollars and any current month price may be compared directly with any past or projected real prices.
With this background, now we can make some observations. First, as you can see, the orange line stays consistently below the blue, meaning that the nominal price (i.e., real price appreciation plus inflation) has been rising faster than the real price (i.e., only real price appreciation). And, as a result, the gap between the blue line and the orange line shows how much faster the real price of oil has been rising than inflation. Next, let's be more quantitative. The nominal oil prices over the past 50+ years have been rising at 5.9% CAGR - and again, this is the rate combining both real price appreciation and inflation. Over this same period of time, inflation has been 3.9% CAGR on average. So, as a result, oil prices have consistently beaten inflation by a whole 2%.
XOM is a leading global integrated oil company and also will be best poised to benefit from this gap above inflation. Its 2020 production was 2.3 million barrels and its proven reserve is 15.2 billion barrels of oil (and oil equivalent). So, to sum up, XOM has been enjoying and will continue to enjoy this gap above inflation.
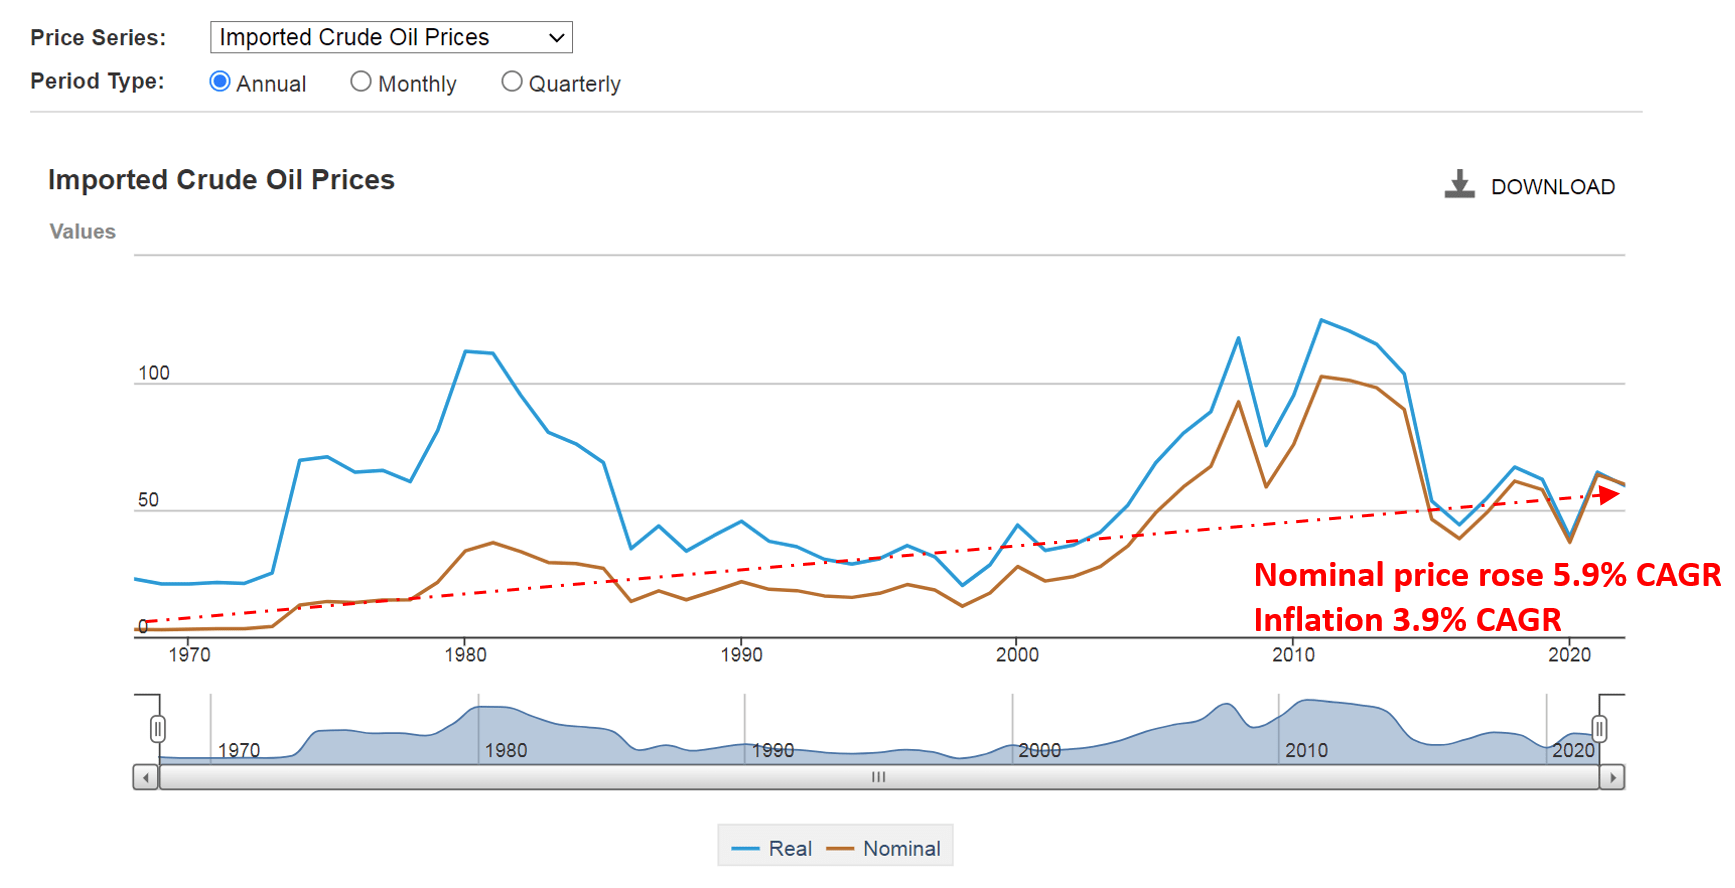
Source: U.S. Energy Information Administration (EIA)
XOM yield provides a widespread against interest rate fluctuation
If the surging inflation is not bad enough, then the low interest rate environment certainly makes it even worse for ordinary investors. With the current 10-yr treasury bond yield rate near 1.6% and inflation expected to be 4.2%, bond investors would be actually losing money, i.e., taking return-free risks instead of enjoying the risk-free return that bonds are supposed to offer.
This is where XOM, a dividend aristocrat, could help in a second way.
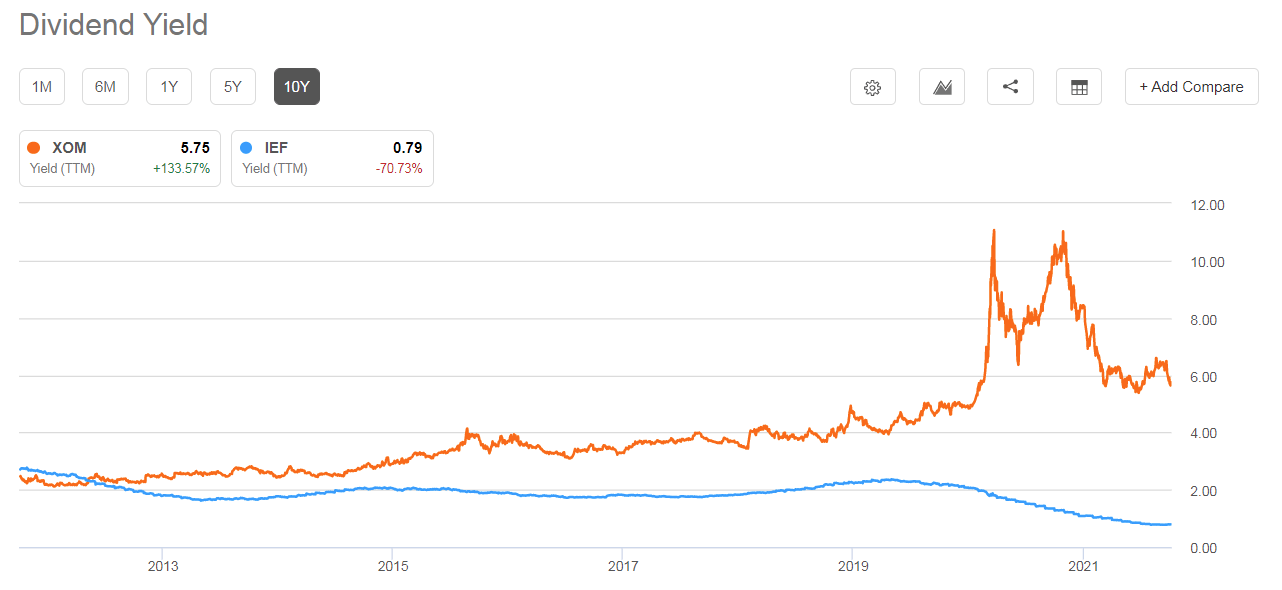
As can be seen from the next chart; currently, the dividend yield of XOM is near 5.7%. The dividend yield has been driven higher over the past decade by consistent dividend increases and valuation compression. It started the decade with a dividend yield of around 3.4%. And the dividends have been increasing continuously; however, the price increases were more slowly. As a result, the combined effects have driven up the yield to around 5.6% now. So, in terms of dividend yield, the valuation has been compressed by more than 2/3 over the decade.
However, do not forget that interest rates have been in steady decline over the past decade - so that a really wide yield spread has developed. As you can see from the chart, over the past decade, the interest rates (represented by the yield on IEF) have been declining while XOM's yield climbing. Interest rates act as the gravity on all asset valuations. And when interest rates fall, the valuations for other assets such as XOM should go up - but it did not. So the 2/3 valuation compression mentioned above is even more dramatic than what it seems on the surface considering the interest rates decline.
Source: author and Seeking Alpha data.
For bond-like equity such as XOM that enjoys stable profitability and pays a stable dividend, a more direct to see the valuation compression is to look at the yield spread, as illustrated in the following chart. This chart shows the yield spread between XOM and the 10-year Treasury over the past decade. The yield spread is defined as the TTM dividend yield of XOM minus the 10-year Treasury bond rate. As can be seen, the spread is bounded and tractable over the first half of the decade. During that time, the spread has been in the range between about -1% and 2% - the way a mature business like XOM should behave.
However, due to recent valuation compression as discussed above, the yield spread has widened to a peak value of about 8% in 2020 and has come down some since then. But as of this writing, the yield spread is still at a whopping 4%. Such a wide yield spread creates a very attractive opportunity for investors to hedge interest risks.
To put things in perspective, the next chart shows the dot-plot from the most recent Fed meeting minutes. The minutes show that 9 of the 18 FOMC members expect a rate hike starting in 2022. And their longer-term projections are in the range of 2% to 3%, on average 2.5% above the current zero rates.
With this background, we can better appreciate the significance of the 4% yield spread that XOM offers. Even if the interest rate does rise by 2.5% and even if there is no increase in XOM's dividends (remember it has been raising its dividends consecutively for more than 25 years), the dividend yield from XOM would still be 1.5% above treasury bond.

Source: author and Seeking Alpha data.
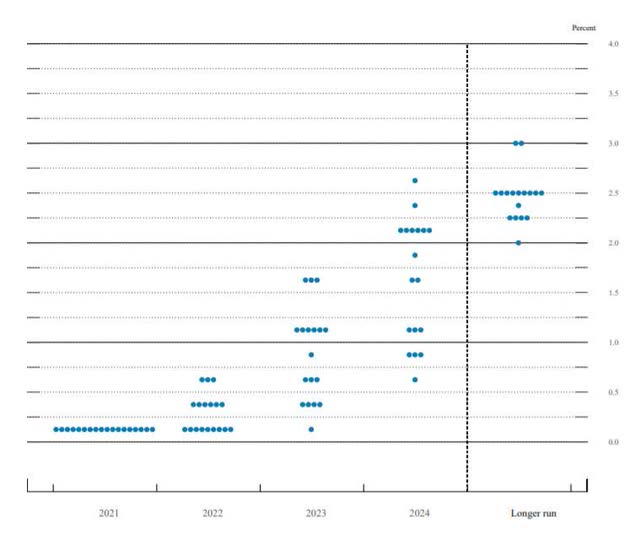
Source: Fed's latest dot-plot released Sept 2021.
XOM valuation hedges against market crash
Many of us worry about a dramatic market correction or even a market crash - for good reasons. Currently, our market valuation is at a historical high level and there are so many uncertainties both in terms of macroeconomics as aforementioned and geopolitical risks.
We've already touched on the attractive valuation for XOM in previous sections in terms of the yield spread. Here, I want further highlight a few things from a different perspective:
1. at its current price, XOM's current valuation is about 13.6x FW PE. Compared to the 34x PE for the overall market, XOM will provide downside protection in the case of a dramatic correction or even crash.
2. As the impacts of the pandemics subside and travel activities recovery, there should be a near-term catalyst to support the oil prices and hence XOM's stock prices - and a good chance even to further expand it. By the way, I just traveled about 4 weeks ago myself - my first long-distance travel over more than 1.5 years. And the Chicago O'Hare airport was as crowded and packed as ever. The brent crude oil spot prices have averaged $71 per barrel in August, down $4/barrel from July but up $26/barrel from August 2020. The prices have risen over the past year largely as a result of steady draws on global oil inventories. The U.S. Energy Information Administration anticipates the consumption to outpace production in the near term till the first half of 2022. Because it takes time for oil producers to crank up their productions after they've cranked down during the pandemics. And at the same time, it will also take time for the global shipping industry to clear its congestions.
This shortage of supply in the near term should provide a good catalyst/support for oil prices and XOM profits - and a hedge against a potential market crash.
Conclusion and final thought
My last articles analyzed the profit and operation metrics of XOM with a focus on its long-term prospects. This article switches the focus to the near term and discusses XOM under the context of several unfolding market risks: inflation, interest rate, and market valuation. The main takeaways are:
1. Oil prices have consistently beaten inflation by a good gap. XOM is a leading global integrated oil company and also will be best poised to benefit from this gap above inflation.
2. XOM yield provides a widespread against treasury rates. As of this writing, the yield spread is still at a whopping 4% relative to the 10-year treasury rate. Such a wide yield spread creates a very attractive opportunity for investors to hedge interest risks. Even if the Fed does raise the interest rate by 2.5% according to their dot plot and even if there is no increase in XOM's dividends, the dividend yield from XOM would still be 1.5% above treasury bond.
3. Finally, XOM's current valuation provides a good hedge against market correction/crash for two good reasons. First, the valuation compression is too large both in absolute terms and relative terms. And secondly, the shortage of oil supply in the near term should provide a good catalyst/support for oil prices and XOM profits.