Bruce Bennett/Getty Images News
Introduction: Why is Verizon Stock Up?
We review our Verizon Communications Inc. (NYSE:VZ) investment case after Q3 2021 results were released this morning (October 20). At the time of writing (8:30 pm EST), Verizon stock was up 2.3%.
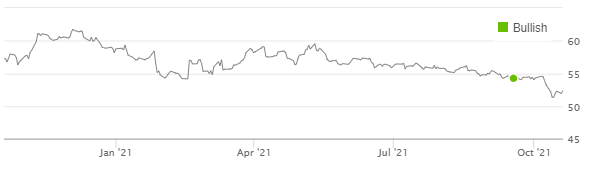
We initiated our Buy rating on Verizon last month. Since then VZ stock has fallen 3.8% and is down 8.6% in the last year (as of October 19 close):
| Librarian Capital Rating History vs. Verizon Share Price (Last Year)
Source: Seeking Alpha (20-Oct-21). |
Q3 2021 results showed that our investment case is on track. Our updated forecasts show a total return of 61% (16.0% annualized) by 2024 year-end.
Verizon Buy Case Recap
Our Verizon investment case contains the following elements:
- Verizon has a track record of disciplined and profitable growth, focused on Average Revenue Per User ("ARPU") in its Wireless businesses
- With new 5G technology and its newly acquired C-band spectrum, Verizon will see a dramatic increase in data capacity in the next few years, as the spectrum is switched on in late 2021 and sites are upgraded over time
- Verizon will monetise this additional capacity through various initiatives, including premium unlimited mobile packages, Mobile Virtual Network Operator ("MVNO") deals, fixed wireless and Mobile Edge Computing
- Competition with U.S. Cable is limited, as Verizon has perpetual MVNO agreements with Charter (CHTR) and Comcast (CMCSA), and regard their wireless subscriber growth as part of its own market share gain
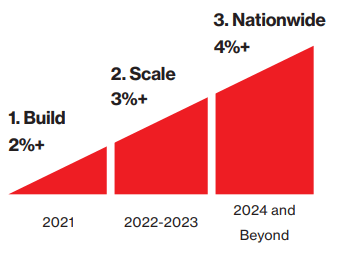
- Management targets an acceleration in Service & Other revenue growth from 2%+ in 2021 to 3%+ in 2022-23 and 4%+ in 2024 and beyond
| Verizon Service & Other Revenue Growth Targets
|
- Verizon expects EBITDA to grow in line with service revenue in dollars in Consumer and to grow with a flat margin in Business
- Verizon to gradually pay down C-band acquisition debt, reducing Net Unsecured Debt / EBITDA from to its 1.75-2.0x target range in 4-5 years
- Verizon's P/E to re-rate upwards to 12x by 2024 year-end, helped by faster revenue growth and lower leverage
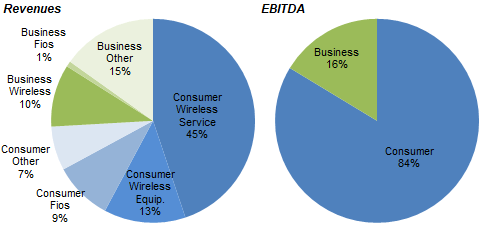
As a reminder, Verizon's EBITDA was split 84/16 between its Consumer and Business segments in 2020, and Wireless Service revenues were 55% of its group revenues (and, being higher margin, even more of group EBITDA):
| Verizon Revenues & EBITDA by Segment (2020)
NB: Operational financials only; excludes pending Verizon Media Group disposal. Source: Verizon 10-K filing (2020). |
Q3 2021 results show key elements of the investment case are on track, though the new C-band spectrum was not yet switched on (scheduled for Q4).
Group P&L: Solid Q3 & Raised Guidance
For Q3 2021, Verizon reported year-on-year revenue growth of 4.3%, Adjusted EBITDA growth of 3.3% and Adjusted EPS growth of 12.8%, though these figures are distorted by the sale of Verizon Media during Q3. Excluding Verizon Media, year-on-year revenue growth was an even higher 5.5%:
| Verizon Group P&L (Q3 2021 vs. Prior Periods)
NB. Q3 2021 included 2 months of Verizon Media ($1.4bn revenues). Source: Verizon company filings. |
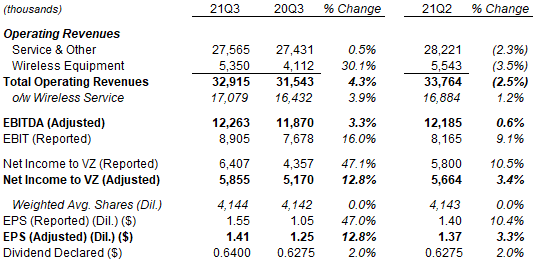
Sequentially, reported revenues were lower than in Q2, partly due to the Verizon Media disposal. Q3 Wireless Service revenues were 1.2% higher than in Q2, Adjusted EBITDA was 0.6% higher and Adjusted EPS 3.3% higher.
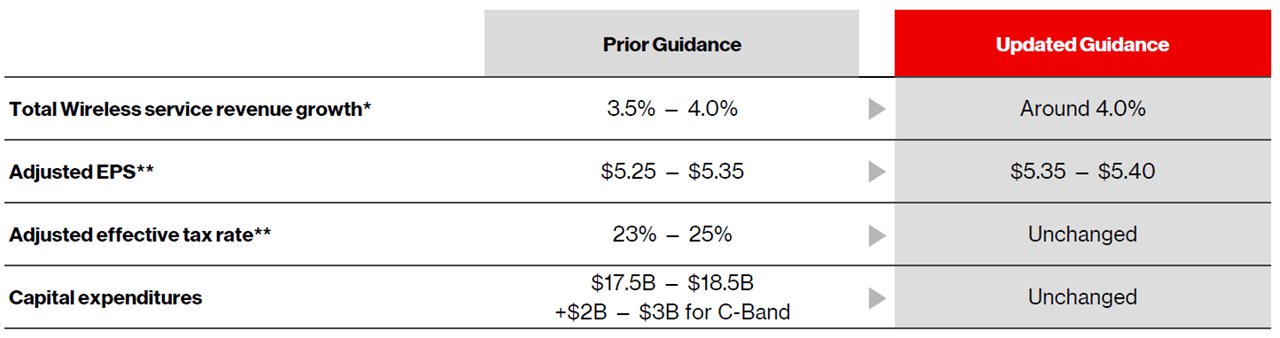
Verizon raised its full-year outlook slightly, and now expects total Wireless Service revenue growth of "around 4.0%" (was 3.5-4.0%) and an Adjusted EPS of 5$.35-5.40 (was $5.25-5.35); this implies a year-on-year Adjusted EPS growth of 9-10% (from $4.90 in 2020):
| Verizon 2021 Guidance (Updated vs. Prior)
|
Performance in each of Verizon's two segments was also solid.
Consumer: Net Adds Continued To Improve
The large Consumer segment again showed solid growth in Q3 2021.
Q3 Service revenues were 3.9% higher year-on-year and 1.1% higher than Q2, while EBITDA was 2.2% higher year-on-year and 1.1% higher than Q2:
| Verizon Consumer P&L & KPIs (Q3 2021 vs. Prior Periods)
Source: Verizon results supplements. |
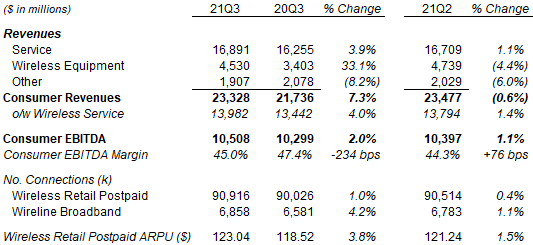
Service revenue growth was driven both by Wireless, where Retail Postpaid connections grew 1.0% and ARPU grew 3.8% year-on-year, and by Wireline Broadband, where total connections grew 4.2%.
Wireless Equipment revenues grew 33.1% year-on-year, due to both new device launches and COVID-driven weakness in the prior-year quarter. These were low-margin and had little impact on profits. The growth in Wireless Equipment revenues and also higher cost of services meant Q3 EBITDA margin fell year-on-year, though it was higher than in Q2.
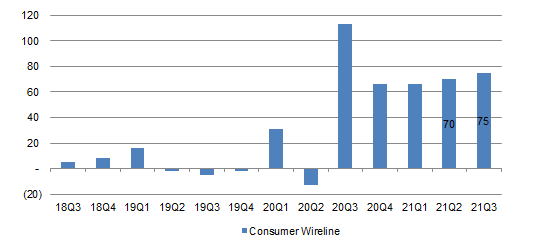
Consumer Wireless Retail Postpaid net add was 423k in Q3 2021, higher than both Q2 (350K) and the prior-year quarter (136K). Consumer Wireless Retail Postpaid Phone-Only net add was also better than both Q2 and the prior-year quarter, continuing an upward trend since 2020 (except seasonal Q1 dips):
| Verizon Consumer Wireless Retail Postpaid Phone Net Adds (Since Q3 2018)
Source: Verizon results supplements. |
Wireless Retail Postpaid net add in Q3 2021 also exceeded the pre-COVID Q3 2019 figure. This is a result of lower churn, which has fallen from 1.05% to 0.83%; gross adds were actually 319K (12%) higher in Q3 2019.
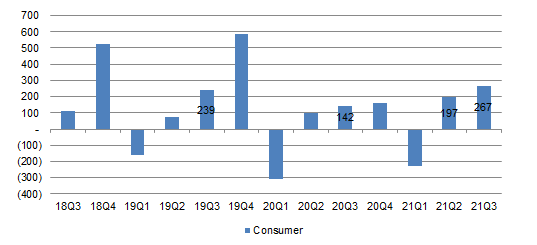
Consumer Wireline Broadband net add was 75K in Q3 2021, the result of a net add of 98K in Fios Internet and a net loss of 23K in DSL. This continued the improving trend since Q4 2020 (after a COVID-related record in Q3 2020):
| Verizon Consumer Wireline Broadband Net Adds (Since Q3 2018)
Source: Verizon results supplements. |
 NB. Q3 2020 record net add included backlog from installation pause in Q2.
Verizon's Consumer Fios Internet net add has been oscillating between 92K and 98K each quarter since Q4, but its DSL net loss has continued to narrow, resulting in the overall improving Consumer Wireline Broadband net adds.
We expect the Consumer segment to continue generating good EBITDA growth, which should accelerate as 5G and C-band are rolled out.
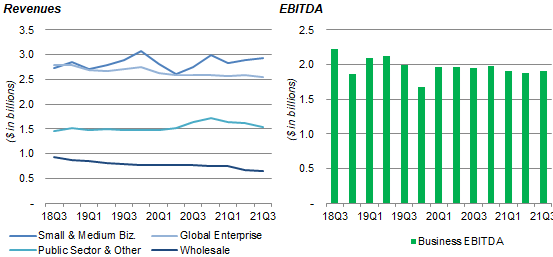
Business: Sequentially Stable EBITDA
The much smaller Business segment saw its EBITDA growing slightly from Q2, but declining slightly year-on-year, as growth in Wireless revenues were offset by declines in legacy Wireline revenues.
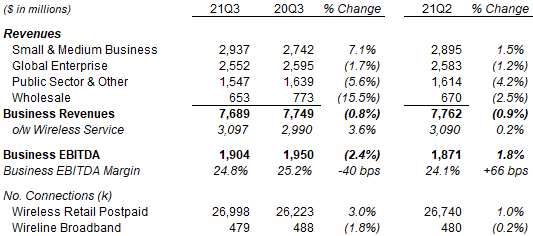
Q3 revenues were down 0.8% year-on-year and down 0.9% from Q2. Small & Medium Business ("SMB") revenues grew 7.1%, but Public Sector & Other fell 5.6% (largely due to a reduction in distance learning) and Wholesale fell 15.5% (due to a decision to reduce low-value voice traffic). Q3 EBITDA was 2.4% lower year-on-year but 1.8% higher than Q2:
| Verizon Business P&L & KPIs (Q3 2021 vs. Prior Periods)
Source: Verizon results supplements. |
Business Wireless Retail Postpaid had a net add of 396K in Q3, flat-ish from Q2 (408K) despite the reduction in distance learning, and was slightly higher than Q3 2019 (364K). Business Wireless Retail Postpaid Phone-Only net add was 162K, higher year-on-year and continuing the up trend since Q1 2021:
| Verizon Business Wireless Retail Postpaid Phone Net Adds (Since Q3 2018)
Source: Verizon results supplements. |
Business Wireline net losses have continued, but at much lower levels in 2021 year-to-date than in prior years:
| Verizon Business Wireline Broadband Net Adds (Since Q3 2018)
|
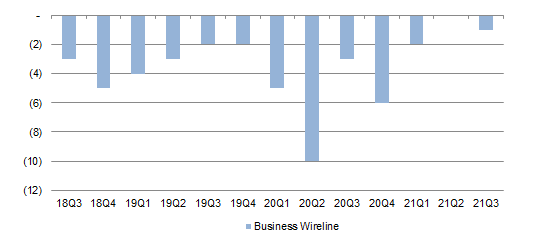 Source: Verizon results supplements.
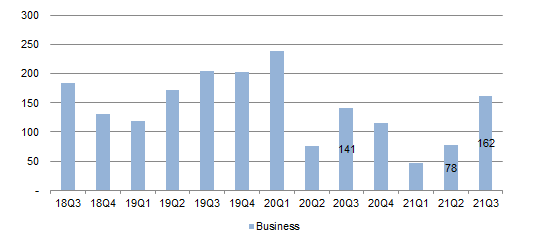
The Business segment has essentially continued the same trends as in prior quarters - rising SMB revenues, stable Global Enterprise and Public Sector & Other revenues (except a COVID-related bump in 2020), falling wholesale revenues, and a sequentially stable EBITDA since the start of 2021:
| Verizon Business Revenues & EBITDA (Since Q2 2018)
|
 Source: Verizon results supplements.
We expect the Business segment to continue to have at least stable EBITDA, and to start seeing EBITDA growth as 5G and C-band are rolled out.
New Growth Initiatives on Track
Verizon's new growth initiatives continued to progress during Q3 2021.
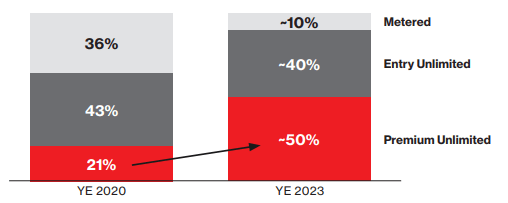
Premium unlimited mobile packages have now been taken up by 30%+ of Verizon's Consumer Wireless account base, including 66% of new accounts. This compares with just 21% at 2020 year-end and the 2023 target of 50%:
| Verizon Wireless Retail Postpaid Account Mix (2020A vs. 2023E)
Source: Verizon investor day infographic (Mar-21). |
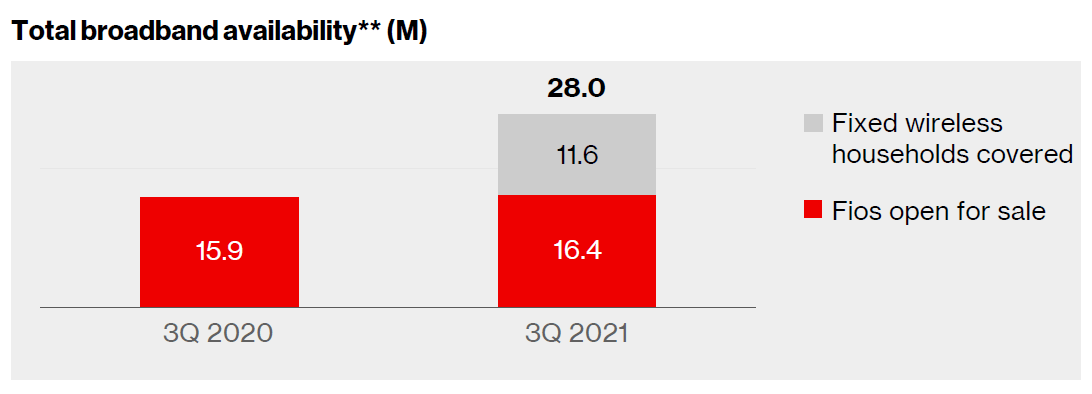
Fixed wireless net add was 55K in Q3 2021, disclosed for the first time. This brought total fixed wireless customers to "approx. 150K". (The figures include both Consumer and Business customers.) These are served by a mixture of 4G LTE and 5G mm Wave offerings. Management stated that these are roughly 50/50 split between existing Verizon customers and new customers. Fixed wireless coverage added 11.6m households to Verizon's coverage as of Q3, and management is confident of reaching the 2021 year-end target of 15.0m:
| Verizon Fixed Wireless & Fios Coverage (Q3 2021 vs. Prior Year)
Source: Verizon results presentation (Q3 2021). |
The acquisition of TracFone, a prepaid MVNO, is on track to close in Q4 2021.
The actual roll-out of 5G and C-band technology also remain on track, and management confirmed that Verizon has secured all major equipment needed.
Verizon Dividend Yield & Valuation
At $52.35, relative to 2020 financials, Verizon stock is trading at a P/E of 10.7x and a Free Cash Flow ("FCF") Yield of 10.9%; relative to last-twelve-month ("LTM") financials, the P/E is 9.9x and the FCF Yield is 10.4%:
| Verizon Earnings, Cashflows & Valuation (Since 2018) Source: Verizon company filings. |
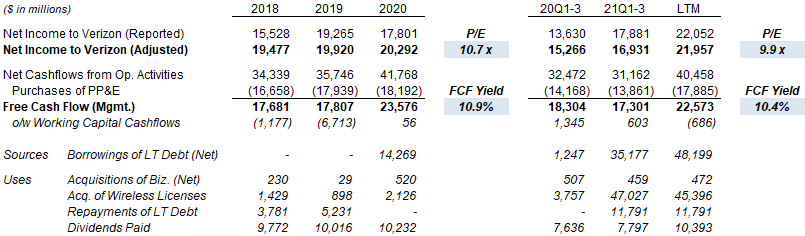
2021 year-to-date FCF is lower year-on-year due to a one-time tax benefit in 2020 and more working capital being needed for growth this year.
Verizon has raised its quarterly dividend by 2% to $0.64 for Q3 ($2.56 annualized), which represents a Dividend Yield of 4.9%. Management expects to continue growing the dividend.
Net Unsecured Debt / EBITDA was 2.7x at Q3 2021, down 0.2x sequentially. (Net Debt / EBITDA was 2.9x.) This was helped by $4.1bn received from the Verizon Media sale during Q3, and would be partly reversed by the $3.125bn expected to be paid for the (50/50 cash/stock) TracFone acquisition in Q4.
Verizon Stock Forecasts
We have updated our 2021 assumptions but kept the rest of our forecasts unchanged (see our initiation article for details):
- Service & Other Revenues to grow at 3% in 2021-23, and 4% in 2024
- Consumer EBITDA growth to equal Service & Other Revenue growth in dollars
- Business EBITDA / Service & Other Revenue margin to be flat
- Net Debt / EBITDA to be reduced by 0.2x each year
- Effective interest rate of 3.6%
- Effective tax rate of 24.0%
- Share count to increase by 0.3% annually
- 2021 EPS of $5.375 (was $5.27) and dividend of $2.56 (was $2.54)
- From 2022, Dividend to grow on a Payout Ratio of 48%
- P/E of 12.0x at 2024 year-end, equivalent to a 4.0% Dividend Yield
Our 2024 EPS forecast remains unchanged at $6.22:
| Illustrative Verizon Return Forecasts
Source: Librarian Capital estimates. |
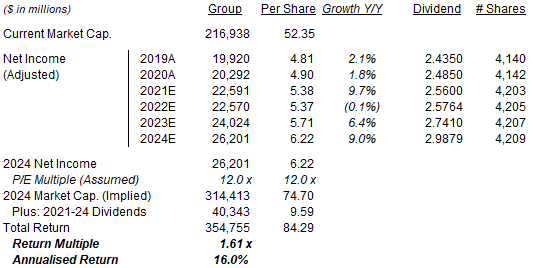
With shares at $52.35, we expect an exit price of $75 and a total return of 61% (16.0% annualized) by 2024 year-end.
Is Verizon Stock A Good Buy? Conclusion
Verizon had a solid Q3, with revenues up 5.5% year-on-year (excluding Verizon Media), and 2021 EPS growth outlook was raised to 9-10%.
In the large Consumer segment, Wireless and Wireline net adds both continued to improve, and EBITDA grew 2.0% year-on-year.
In the smaller Business segment, EBITDA was sequentially stable, with growth in Wireless offsetting a small decline in legacy Wireline.
30%+ of Consumer Wireless accounts are now on premium unlimited, and group fixed wireless customers grew another 55K to 150K.
At $52.35, Verizon stock has a 10x P/E and a 4.9% Dividend Yield. We expect a total return of 61% (16.0% annualized) by end of 2024.
We reiterate our Buy rating on Verizon Communications Inc.
Note: A track record of my past recommendations can be found here.