
naphtalina/iStock via Getty Images
Tri-Continental Corporation (NYSE:NYSE:TY) is definitely a long-term survivor. It was created in 1929 during the closed-end fund "mania" of the time and is still around today. The Fund's investment manager is currently Columbia Management Investment Advisers LLC, which is a wholly-owned subsidiary of Ameriprise Financial (AMP).
TY is a balanced fund. It targets long-term capital growth with current income. The portfolio largely consists of large cap equities with a value tilt, but the Fund also has the flexibility to invest across the capital structure to produce the best risk/reward profile.
In some ways, TY is similar to Vanguard's Wellington Fund, but because of its closed-end structure it uses a small amount of leverage and also has the flexibility to invest in common and preferred stock, convertible securities, debt securities, repurchase agreements, foreign issues and derivatives which include options, futures contracts, equity-linked notes, illiquid securities and emerging market issues.
As a balanced fund, TY is less volatile than its equity CEF peers.
Here is the 12-month market volatility of TY compared to some large equity CEFs:
12 Month Volatility: TY Versus Some Equity CEF Peers
TY | 11.08% |
GAM | 12.91% |
BIF | 12.97% |
CET | 13.07% |
GDV | 14.73% |
Source: cefanalyzer
Investment Process
TY uses robust sector and industry-specific models to rank stocks based on three broad factors: Quality, Valuation and Catalysts.
- Quality looks at things like earnings strength and consistency.
- Valuation looks at various ratios and earnings and cash flow trends.
- Catalysts look at price momentum and business momentum.
A portion of the fund is primarily computer-driven using proprietary models. It's fully invested and doesn't factor in human judgment or macroeconomic trends.
The other portion of the fund is driven by human judgment and uses bottom up analysis. They take a holistic view, exploring all types of securities issued by one company to determine the best risk/reward profile for the portfolio.
The fund managers try to deliver consistent competitive returns, regardless of market conditions, with a comfortable degree of risk.
Distribution Policy
TY has paid dividends on its common stock for 77 consecutive years.
The fund has an earned distribution policy which means it makes distributions that are approximately equal to the distributions from the underlying portfolio, less the fund's expenses and dividends payable on the preferred stock.
Here is the distribution history since 2015:
YEAR | INCOME | CAP GAINS | RETURN OF CAPITAL | TOTAL |
2015 | $0.81 | $0.00 | $0.00 | $0.81 |
2016 | $0.91 | $0.00 | $0.00 | $0.91 |
2017 | $1.07 | $0.10 | $0.00 | $1.17 |
2018 | $0.96 | $0.95 | $0.00 | $1.91 |
2019 | $1.016 | $0.918 | $0.00 | $1.934 |
2020 | $1.0657 | $0.5698 | $0.00 | $1.6355 |
YTD | $0.7829 | $0.00 | $0.00 | $0.7829 |
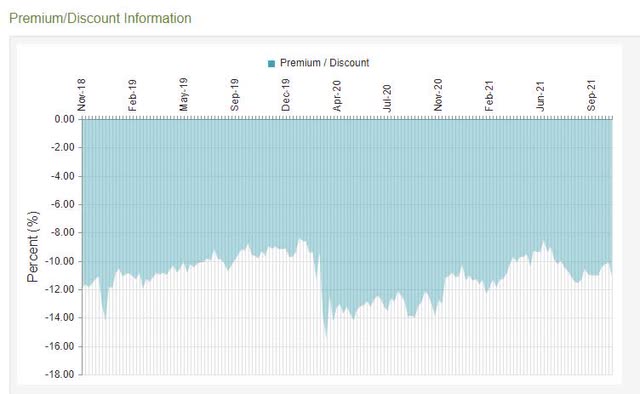
TY: Three year Discount History
Total Return Performance
Here is the trailing total return NAV and price performance record of TY compared to its peers in the Allocation 70-85% Equity category.
TY NAV Performance | TY Price Performance | Allocation 70%-85% Equity NAV | Rank in Category (NAV) | |
3-month | 2.60% | 2.65% | 3.97% | 100 |
YTD | 19.83% | 20.53% | 19.45% | 34 |
1-Year | 37.42% | 43.25% | 38.23% | 67 |
3-Year | 16.84% | 17.42% | 17.63% | 67 |
5-Year | 15.01% | 17.05% | 14.79% | 34 |
10-Year | 13.18% | 14.52% | 12.48% | 1 |
15-Year | 7.89% | 8.67% | 7.88% | 1 |
Source: Morningstar (as of Oct 31, 2021)
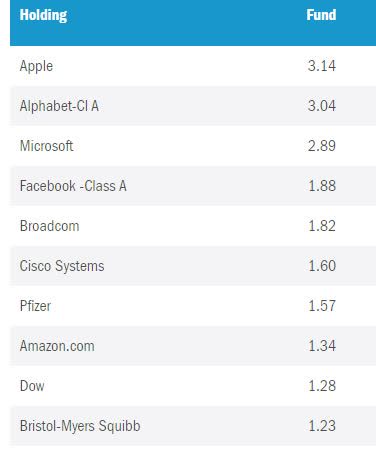
TY- Top Ten Holdings
The top ten holdings comprise 20% of the fund's 243 total holdings. The fund tends to hold many of the biggest stocks in the S&P 500, but tends to avoid or underweight some richly valued growth stocks like TSLA, AMZN and NFLX.
NAV Correlations Compared to Other Funds
I looked at the NAV correlations of TY compared with some other CEFs and ETFs. TY falls into the large-cap value box on Morningstar.
TY versus TILT 97% Flexshares Market Factors Tilt Index Fund
TY versus FVAL 96% Fidelity Value Factor ETF
TY versus SPY 93% S&P 500
TY versus CII 96% Blackrock Enhanced Capital & Income CEF
TY versus JVAL 94% JP Morgan US Value Factor ETF
TY versus QQQ 68% Invesco QQQ Trust
Source: cefanalyzer
Tri-Continental Corporation
Inception Date: Jan. 14, 1929
Total Investment Exposure= $2.08 Billion
Total Common Assets= $2.04 Billion
Baseline Expense ratio= 0.48%
Expense ratio with preferred dividend, acquired funds= 0.68%
Discount= -11.09%
Annual Distribution Rate (NAV) = 3.62%
Annual Distribution Rate (market price) = 4.05%
Distribution Frequency= Quarterly
Dividend Yield Enhancement Alpha= +0.43%
Adjusted Baseline Expense Ratio= +0.05%
Effective Leverage= 1.82%
Average Daily Volume= 27,184
Average Dollar Volume= $940,000
Summary
TY is a good holding here for investors who want to stay invested in the market, but are concerned about the frothy environment. It is the kind of fund that lets you sleep well at night.
I would try to purchase TY at an 11% discount or higher. It can be an excellent holding for long-term buy and hold investors looking for a lower risk way to participate in the equity market. TY has one of the lowest expense ratios in the closed-end fund universe.
Marketplace Service For Those Hunting For Yield
George Spritzer's top investment ideas are being featured on Alpha Gen Capital's "Yield Hunting" marketplace service.
This service is dedicated to yield/income investors who wish to avoid market froth. We encourage investors to benefit from yield opportunities within closed-end funds, business development companies, and other niche areas. For safe and reliable income streams, check out Yield Hunting.