After completing my end-of-quarter reports I thought I'd share a summary of all four portfolios. What follows are normalized results.
I see each portfolio as a real-time, real money, non-repeatable experiment ... despite the fuzziness that entails, I continue to learn.
DGP-1:
- Portfolio inception: 31 March 2011 (after market close).
- Date fully invested: 31 March 2013 (chart starts with fully invested date).
- Funding source: TSP to tIRA rollover.
- Companies (current): 52: BDX, BNS, BTI, CAH, CASS, CBRL, CLX, CM, CVS, D, DLR, ED, EMR, ES, FAST, FLO, GIS, GWW, HAS, HRL, JNJ, KMB, KMI, KTB, LMT, LOW, MCD, MDT, MO, NNN, O, OGE, PEP, PG, PM, QCOM, SO, T, TGT, TROW, TRP, TXN, UGI, UNP, VFC, VTR, VZ, WEC, WELL, WPC, WTR, XOM
- Summary: Actively managed, no additional contributions, no withdrawals.
- Metrics: 5-year weighted Beta: 0.68; dividend yield 3.97%-3.99%; organic div growth rate: 7.02%; weighted div safety score 74.
- Most recent published report: DGP-1: 2020 First Quarter Review
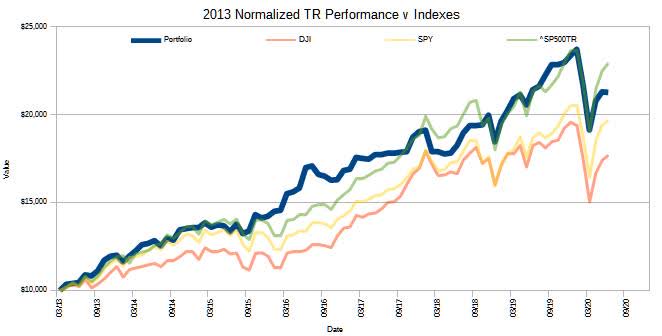 DGP-1 Normalized Performance, 31 March 2013 to 30 June 2020.
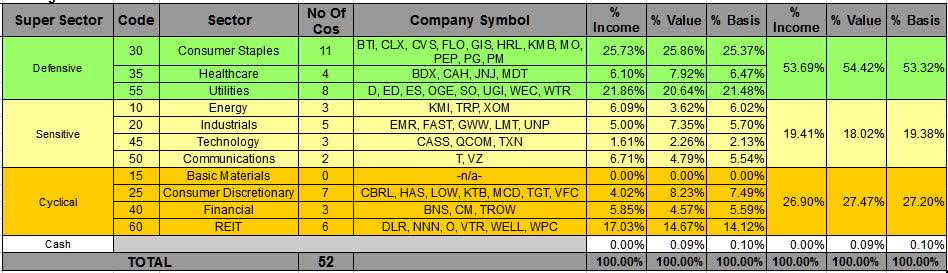
DGP-1 Super Sector Allocation.
October 2022 Update
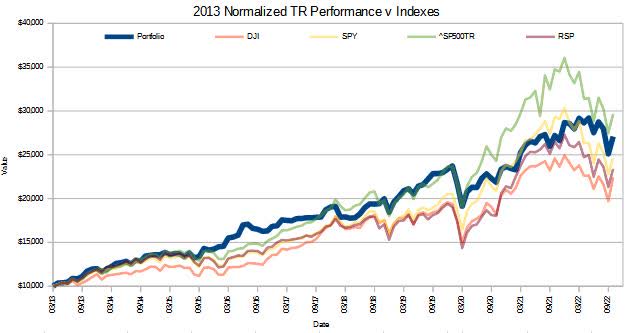
DGP-1 Normalized Performance, 31 March 2013 to 31 October 2022.
At the end of October, DGP-1 had 68 holdings: ABBV, AMT, ASG, BCX, BIP, BNS, BST, BUI, CAH, CASS, CCI, CEF, CLX, CM, CVS, D, DLR, DNP, DUK, ED, EMR, ES, EVRG, FAST, FLO, GIS, GLW, HRL, INTC, JNJ, KMB, KMI, LMT, LOW, MCD, MDT, MO, NEM, NNN, O, OGE, PBA, PEP, PG, PM, PRU, RFI, RY, SJM, SLF, SO, SRUUF, T, TD, TGT, TROW, TRP, TU, TXN, UGI, UNP, UTF, UTG, VZ, WBD, WEC, WPC, XOM
DGP-2:
- Portfolio inception: 31 August 2014 (after market close).
- Date fully invested: 31 August 2014.
- Funding source: existing (conversion) ROTH.
- Companies (current): 21: BNS, BTI, CSCO, D, DLR, ES, GIS, KMI, MDU, MO, NNN, O, OGE, PEP, PFE, SO, T, VZ, WEC, WPC, XOM
- All companies are targeted as full basis - except KMI which is targeted as half basis.
- Summary: Actively managed, no additional contributions, no withdrawals.
- Metrics: 5-year weighted Beta: 0.59; dividend yield 4.60%-4.65%; organic div growth rate: 7.48%; weighted div safety score 70.
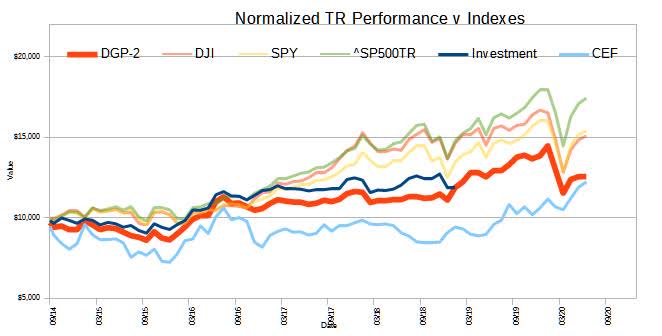
DGP-2 Normalized Performance, 31 August 2014 to 30 June 2020.
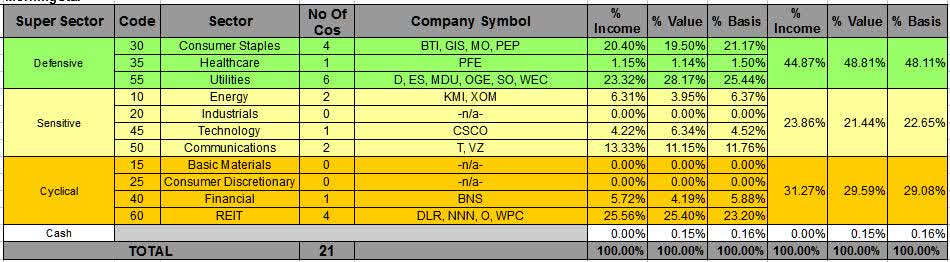 DGP-2 Super Sector Allocation.
DGP-3:
- Portfolio inception: 31 August 2014 (after market close).
- Date fully invested: 31 August 2014.
- Funding source: existing (contributory) ROTH.
- Companies (current): 20.
- Targeted full basis (20+ years of div growth): ADM, IBM, KO, MCD, MO, O, PEP, SO, TGT, TROW, WPC
- Targeted half basis (less than 20 years of div growth): BTI, D, DLR, GIS, LNT, OGE, PM, WEC, XEL (will be adding at least two companies)
- Summary: Actively managed, no additional contributions, no withdrawals.
- Metrics: 5-year weighted Beta: 0.67; dividend yield 4.01%-4.06%; organic div growth rate: 6.17%; weighted div safety score 71.

DGP-3 Normalized Performance, 31 August 2014 to 30 June 2020.
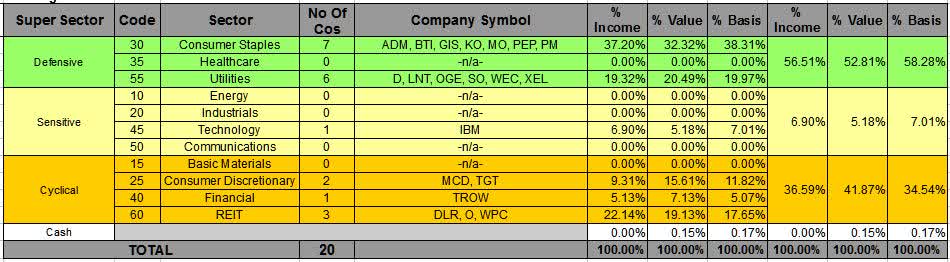 DGP-3 Super Sector Allocation.
DGP-4:
- Portfolio inception: 31 Dec 2017 (after market close).
- Date fully invested: 31 Dec 2017.
- Funding source: existing taxable account.
- Companies (current): 15: AFL, AJG, AMNF, DUK, HRL, JNJ, KO, MCD, MSFT, O, PFE, PM, RPM, T, XOM
- Summary: Passively managed, dividend investment only, no additional contributions, no withdrawals.
- Metrics: 5-year weighted Beta: 0.73; dividend yield 3.36%-3.38%; organic div growth rate: 5.33%; weighted div safety score 72.
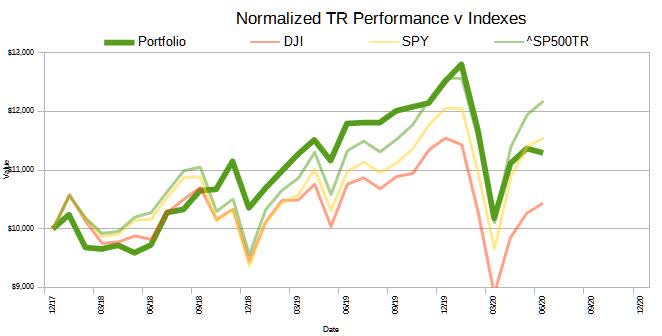
DGP-4 Normalized Performance, 31 December 2017 to 30 June 2020.

DGP-4 Super Sector Allocation.
Perspectives on Performance
One of the reasons I run different portfolios is to get a feel for how different DG investment techniques perform ... which implies I should -in some fashion- compare the results.
The following charts attempt to do that.
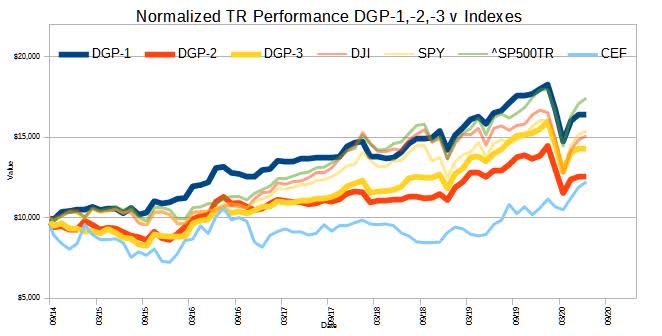
- I created DGP-2 and DGP-3 after close of business 31 August 2014. The following chart shows the relative performance of DGP-1, DGP-2, and DGP-3 assuming I'd invested $10,000 in each on that date.
- I created DGP-4 after close of business 31 December 2017. The following chart shows the relative performance of DGP-1, DGP-2, DGP-3, and DGP-4 assuming I'd invested $10,000 in each on that date.
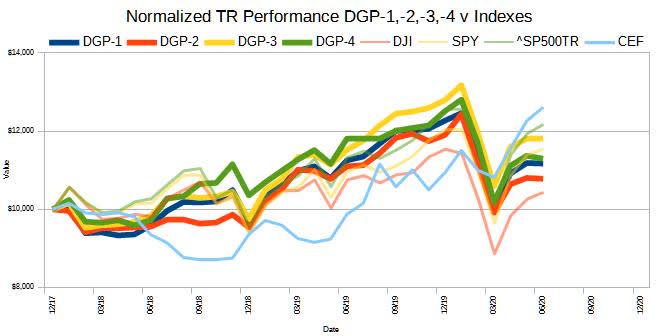
To keep things interesting, I also compare portfolio results to the Dow Jones Industrial Average, the SPDR S&P 500 ETF Trust, the S&P 500 Total Return index, and CEF (the Sprott Physical Gold and Silver Trust which I use as a proxy for precious metals). In each case the results are normalized by assuming I invested $10,000 in each on the start date.
From inception until early 2019, DGP-2 held 25% to 33% of its total value as shares of CEF.
Observations
- During the (very long pre-COVID-19) bull market DGP-1 has roughly matched the S&P 500 Total Return index, sometimes a bit ahead, and at other times a bit behind.
- In the last 2-1/2 years, DGP-3 performed better than expected.
- In the last 2-1/2 years, due to the COVID-19 recession, CEF did best ... but if measured from August 2014, it significantly underperformed.
Notes
On Yahoo! Finance:
- the Dow Jones Industrial index is ^DJI;
- the SPDR S&P 500 ETF is SPY; and
- the S&P 500 Total Return index is ^SP500TR