The first rule of investing is known as The Golden Rule of Investing or save as much as you can as early as you can. The operative word is early. Once a saving plan is in order one of the next decisions is whether to hire a money manager or do it yourself. It is safe to assume Seeking Alpha readers are primarily do-it-yourself investors.
Another major decision is whether to construct the portfolio using individual stocks and bonds or go the route of index securities. My personal preference is to use non-managed index ETFs and I come to this conclusion after much research. This is not to say stock investing cannot be done successfully.
One more decision is whether or not to actively manage the portfolio or take the passive route. This is a difficult decision and I watch over both passive and active portfolios. The following analysis is one where the portfolio is actively managed.
Whether actively or passively managed, one needs to select securities as the portfolio building blocks. This is where Swensen and Faber come into play. While Swensen does not recommend specific ETFs or index funds, he provides information that is so specific to asset classes one can easily ferret out ETFs that match his asset class recommendations. The "Swensen Six" ETFs are identified in this Seeking Alpha article. The Faber Five include ETFs familiar to SA readers and there is overlap with the Swensen recommendations.
Putting the Swensen and Faber ETFs together and adding a few, we come up with the Baker's Dozen. Before going further with this momentum tranche model, the basis for this portfolio model began with a lot of research that started in part with The Feynman Study. Additional research was conducted on Antonacci's Dual Momentum model.
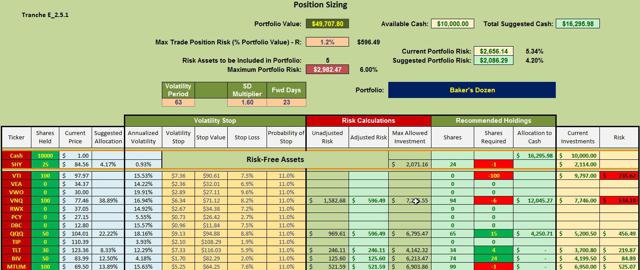
Below are two worksheets that come out of the Kipling Tranche 2.5.1 spreadsheet. The first worksheet makes use of the Dual Momentum model developed by Gary Antonacci. In addition it includes information on the ITA Risk Reduction model.
Tranche Recommendations: This worksheet ranks the ETFs based on 60 and 100 trading day look-back periods as well as volatility. These periods were selected after months of back-testing using in-sample and out-of-sample experiments.
The last two trading days of data (1/9 and 1/10) recommend BIV and TLT, or ETFs that fall into the Bonds and Income asset class. Further back in the pack are VNQ, QQQ, and MTUM with SHY showing up in the fifth offset portfolio.
If we look at the price of each ETF compared to its 195-Day Exponential Moving Average (EMA), we focus on BIV, TLT, and VNQ. These three ETFs are the only ones showing positive "Golden Cross" (X/O column) signs. Commodities (DBC) and emerging markets (VWO) are completely out of the picture. Both ETFs also have very high negative absolute acceleration percentages.
Position Sizing Recommendations: The position sizing worksheet pays attention to what risk is involved with each individual security.
Recommendations coming out of this position sizing worksheet include: SHY, VNQ, QQQ, TLT, BIV, and MTUM. Until this market shows more strength to the upside, my inclination is to stick with TLT, BIV, and some exposure to VNQ. I'm less inclined to pursue QQQ and MTUM based on data from last Friday. This well could change after today's data is available later this evening.
If you are looking for a portfolio built around the Swensen and Faber ETFs that pays attention to the Return/Risk ratio, take a serious look at this quiver of investments and the Momentum-Tranche-Position Sizing model. To learn more about the spreadsheet used in this analysis, go to this link.

