Abbreviations
NG: working (dry) natural gas
Withdrawal season: months from November to March
Injection season: months from April to October
Withdrawal: net change of NG storage amount (BCF) in withdrawal season
Injection: net change of NG storage amount in injection season
EIA: Energy Information Administration
Bcf: billion cubic feet
According to http://www.eia.gov/EIA's weekly NG storage report, we have NG storage number 822 Bcf on 28th March and 826 Bcf on 4th April, 2014 (end of withdrawal season) which was barely above 2003's 733 Bcf. Can the depleted NG storage be normalized before the coming winter? And how will it affect thermal coal industry? This is an interesting question. In order to store more NG underground, we need either produce more or consume less, or both. In this article, I am going to analyze the situation with the help of figures and tables prepared by myself from EIA data.
I summarized NG storage numbers at the ends of withdraw and injection seasons since 2000 in Figure 1. We can see clearly that at the end of March, 2014 we only have NG storage about half of 5-years average and one third of that in 2012.
Fig. 1 Working (Dry) Natural Gas Storage at Ends of Withdrawal and Injection Seasons

In the past, NG shortage at the end of each withdrawal season would be restored to normal during the following injection season, which is demonstrated in Figure 2.
Fig. 2 Comparisons of Natural Gas Withdrawal and Injection Amount by Seasons
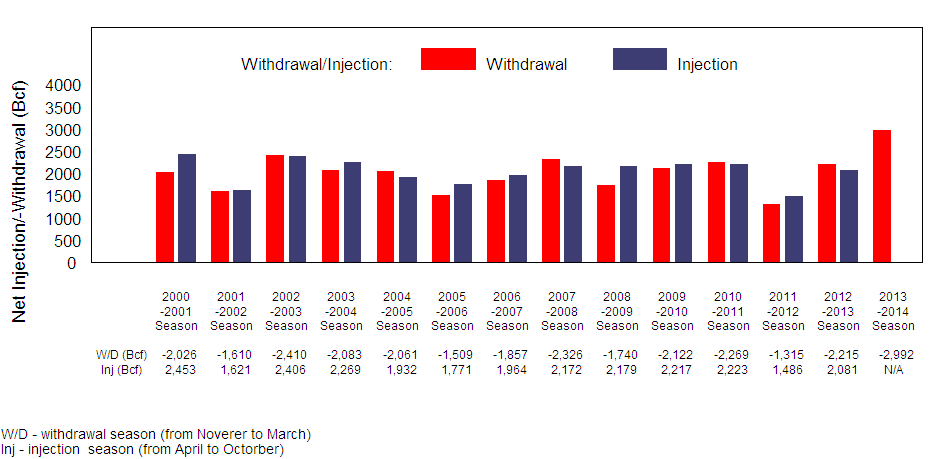
Figure 3 illustrates that dry natural gas production increases year over year at varying single digit rate since 2006 (starting of shale gas boom). But 2013 has a miserable 0.9 percent increase over 2012. With the recent natural gas price hike, it is expected that more dry gas production capacity will be brought online. According to EIA, dry gas production is estimated with ~ 3% increase in 2014.
Fig. 3 Working Natural Gas Productions from 2001 to 2013
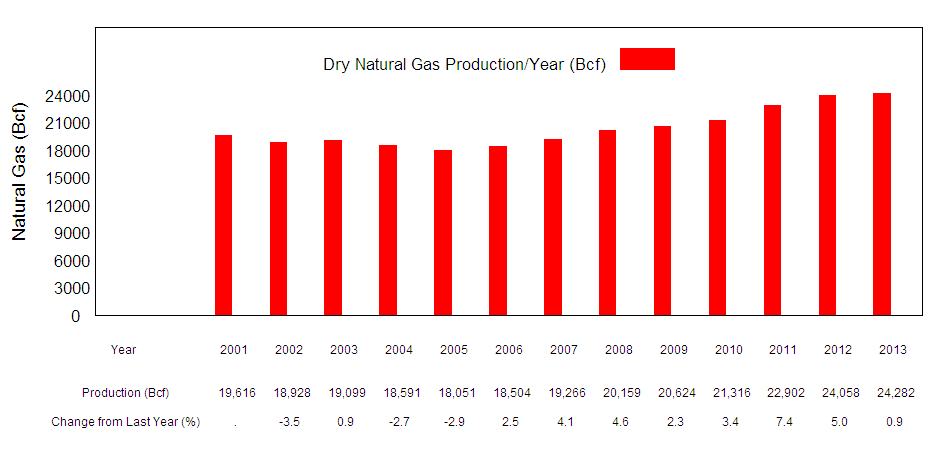
Figure 4 summarize NG end uses since 2001.It is obvious that Electric Power end use is in the up-trend since 2006 with the boom of shale gas.
Fig 4 U.S. Natural Gas Consumption by End Use over Years (2001 -2013)

NG Residential and Commercial end uses (Utility end use) are closely correlated with weather. In withdrawal season (winter), a colder winter would burn more NG for heating (residential and commercial), while in injection season (summer). NG usage in residential and commercial varies not as much as in winter (Figure 5).
Fig 5 U.S. Natural Gas Residential and Commercial Consumptions by Withdrawal or Injection Seasons

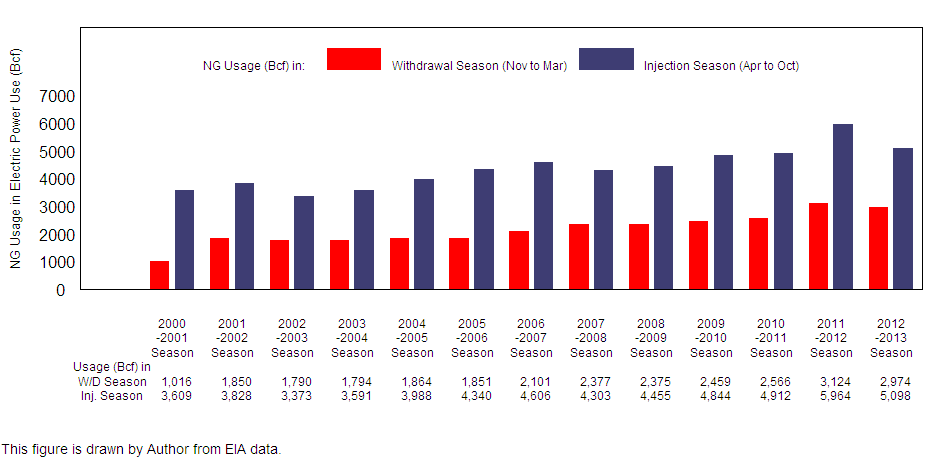
In injection season (summer), a hotter summer would consume more electricity for cooling typically calling for NG fired turbines in a quick response during peak hours. Please note, as shown in Figure 6, NG Electric Power usage is in an up-trend since 2006. But in 2012 summer, Electric Power consumed much more NG due to a drop in NG price.
Fig 6. U.S. Natural Gas Electric Power Consumptions by Withdrawal or Injection Seasons
Rebuilding of the deleted natural gas storage comes from two sides; simply as common sense telling us:
- Increase NG production. EIA projects a 3% NG production increase in 2014 over 2013. Dry natural gas production in 2013 was 24,282 Bcf, 3% of which would be 728 Bcf. But we only can take part of 728 Bcf into our calculation, because injection season only has seven months. So only 425 Bcf could contribute to the build-up of NG storage by the end of October, 2014.
- Reduce natural gas uses, in author's view, mainly from electric power use.
Building up NG Stock to EIA projection 3,422 Bcf at the ending of October, 2014 is challenging.
In order to better address the possibility if EIA's target can be reached, author prepared following tables for the convenience of discussion. EIA in its Short-Term Energy and Summer Fuels Outlook (STEO April-2014) projects a target of 3,422 Bcf at the ending of Oct, 2014. This represents a record stock build of nearly 2,600 Bcf. This is not an ambitious number as it is not only below the 5-year average (3,842) but also short of 5-year minimum (3,804), referencing Table 3.
Table 1. Natural Gas Storage Net Changes by Withdrawal/Injection Seasons during 2008 -2014 | ||||||
Year | Season | Net Change | Average/month | Minimum/month | Maximum/month | |
2008-2009 | 2009_Withdrawal | -1,740 | -348 | -57 | -705 | |
2009 | 2009_Injection | 2,179 | 311 | 167 | 467 | |
2009-2010 | 2010_Withdrawal | -2,122 | -424 | 33 | -811 | |
2010 | 2010_Injection | 2,217 | 317 | 186 | 410 | |
2010-2011 | 2011_Withdrawal | -2,269 | -454 | -74 | -799 | |
2011 | 2011_Injection | 2,223 | 318 | 212 | 399 | |
2011-2012 | 2012_Withdrawal | -1,315 | -263 | 38 | -544 | |
2012 | 2012_Injection | 1,486 | 212 | 134 | 290 | |
2012-2013 | 2013_Withdrawal | -2,215 | -443 | -125 | -721 | |
2013 | 2013_Injection | 2,081 | 297 | 136 | 418 | |
2013-2014 | 2014_Withdrawal | -2,992 | -598 | -211 | -967 | |
Note: Withdrawal Season: November - March; Injection Season: April - October. | ||||||
Table is compiled from EIA data. | ||||||
Table 2. Natural Gas Storage Net Changes by Withdrawal/Injection Seasons combining 2008 -2013 | ||||||||
95% Confidence Interval | ||||||||
Season | Average | Minimum | Maximum | Low Limit | High Limit | |||
Withdrawal | -2,109 | -1,315 | -2,992 | -2,699 | -1,518 | |||
Injection | 2,037 | 1,486 | 2,223 | 1,648 | 2,426 | |||
Note: Withdrawal Season: November - March; Injection Season: April - October. | ||||||||
95% confidence interval is computed assuming net changes are normally distributed over years by seasons. | ||||||||
| and should be interpreted with caution. Readers without statistic knowledge may ignore these numbers. | ||||||||
Table is compiled by EIA data. | ||||||||
Table 3. Natural Gas Storage at the End of Withdrawal/Injection Season | ||||||
from 2008 (November) to 2013 (October) | ||||||
Season | Average | Minimum | Maximum | |||
Withdrawal End - March | 1,817 | 1,577 | 2,473 | |||
Injection - End - October | 3,842 | 3,804 | 3,929 | |||
Note: Withdrawal Season: November - March; Injection Season: April - October. | ||||||
Table is compiled by EIA data. | ||||||
From Table 2, we know that the average net injection amount is 2,037 Bcf and maximum is 2,426 Bcf in the last five injection seasons. If we take the 5-year average injection 2,037 Bcf plus expected 3% NG production of 425 Bcf as we discussed earlier, we get 2,462 Bcf, which is close to EIA's estimation, i.e., 2,600 Bcf. But as shown in Figure 4, Other, Industry and Electric Power end uses are increasing in the last several years, in which Other and Industry end uses may not be easily reduced due to the current relatively low NG price. The only option is the reduction of NG in Electric Power end use, which is always price sensitive. This is illustrated in Figure. 4 and 6, where we can see that NG usage reduction over the last decade in the Electric Power usage in 2003, 2008 and 2013 injection seasons was directly correlated with NG price hike (Table. 6). I picked up 2001-2001 and 2002 to 2003 withdrawal and injection seasons to demonstrate how low NG storages were normalized. In Table 4, we can see that after a historical 2002-2003 winter withdrawal of 2,410 Bcf, a robust summer injection of 2,405 Bcf brought the NG storage ending October, 2003 to 3,130 Bcf that was very close to that in 2012 (3,115 Bcf). In this season, total injection had an increase of 784 Bcf against that in 2001-2002 injection season, which was achieved by a reduction of end uses totaling 886 Bcf. Electric Power use reduction contributed 455 Bcf which was about half of total end uses reduction.
Table 4. Comparison of NG W/D, Injection, Storage and End Uses by Two Selected Seasons | |||||
Changes of 2002-2003 Season | |||||
Over 2001-2002 Season | |||||
Season | Natural Gas | 2001 - 2002 | 2002 - 2003 | Bcf Chg | % Chg |
Withdrawal | Total Withdrawal | -1,609 | -2,410 | -801 | 49.8 |
(Nov-Mar) | Storage at End of Season | 1,517 | 730 | -787 | -51.9 |
Total NG consumed | 10,809 | 11,691 | 882 | 8.2 | |
Utility | 4,942 | 5,862 | 920 | 18.6 | |
Other | 780 | 797 | 17 | 2.2 | |
Industry | 3,236 | 3,241 | 5 | 0.2 | |
Electric Power | 1,849 | 1,790 | -59 | -3.2 | |
Injection | Total Injection | 1,621 | 2,405 | 784 | 48.4 |
(Apr-Oct) | Storage at End of Season | 3,115 | 3,130 | 15 | 0.5 |
Total NG consumed | 11,746 | 10,860 | -886 | -7.5 | |
Utility | 2,664 | 2,572 | -92 | -3.5 | |
Other | 995 | 953 | -42 | -4.2 | |
Industry | 4,258 | 3,961 | -297 | -7 | |
Electric Power | 3,827 | 3,372 | -455 | -11.9 | |
Table 5 gives another big winter withdrawal of 2,325 Bcf in 2007-2008 withdrawal season, a summer injection of 2,171 Bcf brought the NG storage ending October, 2008 to 3,399 Bcf that was smaller to that in 2007 (3,565 Bcf) though. In this season, total injection had an increase of 208 Bcf against that in 2006-2007 injection season, which was achieved by a reduction of end uses totaling 206 Bcf. Electric Power use reduction contributed 303 Bcf which was more than of total end uses reduction. In that summer residential and commercial (utility) end uses consumed 88 Bcf more NG due to a hotter summer taking more NG fired turbine on duty during peak hours.
Table 5. Comparison of NG Withdrawal, Injection, Storage and End Uses by Two Selected Seasons | |||||
Changes of 2007-2008 Season | |||||
Over 2006-2007 Season | |||||
Season | Natural Gas | 2006 - 2007 | 2007 - 2008 | Bcf Chg | % Chg |
Withdrawal | Total Withdrawal | -1,856 | -2,325 | -469 | 25.3 |
(Nov-Mar) | Storage at End of Season | 1,603 | 1,266 | -337 | -21 |
Total NG consumed | 11,059 | 11,749 | 690 | 6.2 | |
Utility | 5,222 | 5,449 | 227 | 4.3 | |
Other | 801 | 850 | 49 | 6.1 | |
Industry | 2,933 | 3,070 | 137 | 4.7 | |
Electric Power | 2,100 | 2,376 | 276 | 13.1 | |
Injection | Total Injection | 1,963 | 2,171 | 208 | 10.6 |
(Apr-Oct) | Storage at End of Season | 3,565 | 3,399 | -166 | -4.7 |
Total NG consumed | 11,698 | 11,492 | -206 | -1.8 | |
Utility | 2,378 | 2,466 | 88 | 3.7 | |
Other | 1,045 | 1,042 | -3 | -0.3 | |
Industry | 3,671 | 3,683 | 12 | 0.3 | |
Electric Power | 4,606 | 4,303 | -303 | -6.6 | |
The changes of the NG end uses are essentially driven by change of NG price. A NG price hike makes people believe that storing it for latter use is more profitable than consuming it now. Table 6 summarizes the average NG prices and their changes in three inject seasons. It is obvious that it was the huge NG price hikes in 2003, 2008 and 2013 caused the reduction of total NG consumption (mainly from Electric Power) thereafter helping to bring the NG storage back to normal by the end of inject seasons.
Table 6. Comparisons of Average Natural Gas Prices and Percent Changes in Selected Injection Seasons | ||||||||||||
Wellhead | Import | Residential | Commercial | Industry | Electric Power | |||||||
Price | Chg | Price | Chg | Price | Chg | Price | Chg | Price | Chg | Price | Chg | |
Year | $/mcf | % | $/mcf | % | $/mcf | % | $/mcf | % | $/mcf | % | $/mcf | % |
2002 | 2.96 | . | 3.11 | . | 9.34 | . | 6.61 | . | 3.87 | . | 3.71 | . |
2003 | 4.73 | 59.8 | 4.91 | 57.9 | 11.66 | 24.8 | 8.64 | 30.7 | 5.65 | 46 | 5.42 | 46.1 |
2007 | 6.1 | 6.63 | 15.47 | 11.36 | 7.39 | 7.25 | ||||||
2008 | 8.65 | 41.8 | 9.57 | 44.3 | 17.79 | 15 | 13.69 | 20.5 | 10.55 | 42.8 | 9.83 | 35.6 |
2012 | 2.51 | 2.59 | 13.66 | 8.29 | 3.5 | 3.39 | ||||||
2013 | NA | NA | 3.61 | 39.4 | 14.13 | 3.4 | 8.75 | 5.5 | 4.65 | 32.9 | 4.43 | 30.7 |
Note: Price is the average of 7 months' prices from April to October in the injection season of the year. | ||||||||||||
% of price changes is 2003 over 2002, 2008 over 2007 and 2013 over 2012. | ||||||||||||
In order to compare the 2013-2014 withdrawal/injection season with the past ones, author prepared Table 7 listing the last five withdrawal and injection seasons NG data in the similar format as Table 4 and 5 except without comparison of changes between seasons. Please note that NG consumption data for Jan, Feb. and March of 2014 were not available yet when writing this article. Here I only put two EIA projected numbers (Bold and Italic) in the corresponding cells for the convenience of discussion.
Table 7 Dry Natural Gas Withdrawal, Injection, Storage and End Uses in the Last Five Seasons
Season | Natural Gas | 2008-2009 | 2009-2010 | 2010-2011 | 2011-2012 | 2012-2013 | 2013-2014 |
Withdrawal | Total Withdrawal | -1,739 | -2,121 | -2,268 | -1,314 | -2,215 | -2,992 |
(Nov-Mar) | Storage at End of Season | 1,659 | 1,652 | 1,577 | 2,473 | 1,723 | 822 |
Total NG consumed | 11,501 | 11,701 | 12,258 | 11,960 | 12,612 | ||
Utility | 5,510 | 5,404 | 5,701 | 4,768 | 5,455 | ||
Other | 872 | 869 | 898 | 935 | 954 | ||
Industry | 2,741 | 2,966 | 3,092 | 3,133 | 3,228 | ||
Electric Power | 2,374 | 2,459 | 2,566 | 3,123 | 2,974 | ||
Injection | Total Injection | 2,178 | 2,217 | 2,222 | 1,486 | 2,080 | 2,600 |
(Apr-Oct) | Storage at End of Season | 3,809 | 3,850 | 3,803 | 3,929 | 3,815 | 3,422 |
Total NG consumed | 11,409 | 11,965 | 12,332 | 13,471 | 12,880 | ||
Utility | 2,469 | 2,253 | 2,401 | 2,239 | 2,430 | ||
Other | 1,090 | 1,098 | 1,135 | 1,207 | 1,216 | ||
Industry | 3,396 | 3,770 | 3,883 | 4,060 | 4,135 | ||
Electric Power | 4,455 | 4,844 | 4,912 | 5,964 | 5,098 |
Can EIA's target of 3,422 Bcf be reached ending this October? In author's opinion, it is challenging, but achievable with only some conditions to be met.
- 3% increase in 2014 of natural gas production is a must (author is positive on this), which would contribute about 425 Bcf to NG storage in 7-months long injection season. Any NG production interruption by weather or from infrastructures issue is negative.
- A normal summer is helpful as average electric power generation use typically by NG fired turbines during peak hours.
- Industry NG use remains the same or increases normally as in the last three years.
- Electric Power usage should be kept at least 2013 year level or further reduce 200 Bcf in during the injection season.
- Import more NG is an option too.
As a matter of fact, this is what people expects now and is detailed by author's calculation in the figures and tables here.
In short, 2013-2014 bad winters cost us an extra ~ 800 Bcf dry natural gas than normal. The deficit most likely will be compensated by using more thermal coal in Electric Power generation in coming months, which is the background of the recent improved price movement of thermal coal, especially PRB coal. As 800 Bcf natural gas translates into roughly 40 - 50 million metric ton of thermal coal (heat content of coal varies), this is of course good news for thermal coal leveraged miners such as
Arch Coal Inc (ACI), Peabody Energy Corporation (BTU), Alpha Natural Resources, Inc. (ANR), CONSOL Energy Inc. (CNX) and Cloud Peak Energy Inc (CLD) in near future. In ACI 2014 first Quarter earning release, the management said '…we expect coal consumption for power generation to grow by 25 million tons or so this year compared to 2013 levels'. There could be more need for thermal coal in rebuilding multi-year low coal stock at the power plants before this coming winter. In a note Power plant coal stockpiles are expected to rebuild after heavy winter drawdown released on April 24, 2014, EIA said "Coal stockpiles at electric power plants experienced a steep drawdown this winter, falling 24% between November 2013 (156 million tons) and February 2014 (119 million tons), ending at the lowest level since March 2006. A main reason for this reduction was increased electricity demand because of the colder-than-normal weather. Total U.S. net electricity generation was 5.3% higher this winter (November-February) than last winter, with 59% of the increase supplied by coal generation, which was up 8% year-over-year, or by 40,000 gigawatthours.". This resulted in an increase of almost 18 million tons of thermal coal consumption in power plants during the last four months as set out below in Table 8.
.
Table 8. Coal Consumption for Electricity Generation, | ||||||
by Sector, 2004-February 2014 (Thousand Tons) | ||||||
Year | Month | Total (all sectors) | Electric Utilities | Independent | Commercial | Industrial |
2012 | November | 69,913 | 51,276 | 18,245 | 25 | 366 |
2012 | December | 73,217 | 54,516 | 18,275 | 27 | 398 |
2013 | January | 74,985 | 55,784 | 18,811 | 31 | 359 |
2013 | February | 67,141 | 49,137 | 17,629 | 28 | 347 |
Total | 285,256 | 210,713 | 72,960 | 111 | 1,470 | |
2013 | November | 65,902 | 49,712 | 15,797 | 22 | 371 |
2013 | December | 77,283 | 56,761 | 20,096 | 25 | 401 |
2014 | January | 83,710 | 62,409 | 20,839 | 34 | 429 |
2014 | February | 76,350 | 56,180 | 19,747 | 32 | 391 |
Total | 303,245 | 225,062 | 76,479 | 113 | 1,592 | |
Difference | 17,989 | 14,349 | 3,519 | 2 | 122 | |
Source: EIA Electric Power Monthly, (March, 2014) table 2.1.A. Total and Difference are calculated by author. All in all, the sever 2013 - 2014 winter not only brought natural gas storage to its 13-years low, but also burned down coal stockpiles in the power plants with a deficit of 55 million tons at the end of February, 2014 compared with its 5-year average (see EIA figure and Table 9 below).
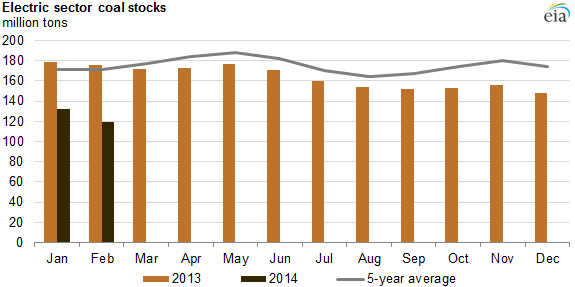
Table 9. Stocks of Coal by Coal Rank: | |||||
Electric Power Sector, 2004 - February 2014 | |||||
Electric Power Sector (thousand Tons) | Difference | ||||
Period | Bituminous Coal | Subbituminous Coal | Lignite Coal | Total | from 5-year Average |
End of Year Stocks | |||||
2004 | 49,022 | 53,618 | 4,029 | 106,669 | |
2005 | 52,923 | 44,377 | 3,836 | 101,137 | |
2006 | 67,760 | 68,408 | 4,797 | 140,964 | |
2007 | 63,964 | 82,692 | 4,565 | 151,221 | |
2008 | 65,818 | 91,214 | 4,556 | 161,589 | |
2009 | 91,922 | 92,448 | 5,097 | 189,467 | |
2010 | 81,108 | 86,915 | 6,894 | 174,917 | |
2011 | 82,056 | 85,151 | 5,179 | 172,387 | |
2012 | 86,437 | 93,833 | 4,846 | 185,116 | |
2013, End of Month Stocks | |||||
January | 83,389 | 90,707 | 4,651 | 178,747 | |
February | 81,674 | 89,169 | 4,482 | 175,325 | |
March | 80,360 | 86,403 | 4,755 | 171,518 | |
April | 82,410 | 85,237 | 5,007 | 172,654 | |
May | 84,105 | 86,420 | 6,145 | 176,670 | |
June | 81,649 | 82,805 | 6,080 | 170,534 | |
July | 75,586 | 78,290 | 5,660 | 159,536 | |
August | 72,684 | 75,942 | 5,493 | 154,119 | |
Sept | 71,739 | 74,966 | 5,481 | 152,185 | |
October | 73,687 | 74,261 | 5,405 | 153,352 | |
November | 74,861 | 75,637 | 5,256 | 155,754 | |
December | 72,963 | 69,996 | 5,014 | 147,973 | 25,999 |
2014, End of Month Stocks | |||||
January | 62,170 | 64,824 | 5,330 | 132,324 | 41,648 |
February | 54,676 | 58,874 | 5,399 | 118,949 | 55,023 |
5-Year Average: | 173,972 | (average of 2009-2013 years end) | |||
Source: EIA Electric Power Monthly, (March, 2014) table 3.4. 5-year average and difference are calculated by author.
In summary, in order to normalize the depleted natural gas storage, we need to run more coal-fired instead of NG-fired turbines in power plants this summer. But now we find that coal stock in the power plants also needs to be built up before the coming winter. Author estimates that around 10 - 20 million more thermal coals needed to restore coal stock (not necessarily to its five-year average).
Readers should take due diligence in investing these high risk coal miner names since the coal industry is under pressure from the regulatory body and environmental activists in reducing harmful emissions further. Thermal coal is also facing more and more competition from renewable energy sources like solar and wind powers. But as an important energy component, thermal coal will still play an important role as EIA projects that the thermal coal production remains stable (no reduction but with tiny increase) through 2035. Some currently hard beaten coal miners like ACI (more than half thermal coal weighted) and ANR (heavily thermal coal weighted) will definitely take this chance to repair their highly debt leveraged balance sheet, thus would have a better chance to survive the current business downturn.
As natural gas price is much better than one year ago and normalization of the low storage has to be done ending this October, NG producers, especially shale gas players like Chevron Corporation (CVX), Chesapeake Energy Corporation (CHK), Southwestern Energy Company (SWN), Cabot Oil & Gas Corporation (COG)… etc., just name a few, should enjoy the NG price hike and perhaps are thinking if to allocate more resources further on shale play. Oil and gas infrastructure companies would benefit the most from the current pipeline construction that is considered as a major concern for the current NG supply problem.
As finishing this article, EIA published NG weekly storage number as 981 Bcf as of April 25, 2014 with 82 Bcf addition in the last week. It seems so far we only have an average April injection momentum. In order to fulfill EIA's projected 2,600 Bcf injection, we definitely need net injection number above the average in majority of seven months during the current inject season. Author here prepared Table 10 that may be useful for readers interested in natural gas securities whose movement is sensitive to EIA's weekly NG storage report. Readers can check deficit or surplus of injection number from month to month, thus make their own estimation with help of statistics listed in Table 10. It would be very interesting to watch injection progress in May and June which are two important months called shoulder month that means NG usage is usually low therefore more NG should be available for storage. Readers with less statistic knowledge can only pay attention to mean, minimum and maximum though.
Table 10. Simple Statistics of Natural Gas Injection Amount by Months in Injection Seasons from 2000-2013 | |||||||||
Mean | Standard | Standard | 95% Confidence Interval | ||||||
Month | (Average) | Minimum | Maximum | Median | Deviation | Error | Low Limit | High Limit | |
April | 192 | 46 | 360 | 197 | 80 | 21 | 146 | 238 | |
May | 387 | 231 | 479 | 402 | 69 | 18 | 347 | 427 | |
June | 354 | 232 | 469 | 342 | 62 | 16 | 318 | 389 | |
July | 281 | 134 | 385 | 282 | 76 | 20 | 237 | 325 | |
August | 244 | 127 | 350 | 240 | 69 | 18 | 204 | 284 | |
September | 328 | 269 | 411 | 313 | 47 | 12 | 301 | 355 | |
October | 239 | 87 | 385 | 245 | 79 | 21 | 194 | 285 | |
Sum of 7 Months | 2,025 | 1,126 | 2,839 | 1,747 | 2,303 | ||||
Note: Injection Season: April - October. | |||||||||
95% confidence interval is computed assuming net changes (Injection amount) are normally distributed over years by months in inject season and should be interpreted with caution. | |||||||||
Table is compiled from EIA data. | |||||||||
At the moment of the darkest days, as some people called, for coal sector in the United States, I maintain a speculative bullish for thermal coal in coming months. The main purpose of this article is to present and analyze publically available data to help readers have a better understanding of root causes behind the recent hikes in NG and thermal coal price, other than draw conclusions already known to readers. In this sense, this article is more or less for those who wish to foresee future by consulting the past.
Disclosure: I am long ACI, ANR, BTU, COG. I wrote this article myself, and it expresses my own opinions. I am not receiving compensation for it (other than from Seeking Alpha). I have no business relationship with any company whose stock is mentioned in this article.
Additional disclosure: It is just my opinions without any third party interest. Readers should be aware of high investment risk in energy sectors, especially in coal and natural gas industries which is highly speculative. Readers should consult their own financial advisers before making any investment decision. It is to the best of author’s effort to collect and further calculate EIA’s data in this article with accuracy. Readers should take due diligence in reading all numbers in this article and are not encouraged to use these numbers in any purpose without their own validation.