Markets around the world are feeling the pain of the credit crisis and the current recession. The Nikkei started its trading day Thursday down more than 7% ending down 2.5%. Not to mention that the Hang Seng index was down 4.2%, the S&P/ASX 200 was down 4.4%, and the Kospi was down 7.5%.
Today, it’s the same story for those markets.
- Nikkei down 9.6%
- Kospi down 11%
- MSCI Asia Pacific down 5.6%
- MSCI’s Asian Index down 8%
- FTSE 100 down 5.6%
- DAX down 5.1%
All of these indices are hitting record lows: prices set five year ago to prices set at their inceptions in most cases.
It is a fact that the global markets are interconnected.
The U.S. was the start of the housing and credit crises; however, it is currently rippling throughout the world. These foreign indices listed above are all starting to feel the pain of this global credit crisis as they are the tail wag to the dog. Does this mean that the foreign markets will recover last at the end of this recession? Perhaps – but this new global market is creating a cause for global initiatives. The Economic Summit meetings are filling up the agenda of world leaders as everyone attempts to find a solution to stave off the impacts of the worldwide recession and to prevent a global depression.
Not until the past two weeks have many people realized that this recession is affecting other countries and many still do not realize that the global outlook into late next year will be worse than expected. The U.S. market has not found its bottom at the low 8,000 levels. In my first article I wrote of the days ahead and how the first “-777 point day was the first of many similar days” and that days was “plural.” Since then, we have seen a continuous tug-o-war in the market, where each “pull” at the market has been triple digits. Expect the move that finds the bottom of this market to be large.
Many investors have been cheerleading stocks across the board that they are a buy – from a valuation standpoint – and yes, many stocks look appealing for long term investment since most major large cap stocks on the major indices currently have P/E ratios less than 10 on average and stock prices that are misrepresented by the oversold market, creating value in the long term. However, two factors are attributed to the high volatility creating 25 out of the last 27 session closes to be a result of triple digit movement.
The first – and fundamental – reason is that investors are confused where to value companies, now that the markets have fallen so sharply and consequently becoming way oversold. This creates a large range of prices for stocks across the board at which to be valued/bought and that is reducing confidence in the market as well as the prices. The day the markets have their strong rally will be a result of most investors buying into the market simultaneously and sequentially.
Another point related to fundamentals that I want to make about the rapid unpredictable movements in the market is the confusion between investors and analysts. The market has been falling so quickly over the past few weeks that many large corporations with low P/Es and other fundamental elements that point to growth and value have not been adjusted by analysts. This gap in communication creates a difference between actual value and where investors are guessing company stock prices; and until this issue is solved, the market will continue to move quickly and far on record high volatility.
The second – and technical – reason is that every stock, commodity, currency, index, etc. is currently poised at record and multi-year lows which are attracting many investors – institutional and individual – because of the long term value. Many day traders are taking advantage of record volatility and weakness in the markets.
In my last article, I also mentioned where I believed the DJIA was headed. I said that the DJIA was more than likely to fall through the 100 day moving average (MA) than bounce off of it, and that if it did break through that it would fall to the 200 day MA (which it did).
Let’s look at an updated chart of the DJIA from a chartist’s view:
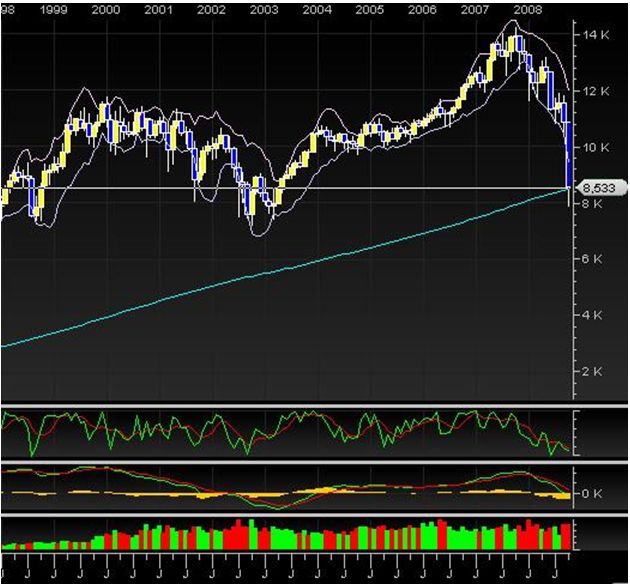
This is a representation of the DJIA over 10 years from a monthly perspective. The stock is sitting just positioned on the 200 day MA – as stated in my previous article. Will this level hold? Only time will tell, but expect the volatility to continue as we search for a bottom. I would watch the market carefully to look for signs of this short term rally during the remainder of this week and into next week.
Here is another chart of the DJIA taken from a daily view of 100 days:
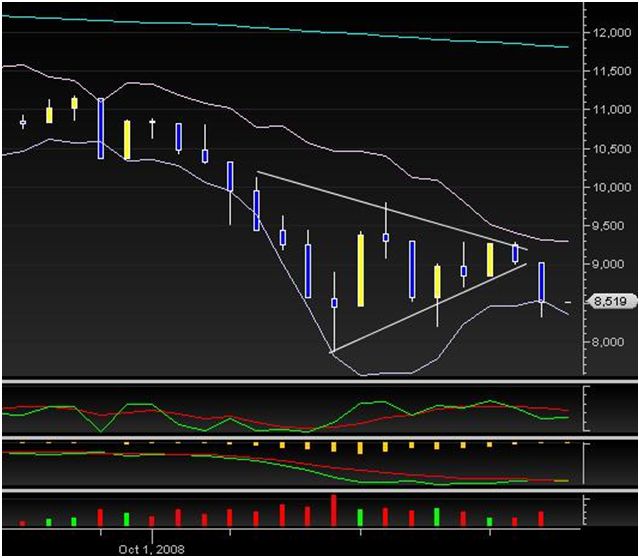
The symmetric triangle we’ve seen form over the past few days finally broke to the downside recently. This may not mean much too fundamental investors, but with regards to the short-term trend, this is somewhat bearish. That 8,000 point level is not very far away.
However, the DJIA is sitting on significant support currently; and therefore, I want to restate that the moves in the market during the next few days must be carefully watched because regardless of the direction, I believe the move will be significant to say the least.
The above analysis mainly pertains to shorter term trends. The long term trend is still down.