Most knew that Exelon's (NASDAQ:EXC) dividend was to be cut before the firm announced the cut (it had been telegraphed by management). We had highlighted the risk of Exelon's dividend cut long before even others knew (and maybe even management). We strongly encourage investors to read 'How To Shield Your Portfolio From Dividend Cuts,' where we walk through exactly how to do so.
However, the point of this article is in response to a number of disgruntled individual investors out there. Most were completely shocked when research providers (not us) retained the company's highest competitive advantage ranking AFTER the dividend cut. We were stormed with questions along the lines: If a company is forced by the structural characteristics of its industry to cut its economic returns to shareholders, does it really have extra-strong competitive advantages? Well, needless to say, we were quite surprised.
Let there be absolutely no confusion. We at Valuentum think competitive advantage analysis is extremely important, but only if it is done correctly. Competitive advantages should certainly protect a company from many of the structural threats of the industry that could hurt a dividend payout that many income investors rely on. And firms with super-strong competitive advantages should certainly have protective barriers to prevent the structural characteristics from impeding economic returns to shareholders at all. But once it has been shown that a firm is not immune to the structural characteristics of an industry, it should not retain the assessment that it has super-strong competitive advantages. Competitive advantage analysis is important. But only if it is done correctly.
The same can be said for pretty much anything when it comes to stock analysis though: It needs to be done correctly. This brings us to the idea of valuation. Savvy investors know that price does not equal value. Price is what a company's shares can be bought for, while value is based on the future discounted cash flow stream of the company. Yet, it's important to note that even fair value estimation can be done incorrectly. That's why investors should use a variety of different sources before concluding that a company is undervalued or overvalued.
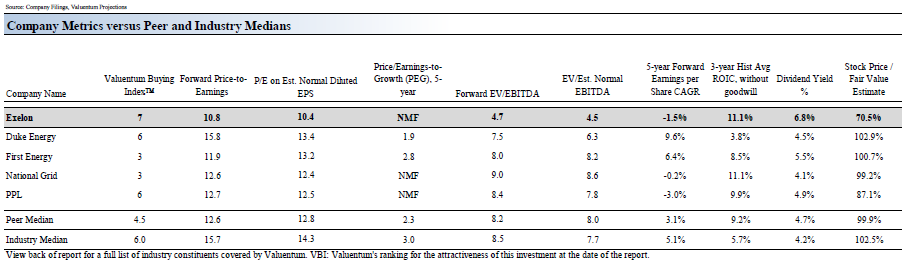
We want to be one of your sources. As part of our process at Valuentum, we perform a rigorous discounted cash-flow methodology that dives into the true intrinsic worth of companies. Let's dig into what Exelon is worth. We compare Exelon to peers Duke Energy (DUK), First Energy (FE), and National Grid (NGG).
Our Report on Exelon

Investment Considerations
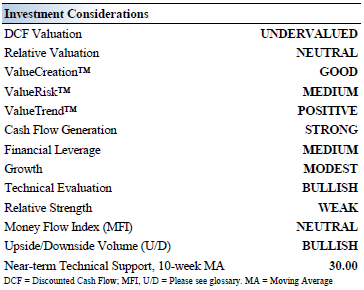
Investment Highlights
• The recent merger of Exelon and Constellation Energy has created one of the lowest-cost power generation fleets in the US. The tie-up offers opportunities for O&M synergies, portfolio optimization, and overhead savings. More than half of the combined company's portfolio will be low-cost nuclear.
• Although we think the firm's DCF valuation indicates a potential attractive investment opportunity, we'd be more comfortable investing in the firm if it was more attractively priced on a relative basis versus peers as well.
• Exelon has a good combination of strong free cash flow generation and manageable financial leverage. We expect the firm's free cash flow margin to average about 3.1% in coming years. Total debt-to-EBITDA was 1.9 last year, while debt-to-book capitalization stood at 47.8%.
• The firm posts a Valuentum Buying Index score of 7. We don't find the firm that attractive based on this measure, and we'd grow more constructive if it registered an 8 or higher on our scale. Please note that while we may find the firm to undervalued, the company did not register a high rating on our scale. Others had been pounding the table on the stock only to watch it fall precipitously.
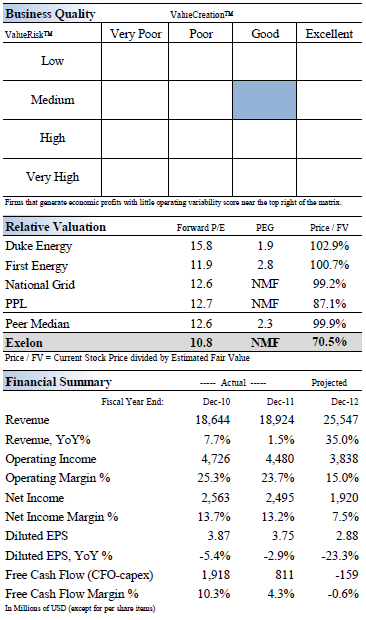
Business Quality
Economic Profit Analysis
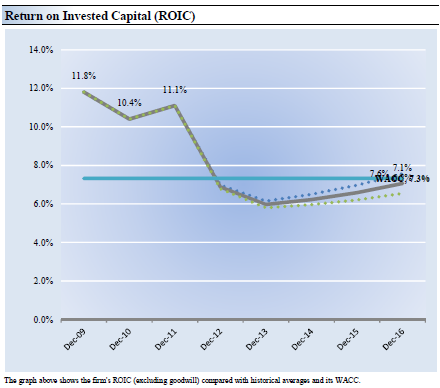
The best measure of a firm's ability to create value for shareholders is expressed by comparing its return on invested capital (ROIC) with its weighted average cost of capital (OTC:WACC). The gap or difference between ROIC and WACC is called the firm's economic profit spread. Exelon's 3-year historical return on invested capital (without goodwill) is 11.1%, which is above the estimate of its cost of capital of 7.3%. As such, we assign the firm a ValueCreation™ rating of GOOD. In the chart below, we show the probable path of ROIC in the years ahead based on the estimated volatility of key drivers behind the measure. The solid grey line reflects the most likely outcome, in our opinion, and represents the scenario that results in our fair value estimate.
Cash Flow Analysis
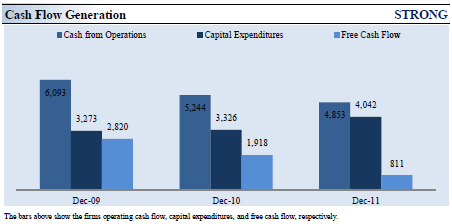
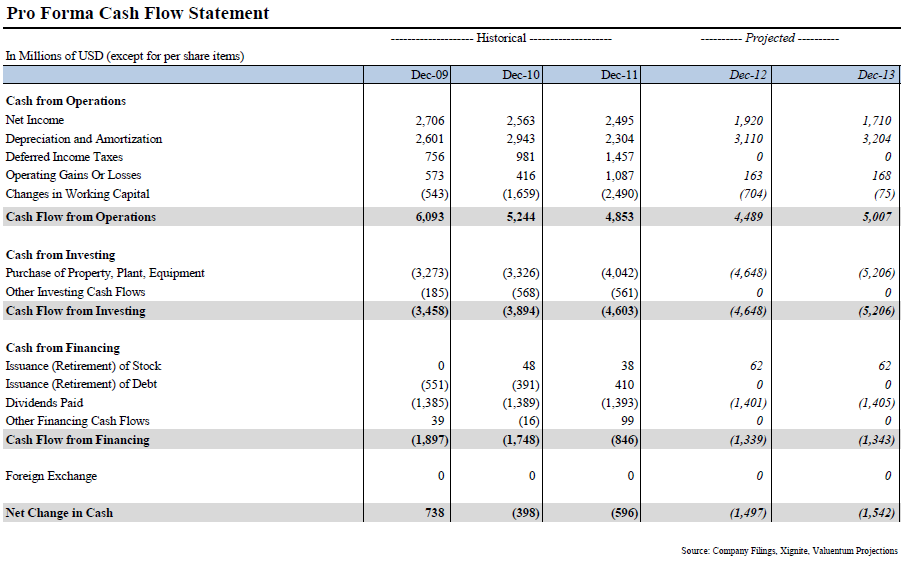
Firms that generate a free cash flow margin (free cash flow divided by total revenue) above 5% are usually considered cash cows. Exelon's free cash flow margin has averaged about 10.3% during the past 3 years. As such, we think the firm's cash flow generation is relatively STRONG. The free cash flow measure shown above is derived by taking cash flow from operations less capital expenditures and differs from enterprise free cash flow (FCFF), which we use in deriving our fair value estimate for the company. For more information on the differences between these two measures, please visit our website at Valuentum.com. At Exelon, cash flow from operations decreased about 20% from levels registered two years ago, while capital expenditures expanded about 23% over the same time period.
Valuation Analysis
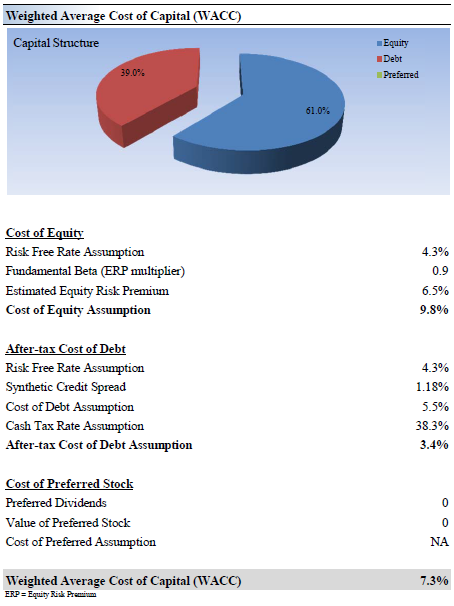
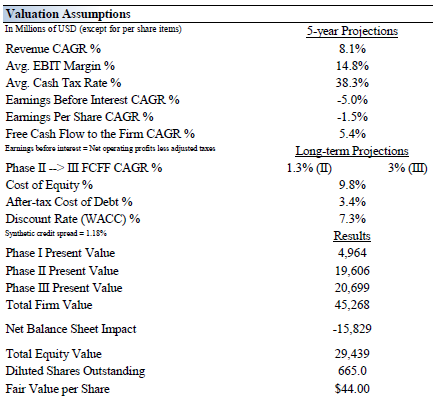
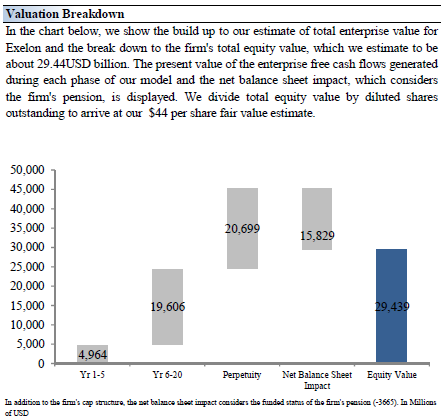
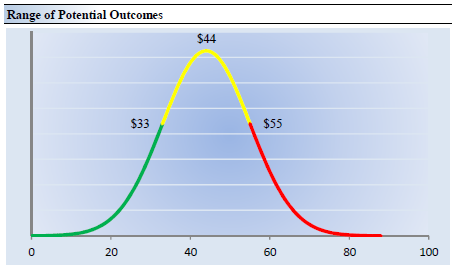
Our discounted cash flow model indicates that Exelon's shares are worth between $33.00 - $55.00 each. The margin of safety around our fair value estimate is driven by the firm's MEDIUM ValueRisk™ rating, which is derived from the historical volatility of key valuation drivers. The estimated fair value of $44 per share represents a price-to earnings (P/E) ratio of about 11.7 times last year's earnings and an implied EV/EBITDA multiple of about 6.7 times last year's EBITDA. Our model reflects a compound annual revenue growth rate of 8.1% during the next five years, a pace that is higher than the firm's 3-year historical compound annual growth rate of 0.1%. Our model reflects a 5-year projected average operating margin of 14.8%, which is below Exelon's trailing 3-year average. Beyond year 5, we assume free cash flow will grow at an annual rate of 1.3% for the next 15 years and 3% in perpetuity. For Exelon, we use a 7.3% weighted average cost of capital to discount future free cash flows.
Margin of Safety Analysis
Our discounted cash flow process values each firm on the basis of the present value of all future free cash flows. Although we estimate the firm's fair value at about $44 per share, every company has a range of probable fair values that's created by the uncertainty of key valuation drivers (like future revenue or earnings, for example). After all, if the future was known with certainty, we wouldn't see much volatility in the markets as stocks would trade precisely at their known fair values. Our ValueRisk™ rating sets the margin of safety or the fair value range we assign to each stock. In the graph below, we show this probable range of fair values for Exelon. We think the firm is attractive below $33 per share (the green line), but quite expensive above $55 per share (the red line). The prices that fall along the yellow line, which includes our fair value estimate, represent a reasonable valuation for the firm, in our opinion.
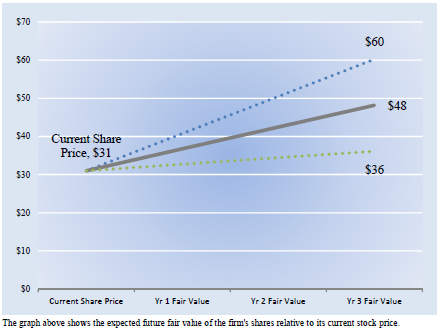
Future Path of Fair Value
We estimate Exelon's fair value at this point in time to be about $44 per share. As time passes, however, companies generate cash flow and pay out cash to shareholders in the form of dividends. The chart below compares the firm's current share price with the path of Exelon's expected equity value per share over the next three years, assuming our long-term projections prove accurate. The range between the resulting downside fair value and upside fair value in Year 3 represents our best estimate of the value of the firm's shares three years hence. This range of potential outcomes is also subject to change over time, should our views on the firm's future cash flow potential change. The expected fair value of $48 per share in Year 3 represents our existing fair value per share of $44 increased at an annual rate of the firm's cost of equity less its dividend yield. The upside and downside ranges are derived in the same way, but from the upper and lower bounds of our fair value estimate range.
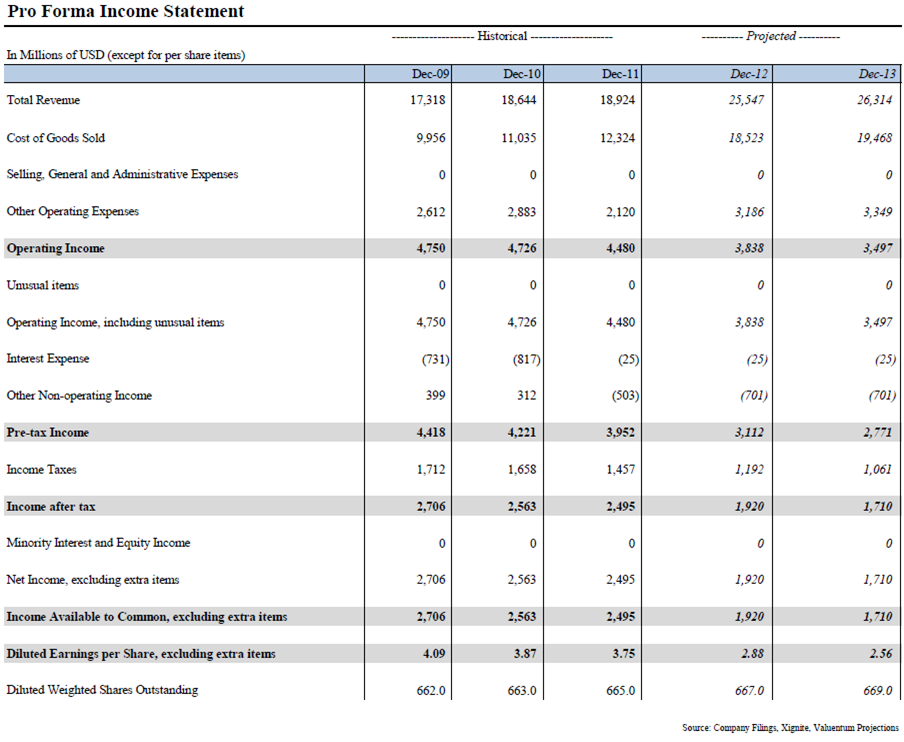
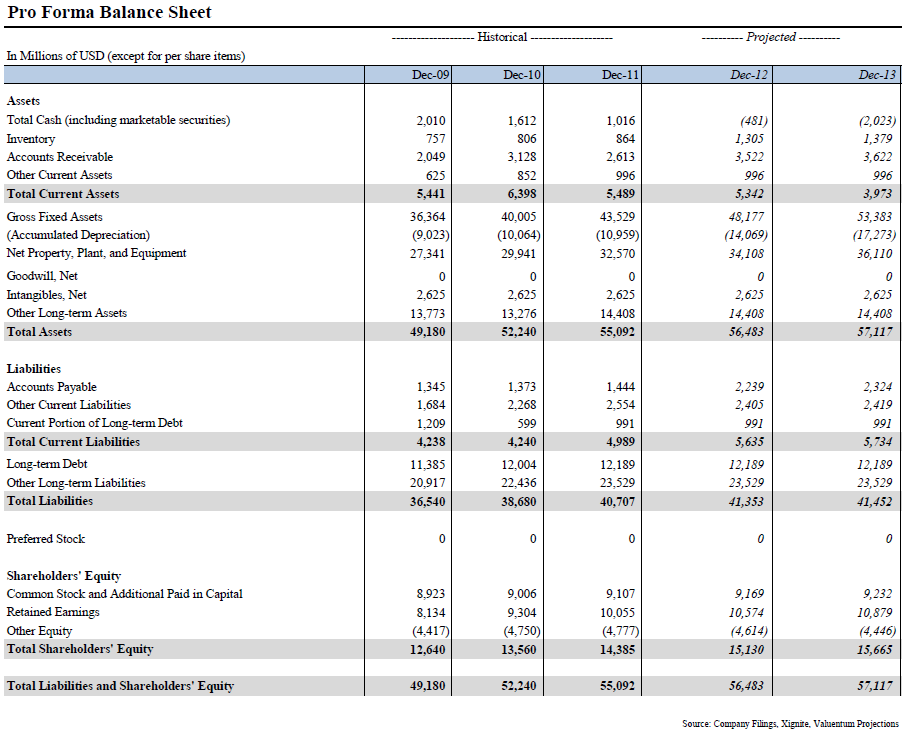
Pro Forma Financial Statements
Disclosure: I have no positions in any stocks mentioned, and no plans to initiate any positions within the next 72 hours. I wrote this article myself, and it expresses my own opinions. I am not receiving compensation for it (other than from Seeking Alpha). I have no business relationship with any company whose stock is mentioned in this article.