At the end of last year, I established a list of my top pick homebuilders for rebuilding my exposure to the sector. As the fourth quarter nears, I find myself well below my original investment plans. When I last updated the performance of this list in May, most homebuilder stocks sat at multi-year highs and far out of reach. Of course since then interest rates increased sharply and forced the Federal Reserve to back down from its threats to taper bond purchases. Rates have parachuted a little lower since that meeting.
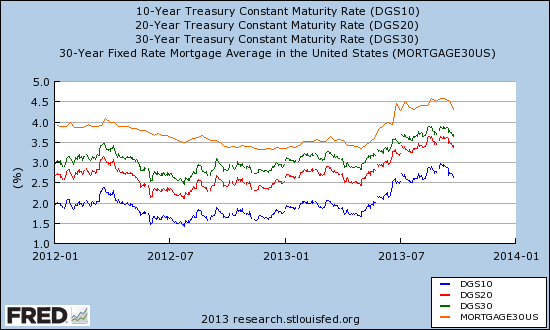
Mortgage rates and treasury yields come down off recent highs
Source: St. Louis Federal ReserveHomebuilder stocks joined most rate-sensitive plays by falling sharply from their lofty levels once the direction and momentum of rates became clear. I used this opportunity to finally nibble on a few homebuilder stocks, but I am not even close to the exposure I thought I would have by this time of the year. At this point, most homebuilder stocks remain in positive territory for the year - no small feat given the headline headwinds. I think this resilience will continue for some time. I consider any of the dips that are likely to come in the next several weeks to represent particularly good buying opportunities.
Interestingly, higher rates and weakening technicals for homebuilder stocks did not spike the interest of homebuilder bears. Six of the ten homebuilder stocks I track have short interest that is still down year-to-date. Short interest has picked up since May but at varying paces. Three homebuilders - Hovnanian Enterprises Inc. (HOV), Meritage Homes Corporation (MTH), and PulteGroup, Inc. (PHM) have actually experienced further declines in short interest. DR Horton Inc. (DHI) is at its highest level of short interest in at least two years. Note that three homebuilder IPOs have all seen sharp increases, but it is hard to interpret these data given the brief trading history and the time it could take for shares to become available for shorting.
I post two charts below showing this short interest since September, 2011. They measure the shares short relative to settlement on December 31, 2012. So, a 1.5 means shares short have increased 50%; a 0.5 means shares short have decreased 50% since then.
Here are the ticker symbols for the charts below: Beazer Homes USA Inc. (BZH), DR Horton Inc. , Hovnanian Enterprises Inc. , KB Home , Lennar Corp. (LEN), MDC Holdings Inc. (MDC), Meritage Homes Corporation , PulteGroup, Inc. , Ryland Group Inc., Taylor Morrison Home Corporation (TMHC), Toll Brothers Inc. (TOL), TRI Pointe Homes, Inc. (TPH), William Lyon Homes (WLH).
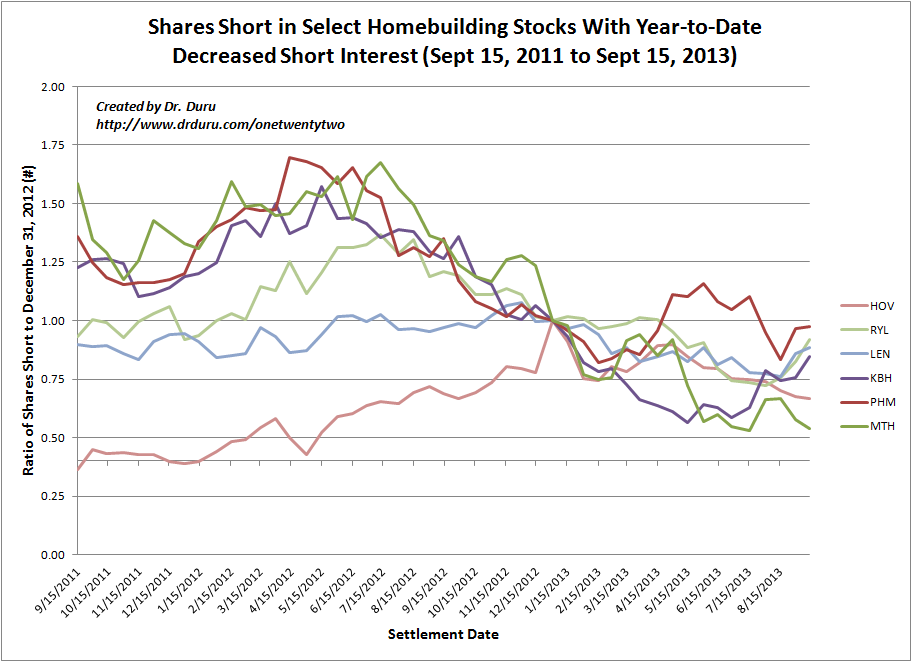
Shares Short in Select Homebuilding Stocks With Year-to-Date Decreased Short Interest (Sept 15, 2011 to Sept 15, 2013)
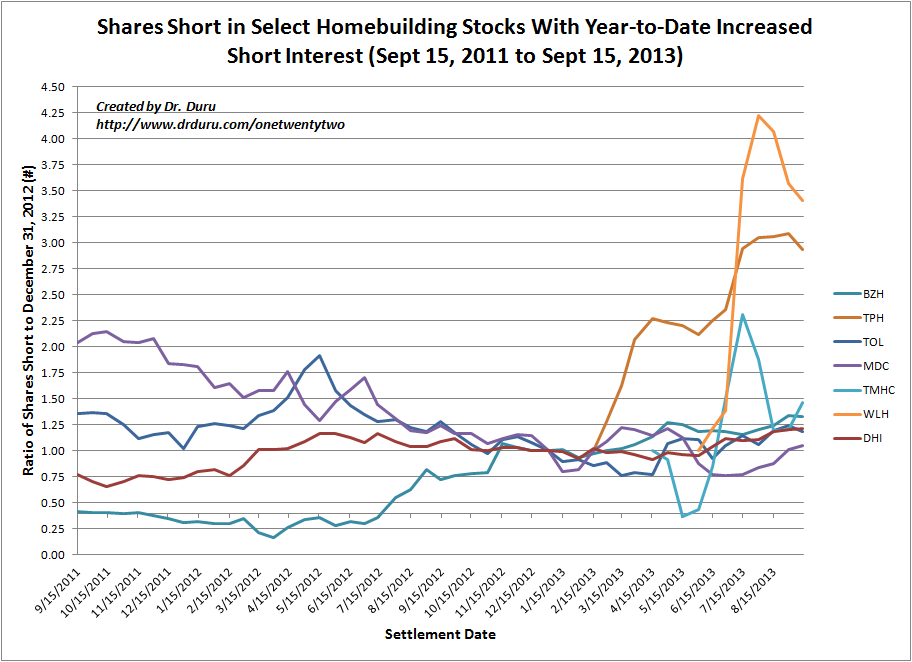
Shares Short in Select Homebuilding Stocks With Year-to-Date Increased Short Interest (Sept 15, 2011 to Sept 15, 2013)
Source for data: accumulated from NASDAQ.com short interestExcluding the IPOs, KBH has experienced the sharpest rise in short interest since May. (I will cover KBH's earnings call in another post. I think they have been misinterpreted as bearish). RYL and LEN have experienced sharp increases in the past month (I will cover LEN's recent earnings report in another post). Shorts are clearly being very selective in their targets although homebuilders as a group declined notably from May through August. The recoveries this month of September are likely the beginning of some stabilization that should eventually set up the next rally.
I am keeping my eye out on the horizon because the housing recovery is just getting started. Homebuilding is still in a deep recession relative to past decades. The longer economic conditions suppress this building activity, the more pent-up demand grows in the system. Higher prices were good for encouraging more building and generating more inventory. However, hot markets still have very limited inventory and the major builders are extremely focused on anchoring their business models on the regions with the best job markets and highest supply constraints. For context, here are related charts from the St. Louis Federal Reserve:
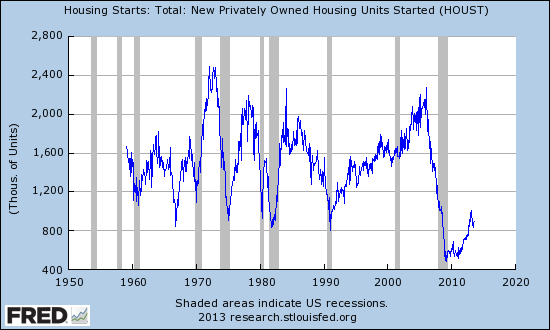
Total New Privately Owned Housing Units Started (Seasonally Adjusted Annual Rate)
Source: St. Louis Federal Reserve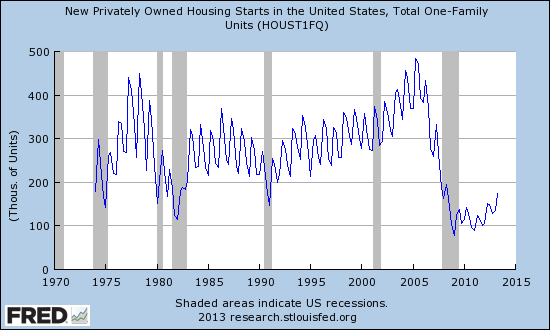
Total One Family Units Privately Owned Housing Starts (Seasonally Adjusted, Quarterly)
Source: St. Louis Federal ReserveAs these charts show, housing starts have increased sharply off depression-like levels, but they remain at levels that would have been considered severe slowdowns over at the past 40-50 years. The percentage of all home sales provides another frame of reference. On Nightly Business Report, September 26, 2013 (start 11:30 in the video), Mark Hanson of M Hanson Advisors claimed that new home sales are currently only 7% of all home sales whereas typically they contribute about 20-25%.
This building recession is helping to feed pent-up demand, especially in the healthiest housing markets. More of this pent-up demand could be unleashed as banks faced with sharply declining revenues from refinancing activities move to increase mortgage volumes. Lending standards have been extremely tight, so even a marginal loosening of standards could unleash a lot of fresh demand upon the market.
Housing affordability at an aggregate level has plunged thanks to rising rates and rising home prices, but affordability remains good on a historical basis. Wells Fargo (WFC) CFO Tim Sloan shared the following affordability stat on CNBC (September 18, 2013) after noting the large decline in mortgage originations and refinancings off a large base from 2012:
"…when you look at home affordability, the percent of the average person's income to pay their mortgage is still at historic levels. If you look over the last 50 years, the average is 27% of your disposable income. It's 18% today. The high we experienced in the low 80s about 50%. In 2007 it was about 30%."
Some of the bearish arguments I have read latch on to every data point as a negative:
- Rising housing prices: a bubble in the making, a crash in the waiting.
- Slowed growth in housing prices: evidence that the housing recovery is already over (despite being less than two years old).
- (Existing) home sales increasing: sign of sellers dumping inventory ahead of a crash (nevermind that these people have to move somewhere else to live and there are not enough apartments to house them all).
- Home sales slowing/decreasing: more evidence that the housing recovery is already over.
At least I very rarely see anymore doomsday predictions about a waterfall of shadow inventory of foreclosed homes ready to overwhelm the market. I addressed this issue in past blog posts. Ironically, many markets could use a flood of shadow inventory right now.
Anyway, I think a better framework for thinking about the housing recovery is to recognize that the industry is in the early stages of pulling out of a depression. The deflationist psychology inherited from the crashing of the bubble will take considerable time to heal. After this initial fast climb off the bottom, I would not be surprised to find that the market quickly absorbed the most willing and the most credit-worthy buyers. A pause (or slowing rates of growth) at this juncture will be healthy for maintaining affordability at attractive levels. When I projected a 2013 recovery for housing in past posts, I expected it to unfold in fits and starts and bounce along the bottom. The contours of the actual recovery are much better than I anticipated (thus I was not bullish enough in 2012), so I welcome dips going forward as welcome buying opportunities.
Be careful out there!
Disclosure: I am long TPH. I wrote this article myself, and it expresses my own opinions. I am not receiving compensation for it (other than from Seeking Alpha). I have no business relationship with any company whose stock is mentioned in this article.