New York & Company Inc. (NWY) is a specialty retailer of women's fashion apparel and accessories, priding itself of providing women with modern, wear to work solutions that are multi-functional at affordable prices. Incorporated in 1918, its has been public since 2004, is headquartered in New York City and has a market capitalization of approximately $280 million. At the end of Q3FY13, the company had 50 outlets representing around 9% of sales.
Overview
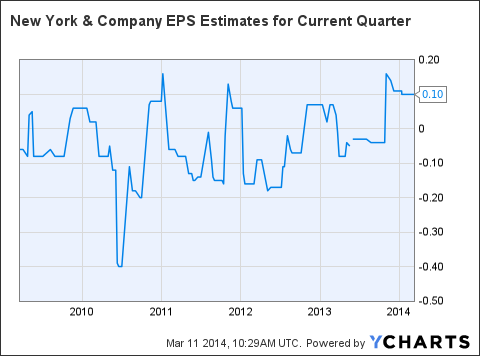
The company reported an EPS loss of $0.05 in Q3FY13, which was a penny lower than consensus expectations and a negative 25% earnings surprise. An increase in inventories also sent the cash conversion cycle higher to 17.8 in Q3 as inventory turnover decreased. Meanwhile, the company disappointed with its guidance for Q4FY13 EPS of $0.05 to $0.11, considerably lower than the $0.15 EPS expectations from the street. Investors reacted by sending the stock sharply lower on the day by almost 13%.
However, there were some positives to take away from the results with comps of +3% registering their strongest gains since Q3FY11. Meanwhile, the increase in inventories was credited to timing differences and management noted that as the calendar normalized, inventory levels came back in line. The Eva Mendes line has also started off impressively and was a key store and online traffic driver. This release helped boost margins as the Eva product is not discounted or coupon eligible. In fact, the reduction in discounting levels across the board saw the company register its highest 3Q gross margin levels since FY07. Outlets also registered positive comps while e-commerce reached a record 10% of sales.
Since posting these results on 4th December 2013, the company has updated the market, narrowing its Q4 operating income forecast from $3-$7 million to $5-$6.5 million, which pleased the market. Brokers responded by upping their Q4 earnings forecast to $0.10, toward the higher end of the company's range. Meanwhile, looking ahead, analysts estimate FY15 EPS of $0.21 and FY16 EPS of $0.32.
Fundamental Analysis
From a fundamental perspective, I break it down into two studies: Value and Quality.
Value
From a value perspective, I use the conventional approach of analyzing price multiples. I rank these into deciles with 1 being the cheapest 10% and 10 indicating the most expensive 10% of companies based on that specific multiple.
Then, I backtest the performance of each of these deciles going back over the past 14 years (end February 2000 to end February 2014) to determine whether the company is attractively positioned based on the historical returns. I conducted my tests across the Russell 3,000 index.
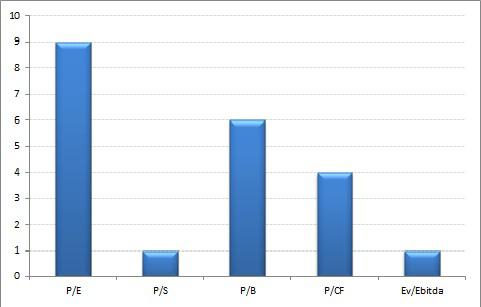
New York & Company Value Analysis (lower rank = more attractive valuation)
Source: Bloomberg.
Price/Earnings
- With a P/E of 39.7, the company gets a rank of 9, not far off the most expensive companies in the Russell 3,000. The historical CAGR over the past 14 years for companies ranked in the 9th decile is a mere 2.1%.
Price/Sales
- The company is far more attractive on a P/S basis, with a rank of 1, meaning it is amongst the cheapest in the Russell 3,000. The CAGR over the past 14 years for companies in this decile is 18.2%.
Price/Book
- On a P/B reading of 2.7, the company is just at the higher end of valuations with a rank of 6. Companies in this category have produced a CAGR of 6.7% since the end of February 2000.
Price/Cash Flow
- Trading on a P/CF of 9.3, New York & Company is ranked in the 4th decile, which over the past 14 years has produced a CAGR of 8.4%
EV/EBITDA
- Similar to the P/S rank, the company is in the cheapest 10% of companies on an EV/EBITDA measure, with a reading of 6.1 and a subsequent rank of 1. Across the Russell 3,000 since the end of February 2000, this group has produced an impressive CAGR of 16.3%.
Quality
For quality purposes, I analyze profitability and break down the calculation of Return on Equity through DuPont analysis. Once again, I rank the components into deciles from 1-10. Then, I backtest the performance of each of these deciles on the Russell 3,000 going back over the past 14 years to determine whether the company is attractively positioned based on the historical returns.
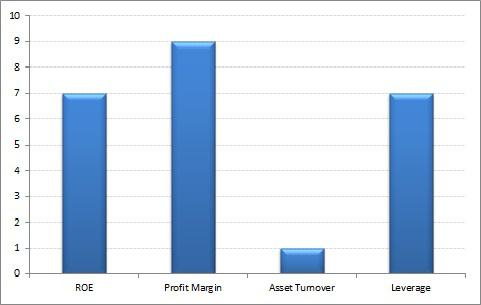
New York & Company Quality Analysis
Source: Bloomberg
Return on Equity
- The company is only ranked 7, putting it toward the lower end in terms of ROE. The conventional wisdom would suggest that such a low ranking would make the company undesirable but the returns over the past 14 years refute such claims. The best performing ROE decile over this period has been the 8th decile, with a CAGR of 9.9%. The 7th decile produced a CAGR of 7.5%.
Profit Margin
- The profit margins of 6% are amongst the lowest in the Russell 3,000, putting the company in the 9th decile. However, due to the mean reverting nature of earnings, this is actually an attractive proposition for the value investor. The best returns over the past 14 years for profit margins were across the 6th, 7th and 8th deciles. The 9th decile produced a CAGR of 7.5%, beating the top 30% of companies with the highest margins.
Asset Turnover
- With an asset turnover of 3.2, this ranks the company in the top 10% across the Russell 3,000. Unlike ROE and profit margins, the historical data suggests that this is indeed an enviable position to be in. The CAGR over the past 14 years for this top decile is 11.9%.
Leverage
- The company has leverage of 2.8, which puts it in the 7th decile and makes it one of the more highly leveraged companies. However, the fear that instills investors over leverage, particularly since the recent financial crisis, is overblown. Investing in the companies with the lowest levels of leverage over the past 14 years actually produced a negative CAGR of 1.36%. Meanwhile, the highest leveraged companies produced a CAGR of 8.2%. The 7th decile, where New York & Company resides, produced a CAGR of 11.2%.
Technical Analysis
The purpose of my technical analysis is all to do with trends. I examine the direction of the trend by simply analyzing price, the momentum of the trend through moving average convergence divergence (MACD) and the condition of the trend through the 14-day RSI.
Trend Direction
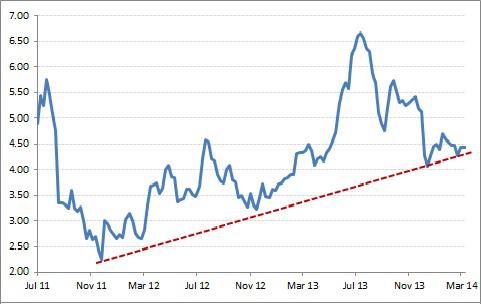
Despite having endured a considerable 42% drawdown from mid-July to mid-December 2013, the upward trending support line has held for now. However, it is also true that a series of lower highs has ensued over the same period. Therefore, the price action looks to be resembling a symmetrical triangle, suggesting investors should wait for a confirmed break up through resistance or break down through support before entering a long or short position.
New York & Company Weekly Price Trend
Source: Bloomberg
Trend Momentum
The price decline since July 2013 has been accompanied by a plunge in momentum, as measured by MACD. However, since the beginning of this year, momentum has flattened suggesting the recent correction is perhaps exhausted and ready to turn up once again.
New York & Company Weekly Price Momentum using MACD (12,26)
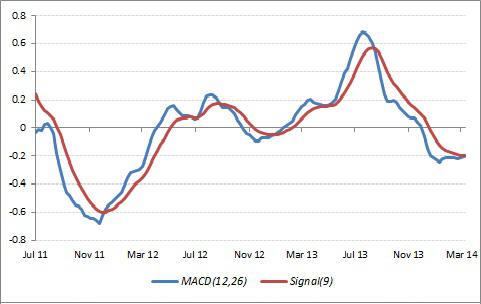
Source: Bloomberg
Trend Condition
The key levels to look out for on the RSI chart are 70 and above, which equates to an overbought condition. Meanwhile, a reading of 30 or below reflects an oversold condition. The RSI on the weekly chart for New York & Company is 42.4. Therefore, it is neutral territory but nearer oversold.
New York & Company Weekly Price Condition using RSI (14)
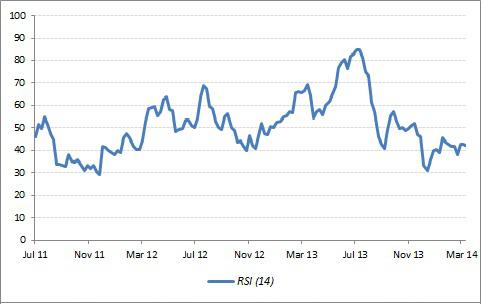
Source: Bloomberg.
Looking at the three factors (direction, momentum, condition) on the weekly chart, there are signs that the recent sell-off is coming to an end and the current support around $4.20 should indeed hold, buoyed by an upsurge in momentum.
Conclusion
Although the technical setup suggests the support around $4.20 will hold, I believe the definitive catalyst for the next move higher/lower will be the earnings report on 21st March. With current analyst estimates of $0.10 per share toward the higher end of the company guidance, it does not leave an awful lot of room for error. Therefore, my approach would be to wait for the earnings report and buy should a surprise to the upside materialize.
Disclosure: I have no positions in any stocks mentioned, and no plans to initiate any positions within the next 72 hours. I wrote this article myself, and it expresses my own opinions. I am not receiving compensation for it (other than from Seeking Alpha). I have no business relationship with any company whose stock is mentioned in this article.