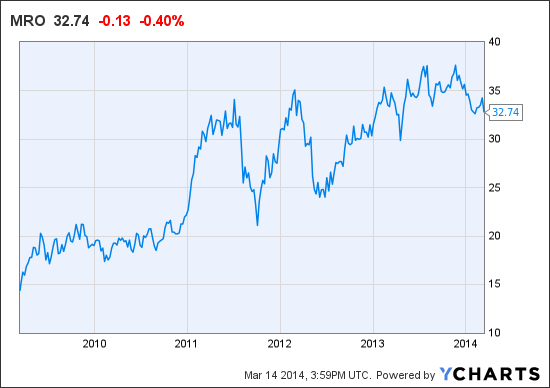
Benjamin Graham taught that Intelligent Investors must do a thorough fundamental analysis of investment opportunities to determine their intrinsic value and inherent risk. This is best done by utilizing a systematic approach to analysis that will provide investors with a sense of how a specific company compares to another company. By using the ModernGraham method one can review a company's historical accomplishments and determine an intrinsic value that can be compared across industries. What follows is a specific look at how Marathon Oil (NYSE:MRO) fares in the ModernGraham valuation model.
Defensive Investor - must pass at least 6 of the following 7 tests: Score = 5/7
- Adequate Size of Enterprise - market capitalization of at least $2 billion - PASS
- Sufficiently Strong Financial Condition - current ratio greater than 2 - FAIL
- Earnings Stability - positive earnings per share for at least 10 straight years - PASS
- Dividend Record - has paid a dividend for at least 10 straight years - PASS
- Earnings Growth - earnings per share has increased by at least 1/3 over the last 10 years using 3 year averages at beginning and end of period - FAIL
- Moderate PEmg ratio - PEmg is less than 20 - PASS
- Moderate Price to Assets - PB ratio is less than 2.5 or PB x PEmg is less than 50 - PASS
Enterprising Investor - must pass at least 4 of the following 5 tests to be suitable for a defensive investor: Score = 2/5
- Sufficiently Strong Financial Condition, Part 1 - current ratio greater than 1.5 - FAIL
- Sufficiently Strong Financial Condition, Part 2 - Debt to Net Current Assets ratio less than 1.1 - FAIL
- Earnings Stability - positive earnings per share for at least 5 years - PASS
- Dividend Record - currently pays a dividend - PASS
- Earnings growth - EPSmg greater than 5 years ago - FAIL
Valuation Summary
Key Data:
| Recent Price | $32.75 |
| MG Opinion | Overvalued |
| Value Based on 3% Growth | $34.97 |
| Value Based on 0% Growth | $20.50 |
| Market-Implied Growth Rate | 2.54% |
| NCAV | -$19.08 |
| PEmg | 13.58 |
| Current Ratio | 0.69 |
| PB Ratio | 1.18 |
Balance Sheet - 12/31/2013
| Current Assets | $2,975,000,000 |
| Current Liabilities | $4,333,000,000 |
| Total Debt | $6,394,000,000 |
| Total Assets | $35,620,000,000 |
| Intangible Assets | $499,000,000 |
| Total Liabilities | $16,276,000,000 |
| Outstanding Shares | 697,000,000 |
Earnings Per Share
| 2013 | $2.24 |
| 2012 | $2.23 |
| 2011 | $2.39 |
| 2010 | $3.61 |
| 2009 | $1.67 |
| 2008 | $4.95 |
| 2007 | $5.68 |
| 2006 | $6.87 |
| 2005 | $4.25 |
| 2004 | $1.86 |
Earnings Per Share - ModernGraham
| 2013 | $2.41 |
| 2012 | $2.66 |
| 2011 | $3.13 |
| 2010 | $3.85 |
| 2009 | $4.21 |
| 2008 | $5.23 |
Dividend History
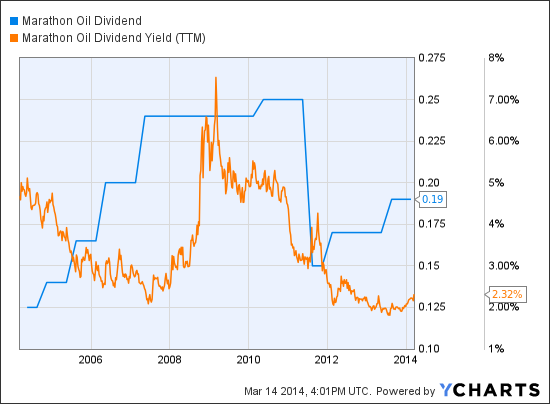
MRO Dividend data by YCharts
Conclusion:
Marathon Oil is not suitable for either the Defensive Investor or the Enterprising Investor. For the Defensive Investor, the turn-offs are the lack of earnings growth over the 10-year period and the poor current ratio. For the Enterprising Investor, the failings are in the high level of debt relative to the current assets and the lack of earnings growth over the last five years. As a result, value investors seeking to follow the ModernGraham approach based on Benjamin Graham's methods should explore other opportunities, such as by reviewing ModernGraham's valuation of Chevron Corporation or 5 Undervalued Companies for the Defensive Investor. From a valuation standpoint, the company appears significantly overvalued. The EPSmg (normalized earnings) have gone from $4.21 in 2009 to $2.41 for 2013, which is the exact opposite that Intelligent Investors want to see. The market is implying an estimate of 2.54% earnings growth, which is clearly not supported by the recent history of the company. As a result, the ModernGraham valuation model returns an estimate of intrinsic value that is well below the market price.
Disclaimer: The author did not hold a position in Marathon Oil Corp (MRO) or any of the other companies listed in this article at the time of publication and had no intention of changing that position within the next 72 hours.