This analysis is a fresh look at General Electric Company (NYSE:GE), one of the most complex conglomerates in the world. General Electric filed for a spin-off of its consumer credit card unit in March, a long-anticipated move. How does the bond market view General Electric and its key subsidiary General Electric Capital Corporation in light of the spin-off? We answer that question in this note.
We most recently looked at General Electric Company on December 19, 2013. We posted earlier analyses on September 4, 2013 and July 11, 2013. This note uses the default probabilities and bond credit spreads of General Electric Capital Corporation, the financial services subsidiary of General Electric Company, to measure the reward-to-risk ratio on the company's bonds. With a partial spin-off of General Electric Capital Corporation in the works, the risk for the bondholders of GECC becomes murkier still.
Conclusion: We reach a simple conclusion in this note: on April 7, 2014, there were 234 bond issues that offered a better credit spread to default probability ratio than the best bond traded on General Electric Capital Corporation.
The Analysis
This study is complicated by the fact that General Electric Company does not give an explicit guaranty on the bonds of General Electric Capital Corporation, a rare strategy among corporate bond issuers. Instead, it commits via an income maintenance agreement that the ratio of earnings to fixed charges at General Electric Capital Corporation will not fall below 1.1. Today's study incorporates General Electric Capital Corporation bond price data as of April 7, 2014. A total of 992 trades were reported on 168 fixed-rate non-call bond issues of General Electric Capital Corporation with a single-day trade volume of $218.9 million. There was also trading in a few bond issues of General Electric Company itself on April 7, but we leave the comparison between the bonds of the two legal entities for another day.
We have three simple questions to answer in this analysis:
- What maturities of General Electric Capital Corporation debt offer the most attractive ratio of credit spread to default risk?
- How does the reward to risk ratio for General Electric Capital Corporation compare to the same ratio for other issuers?
- Given the changes in the definition of "investment grade" mandated by the Dodd-Frank Act and described below, are the bonds issued by General Electric Capital Corporation investment grade or not?
The question "should I buy or sell a given bonds of GECC?" is the type of question that this author intentionally does not answer. Please consult your financial adviser in that regard.
Assuming the recovery rate in the event of default would be the same on all bond issues, a sophisticated investor who has moved beyond legacy ratings seeks to maximize revenue per basis point of default risk from each incremental investment, subject to risk limits on macro-factor exposure on a fully default-adjusted basis.
Term Structure of Default Probabilities
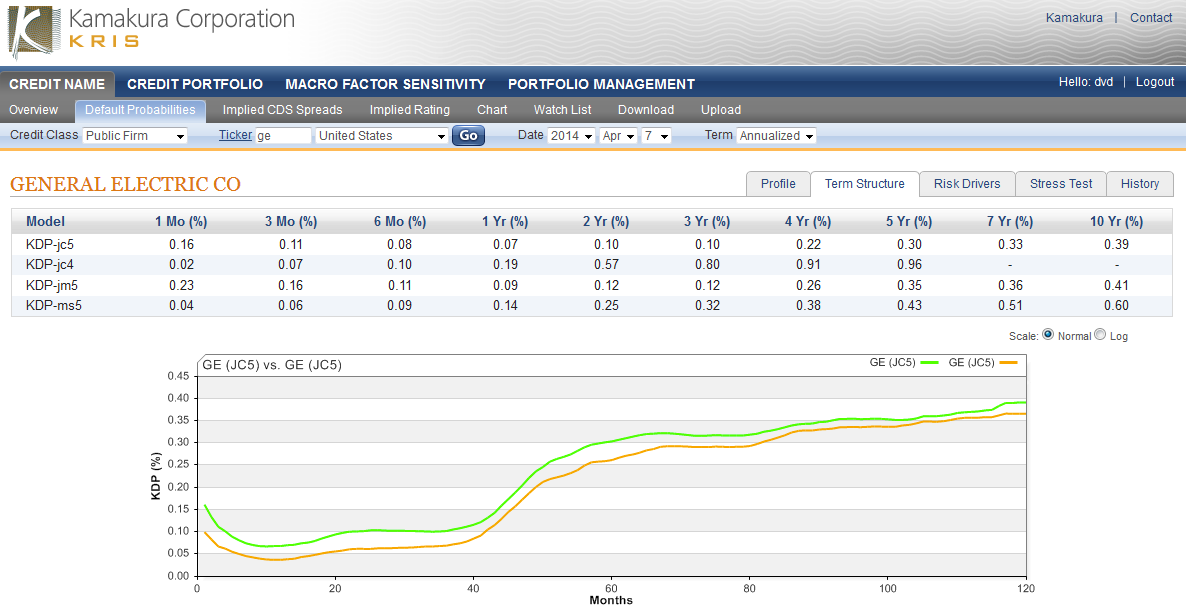
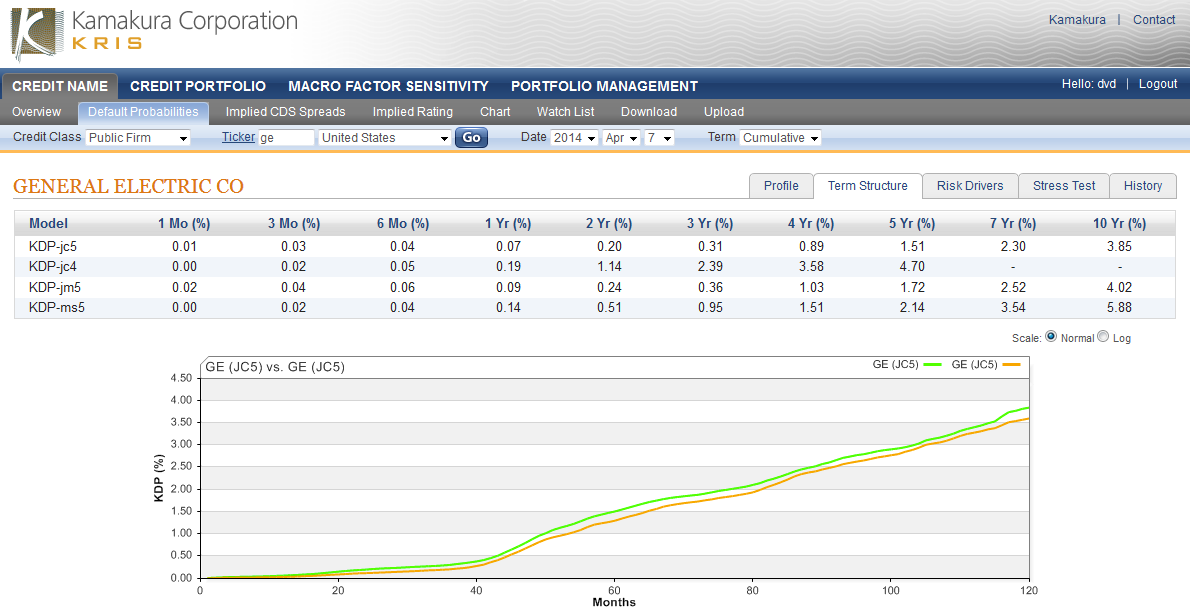
Maximizing the ratio of credit spread to matched-maturity default probabilities requires that default probabilities be available at a wide range of maturities. Kamakura Risk Information Services has an actively used non-public firm default probability model for non-public firms like General Electric Capital Corporation. In this note, however, we focus instead on the default probabilities of the parent company General Electric Company in light of the income maintenance agreement cited above. This assumption is somewhat more tenuous than it was in December in light of the announced spin-off of the North American retail finance business. The graph below shows the current default probabilities in green for General Electric Company ranging from one month to 10 years on an annualized basis. The default probabilities range from 0.16% at one month (up 0.06% from December) to 0.07% at 1 year (up 0.03%) and 0.39% at ten years (up 0.02%). The default probabilities on December 17, 2013 are shown in yellow.
We explain the source and methodology for the default probabilities in regular posts on Seeking Alpha.
Summary of Recent Bond Trading Activity
The National Association of Securities Dealers launched the TRACE (Trade Reporting and Compliance Engine) in July 2002 in order to increase price transparency in the U.S. corporate debt market. The system captures information on secondary market transactions in publicly traded securities (investment grade, high yield and convertible corporate debt) representing all over-the-counter market activity in these bonds. We used all of the bond data mentioned above for the General Electric Capital Corporation fixed rate non-call issues in this analysis.
The graph below shows 6 different yield curves that are relevant to a risk and return analysis of General Electric Capital Corporation bonds. These curves reflect the noise in the TRACE data, as some of the trades are small odd-lot trades. The lowest curve, in dark blue, is the yield to maturity on U.S. Treasury bonds, interpolated from the Federal Reserve H15 statistical release for that day, which matches the maturity of the traded bonds of General Electric Capital Corporation. The second lowest curve, in the lighter blue, shows the yields that would prevail if investors shared the default probability views outlined above, assumed that recovery in the event of default would be zero, and demanded no liquidity premium above and beyond the default-adjusted risk-free yield. The third line from the bottom (the orange dots) graphs the lowest yield reported by TRACE on that day on General Electric Capital Corporation bonds. The fourth line from the bottom (the green dots) displays the average yield reported by TRACE on the same day. The highest yield (the red dots) is obviously the maximum yield in each General Electric Capital Corporation issue recorded by TRACE. The black dots and the black connecting line reflect the yield curve derived from fitting a cubic polynomial on a trade-weighted basis to the credit spreads of General Electric Capital Corporation. See below for details.
The liquidity premium built into the yields of General Electric Capital Corporation above and beyond the "default-adjusted risk free curve" (the risk-free yield curve plus the matched-maturity default probabilities for the firm) widens with maturity, the normal pattern for a high quality credit, although there are many outliers around this trend.

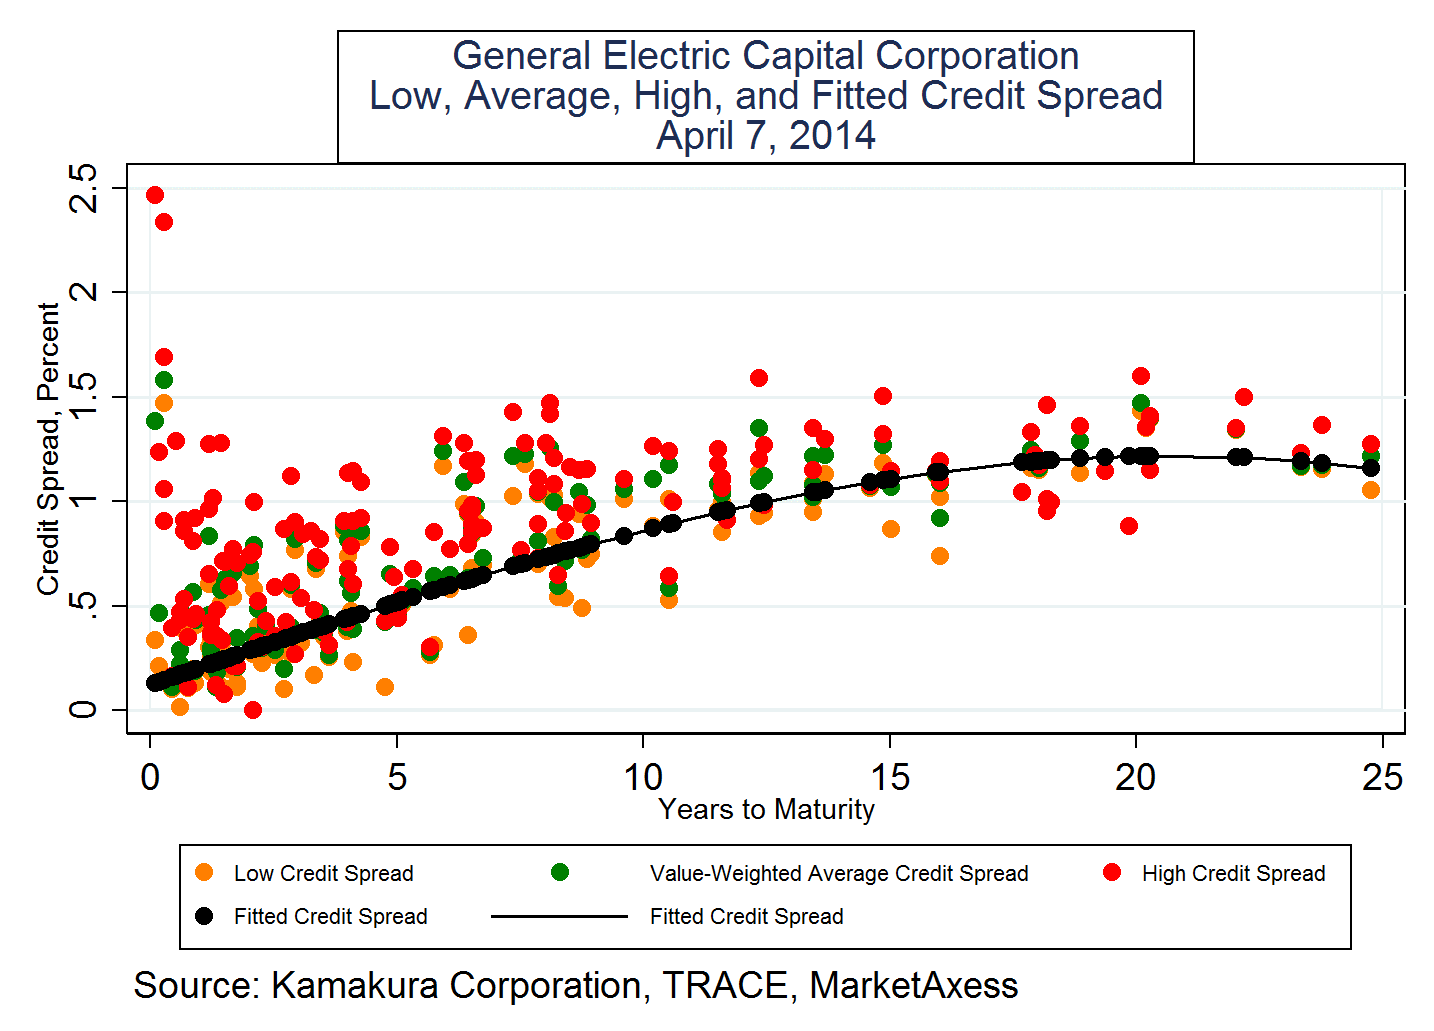
The high, low and average credit spreads at each maturity are graphed below. The black line represents the fitted cubic polynomial designed to minimize fitting errors on a trade-weighted basis. Credit spreads are generally increasing with the maturity of the bonds, peaking at about the 20-year maturity. We have done nothing to smooth the data reported by TRACE, which includes both large lot and small lot bond trades.
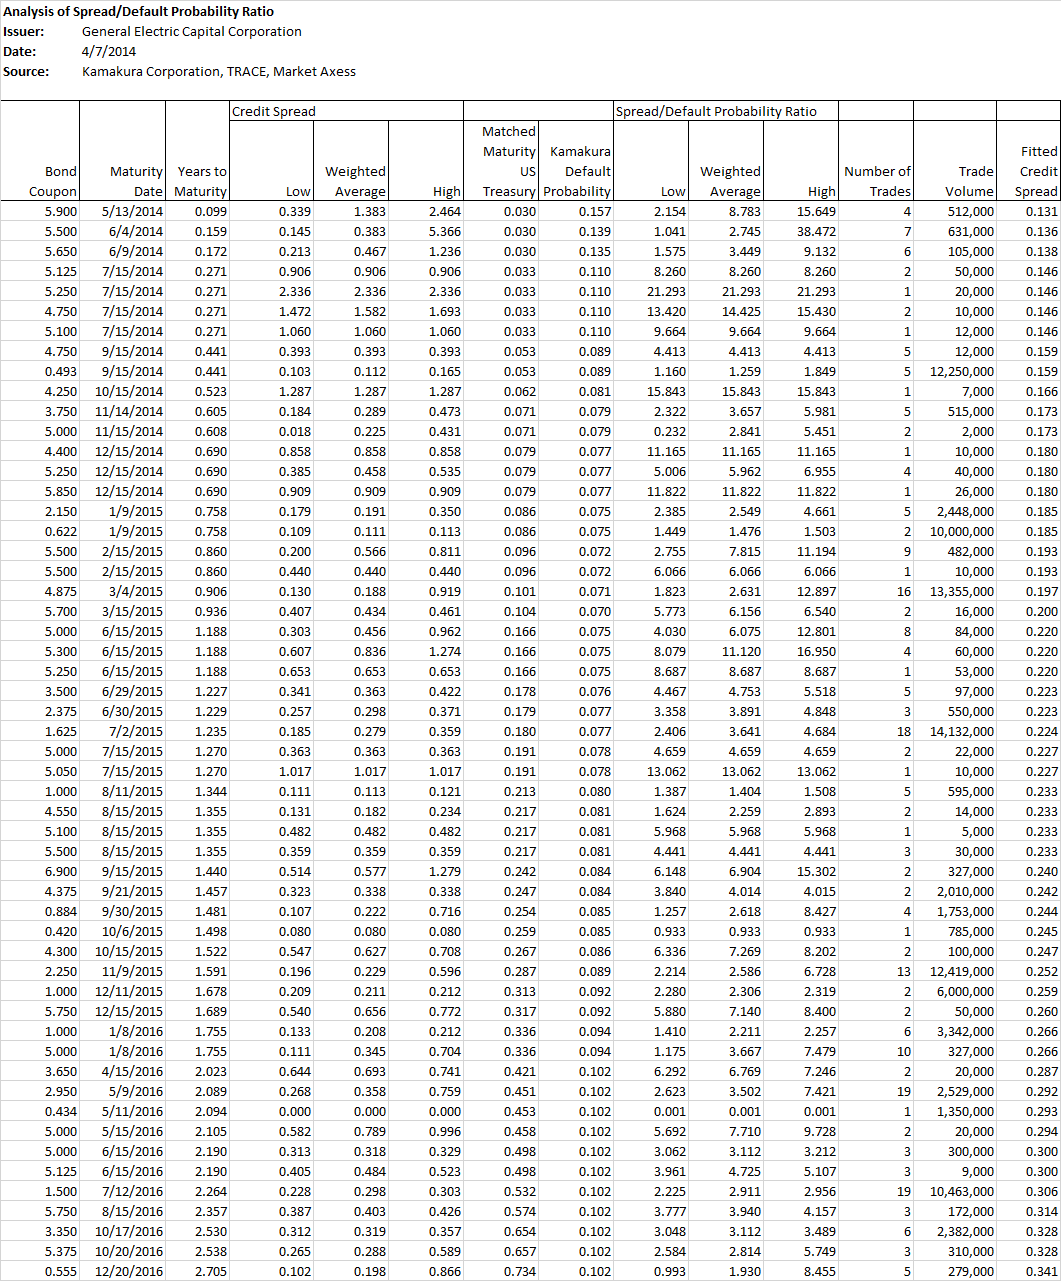
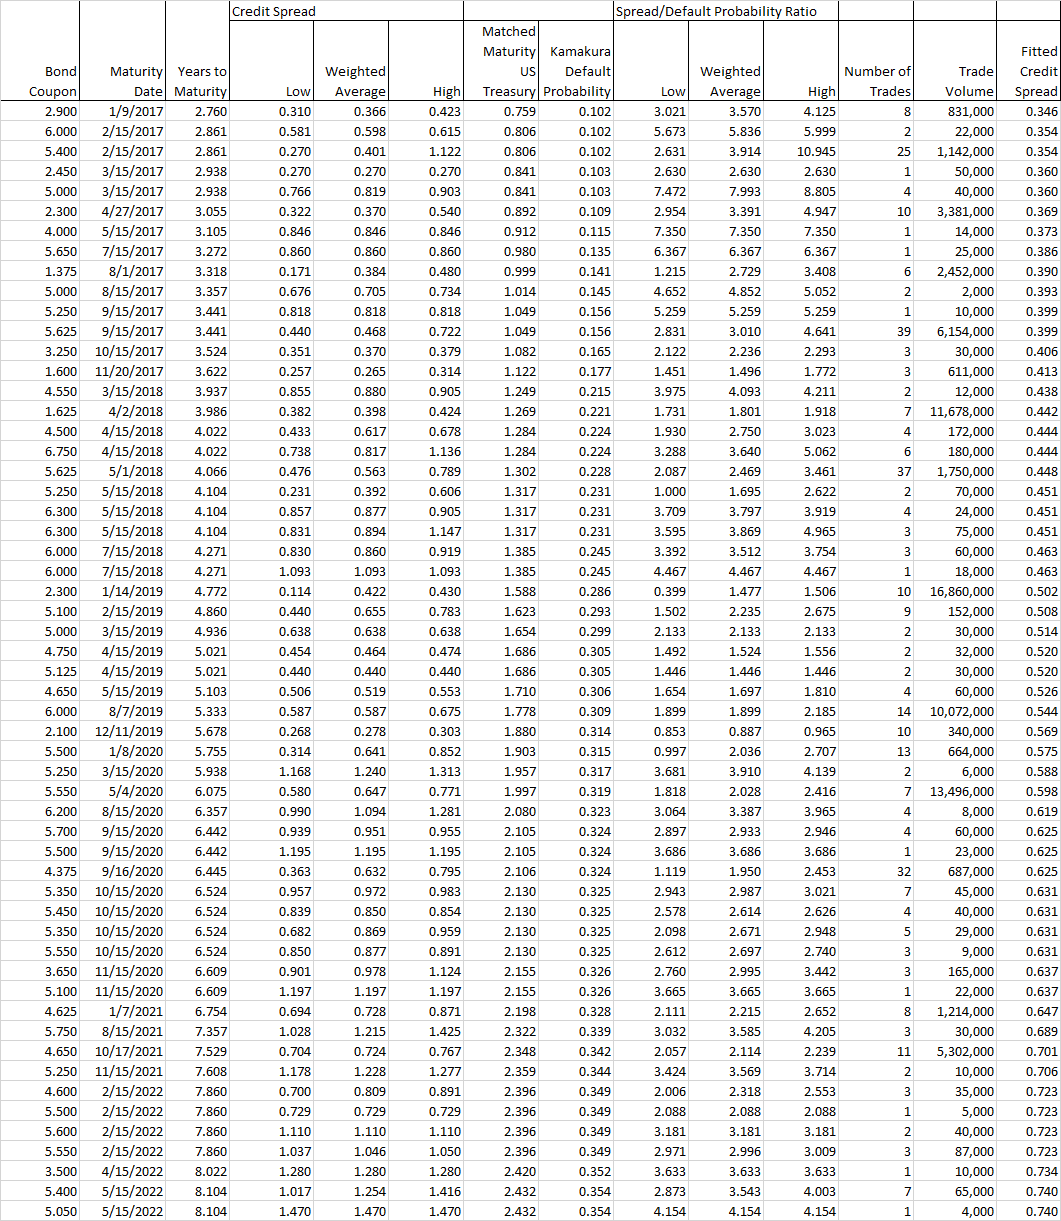
Using default probabilities in addition to credit spreads, we can analyze the number of basis points of credit spread per basis point of default risk at each maturity. This ratio of spread to default probability is shown in the following tables for General Electric Capital Corporation using the very important and optimistic assumption that the default probabilities of GECC are equal to those of General Electric Company. At short maturities, the credit spread to default probability ratio varies wildly, from about 1 times to more than 21 times. The ratio of spread to default probability decreases once the maturity of the bonds exceeds 5 years, falling to a spread to default ratio between 1 and 4 times.

The credit spread to default probability ratios are shown in graphic form here. We have again added a polynomial relating the credit spread to default probability ratio to the years to maturity on the underlying bonds.

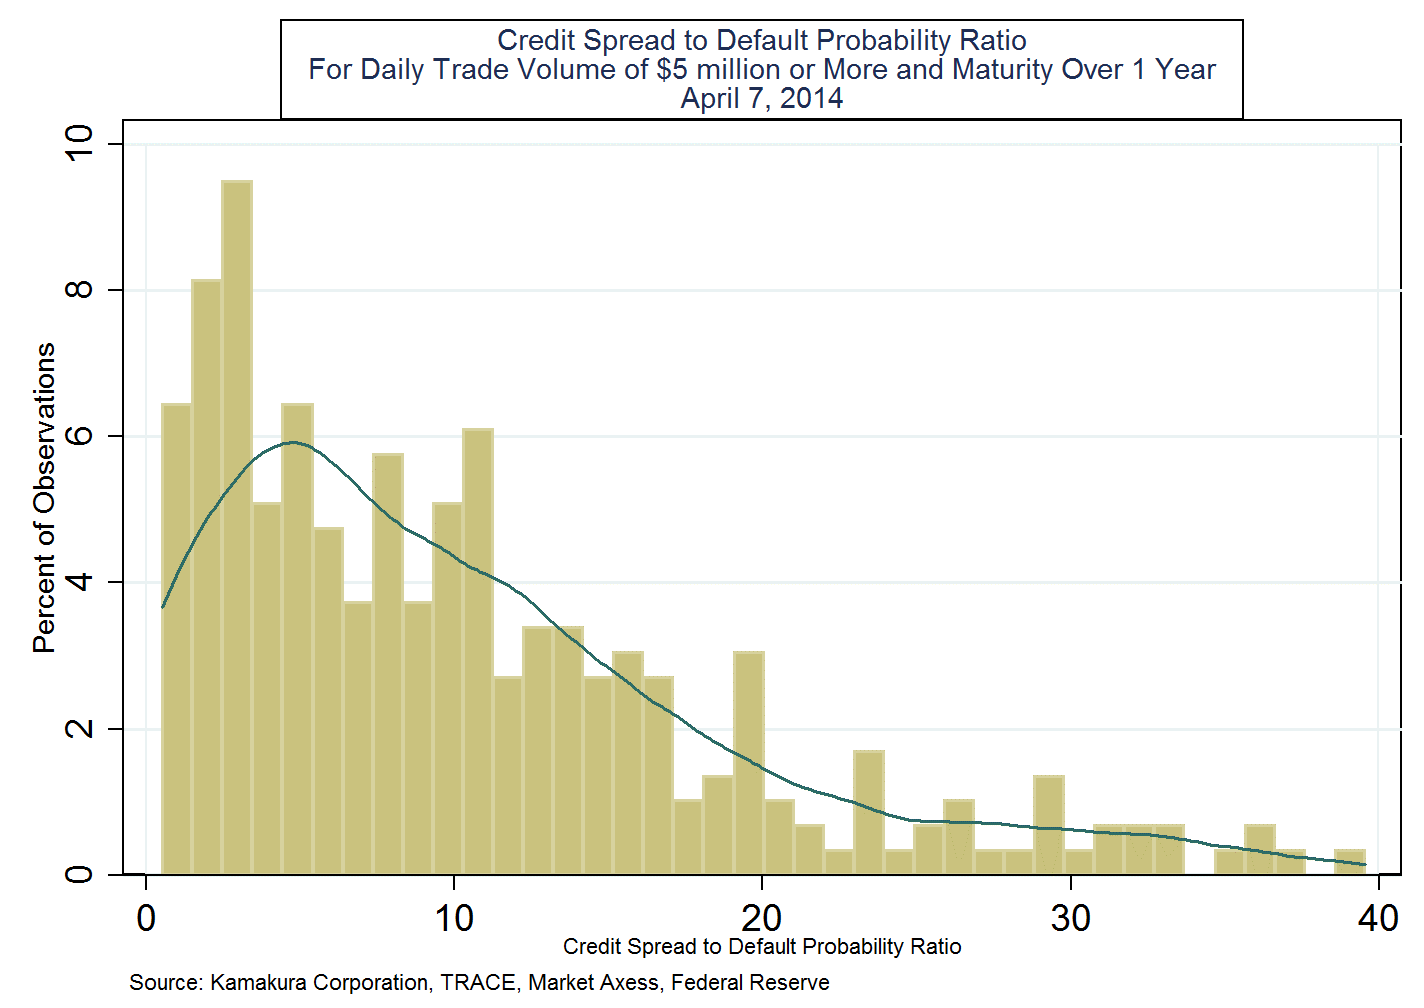
How do the ratios of credit spread to default probability for General Electric Capital Corporation compare with the ratios for other issuers? Are they high, normal, or low? The best way to answer these questions is to review this histogram of the credit spread to default ratio for all bond issues that traded at least $5 million on April 7, 2014. The median credit spread of the 310 trades was 0.848% and the median credit spread to default probability ratio was 9.099. The average credit spread to default probability ratio was 12.659.
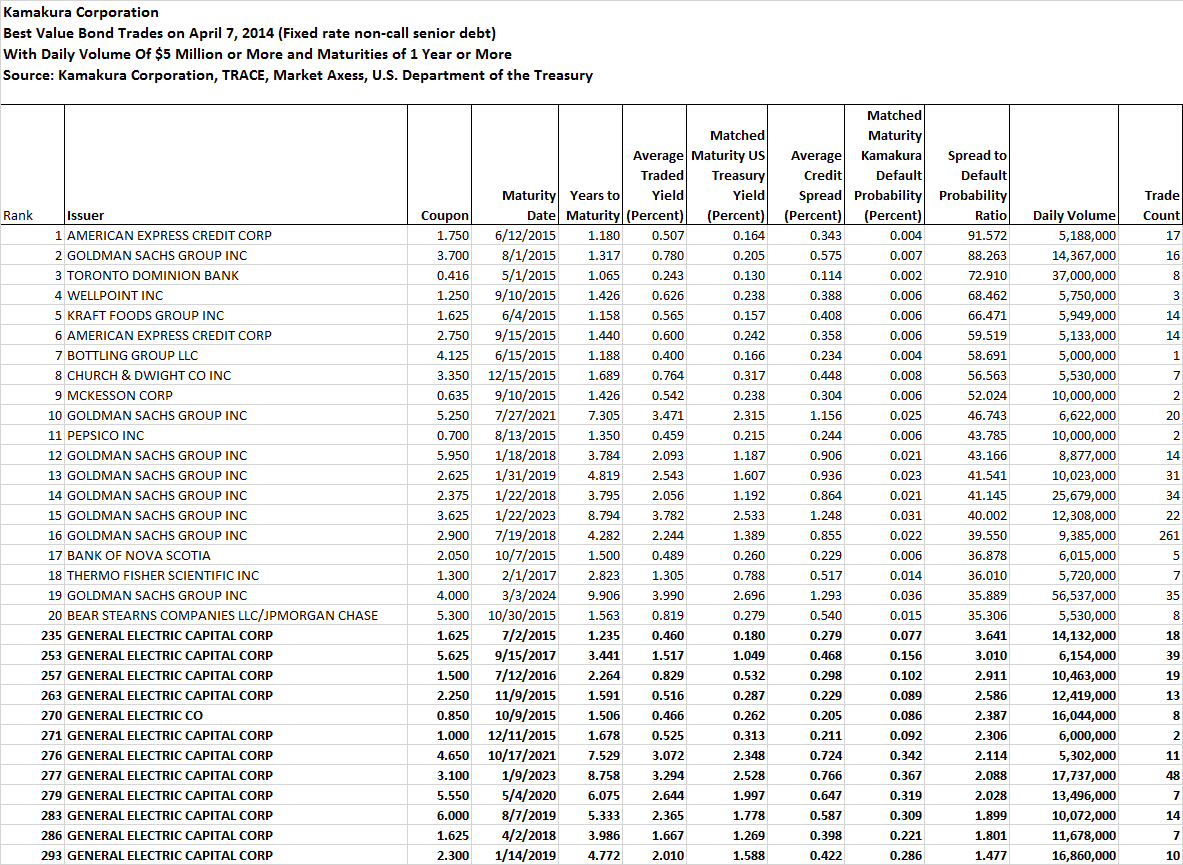
The next chart lists the best value bond trades for maturities of 1 year or more and trading volume of at least $5 million on April 7, 2014. 234 bond issues had a better ratio of credit spread to default probability than the best General Electric Capital Corporation bond, ranked 235th. The worst-ranking General Electric Capital Corporation bond was at 293rd out of the 310 bonds that met our criteria. The only heavily traded bond of General Electric Company, the parent, ranked 270th.
Insights from the Credit Default Swap Market
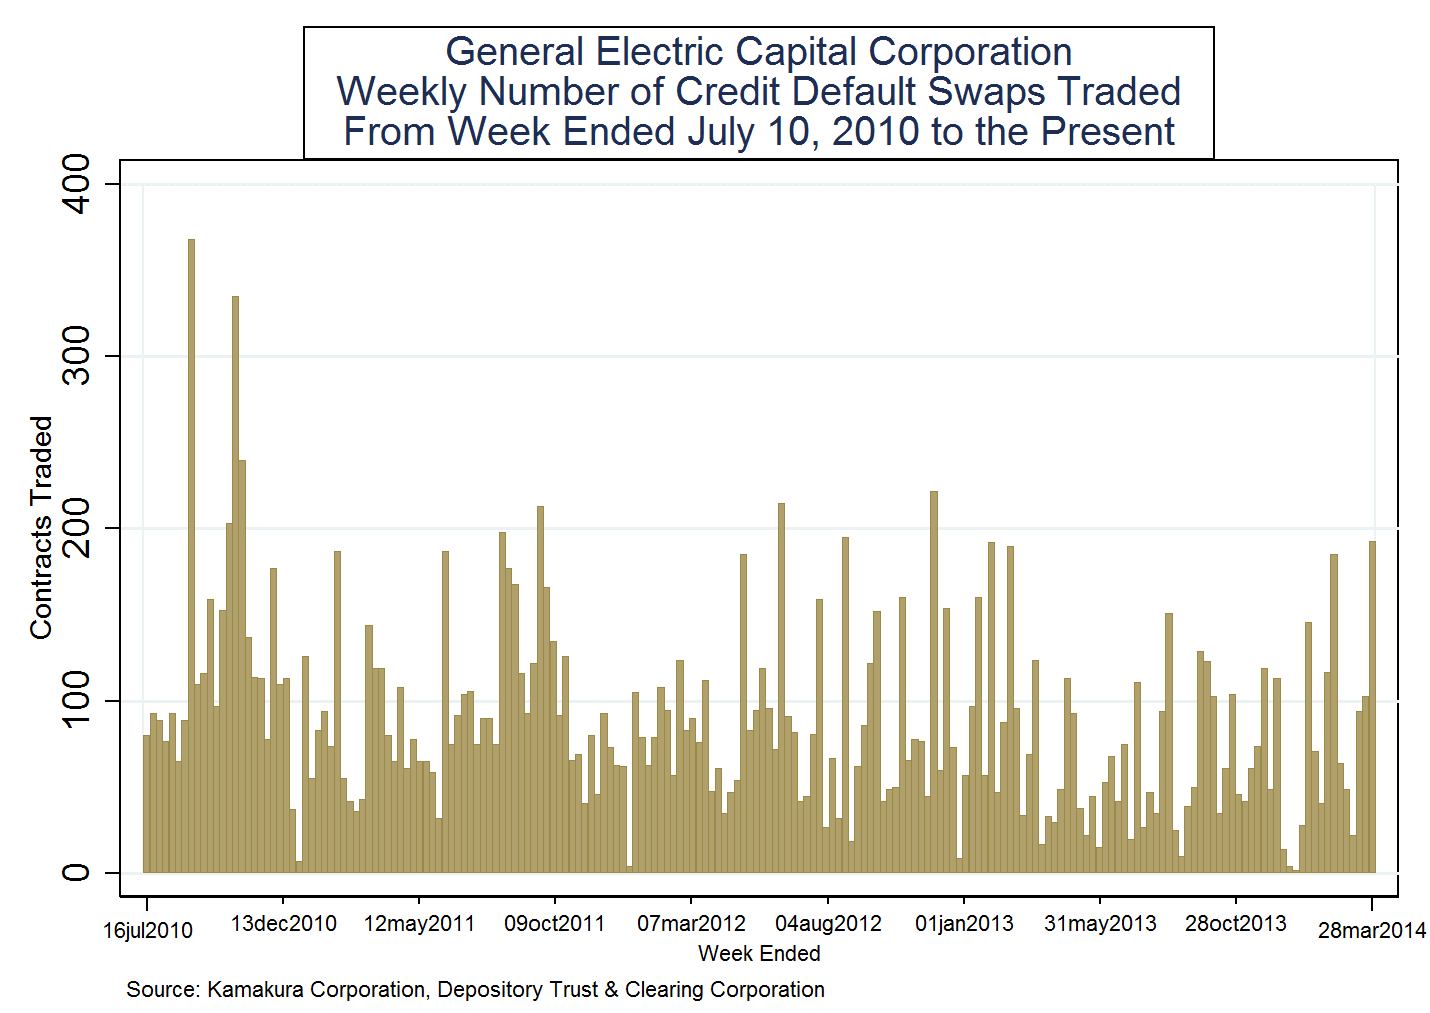
The Depository Trust & Clearing Corporation reports weekly on new credit default swap trading volume by reference name. For the week ended March 28, 2014 (the most recent week for which data is available), the credit default swap trading volume on General Electric Capital Corporation was 193 trades with $1,432.2 million of notional principal. General Electric Capital Corporation ranked 12th among all reference names in weekly credit default swap trading volume during the week. The next chart plots the number of credit default swaps traded on General Electric Capital Corporation since DTCC began releasing daily trading volume in July 2010.
The notional principal of credit default swaps traded weekly on General Electric Capital Corporation is shown here:

Additional Analysis
On a cumulative basis, the default probabilities for General Electric Company, the parent, range from 0.07% at 1 year (up 0.03% from December) to 3.85% at 10 years (up 0.24% from December), as shown in the following graph. Current cumulative default probabilities are shown in green. The December cumulative default probabilities are shown in yellow.
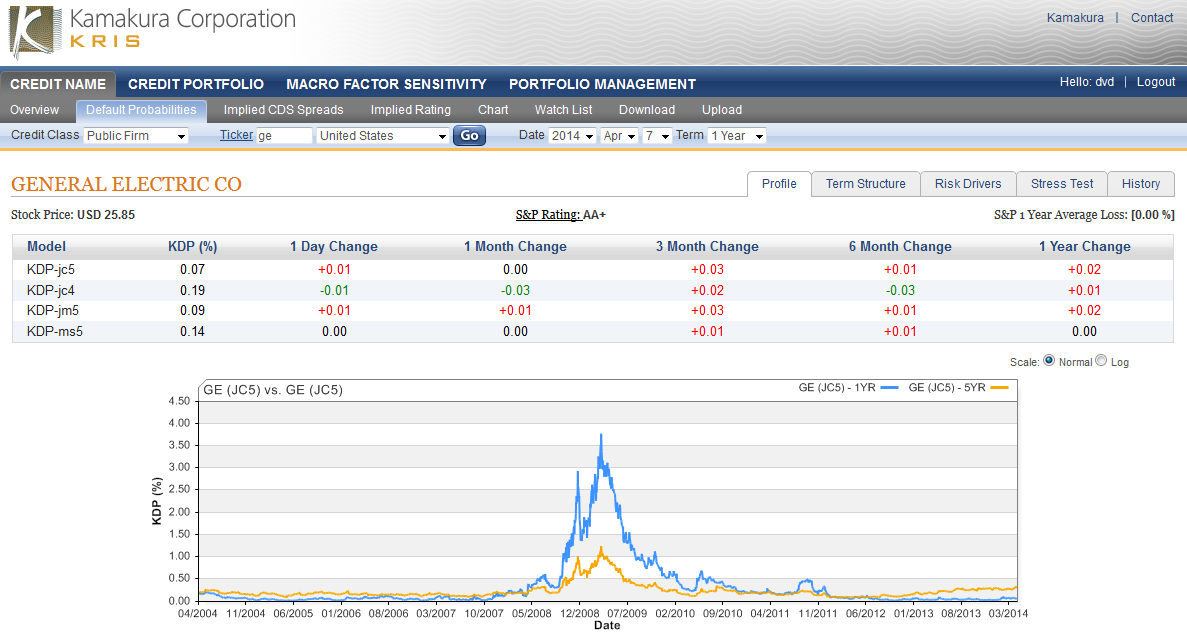
Over the last decade, the 1-year and 5-year default probabilities for General Electric Company, the parent, have varied as shown in the following graph. The one-year default probability peaked at just under 4.00% in the first half of 2009 during the worst part of the credit crisis. As we noted in our July 11, 2013 report, the General Electric family of companies was an active borrower under the Federal Reserve's Commercial Paper Funding Facility during the credit crisis. General Electric Capital Corporation was also an active issuer of debt guaranteed by the FDIC during the credit crisis, as noted above.
In contrast to the daily movements in default probabilities graphed above, the legacy credit ratings, those reported by credit rating agencies like McGraw-Hill (MHFI) unit Standard & Poor's and Moody's (MCO), for General Electric Company have changed only once during the decade. In the case of Standard & Poor's, the General Electric Company ratings have changed only once since 1956. The best statistical estimates of the legacy credit rating provided by Kamakura Risk Information Services show a predicted rating 6 notches below the current legacy rating of General Electric Company, a high degree of "over-rating."
The macro-economic factors driving the historical movements in the default probabilities of General Electric Company, the parent, have been derived using historical data beginning in January 1990. A key assumption of such analysis, like any econometric time series study, is that the business risks of the firm being studied are relatively unchanged during this period. With that caveat, the historical analysis shows that General Electric Company's default risk responds to changes in 4 key factors among those listed by the Federal Reserve in its 2014 Comprehensive Capital Analysis and Review. These macro factors explain 72.6% of the variation in the default probability of General Electric Company. The remainder of the variation in default probabilities, 27.4% of the total, is the idiosyncratic risk of the firm.
General Electric Company, the parent, can be compared with its peers in the same industry sector, as defined by Morgan Stanley (MS) and reported by Compustat. For the US "capital goods" sector, General Electric Company has the following percentile ranking for its default probabilities among its 400 peers at these maturities:
1-month 78th percentile, up from the 76th percentile in December
1-year 60th percentile, up from the 56th percentile
3 years 48th percentile, up from the 39th percentile
5 years 37th percentile, up from the 35th percentile
10 years 34th percentile, up from the 33th percentile
The percentile ranking of General Electric Company default probabilities at one month through one year is in the riskiest half of the capital goods peer group, and the percentile rankings have deteriorated since December. The percentile ranking for General Electric Company at 3 through 10 years is in the 2nd safest quartile of credit risk among capital goods firms.
Conclusions
As always in this series, our conclusions are based on facts from the marketplace, not the individual opinions of the author. We first compare General Electric Company and General Electric Capital Corporation to their sector peers, and then we make a comparison to investment grade firms.
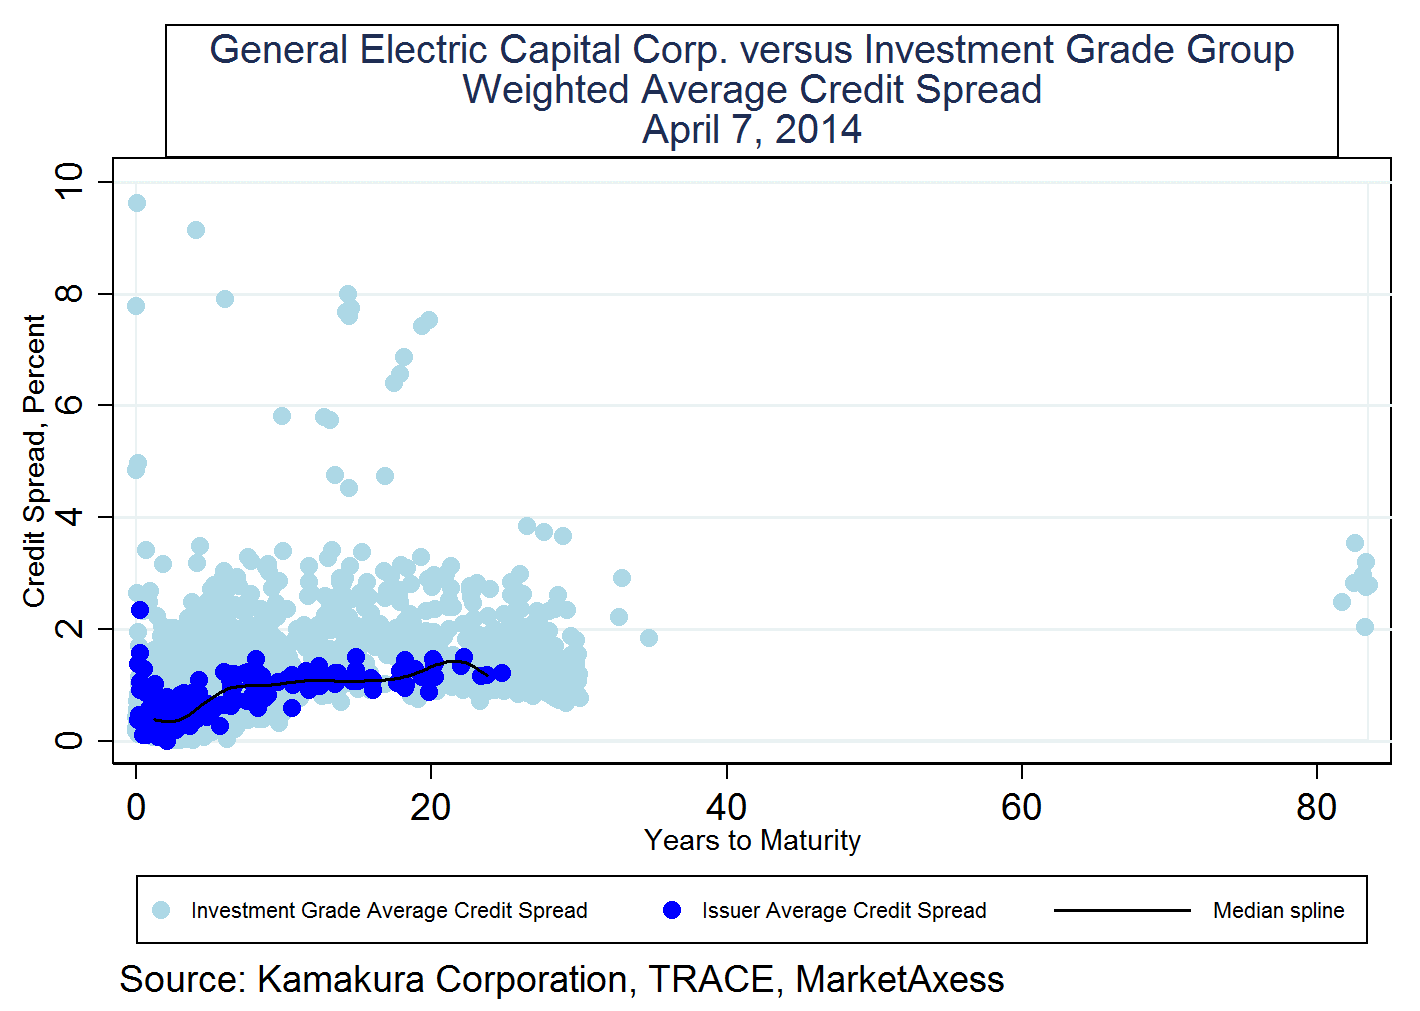
Sector peer credit spreads
For purposes of this comparison, we use the sector definition provided by MarketAxess. Unlike Morgan Stanley's classification of General Electric Company in the "capital goods" sector, MarketAxess labels General Electric Company as being in the "banks/finance" sector. Relative to those peers whose fixed rate non-call bonds traded on April 7, General Electric Capital Corporation credit spreads were below the median as shown in this graph:
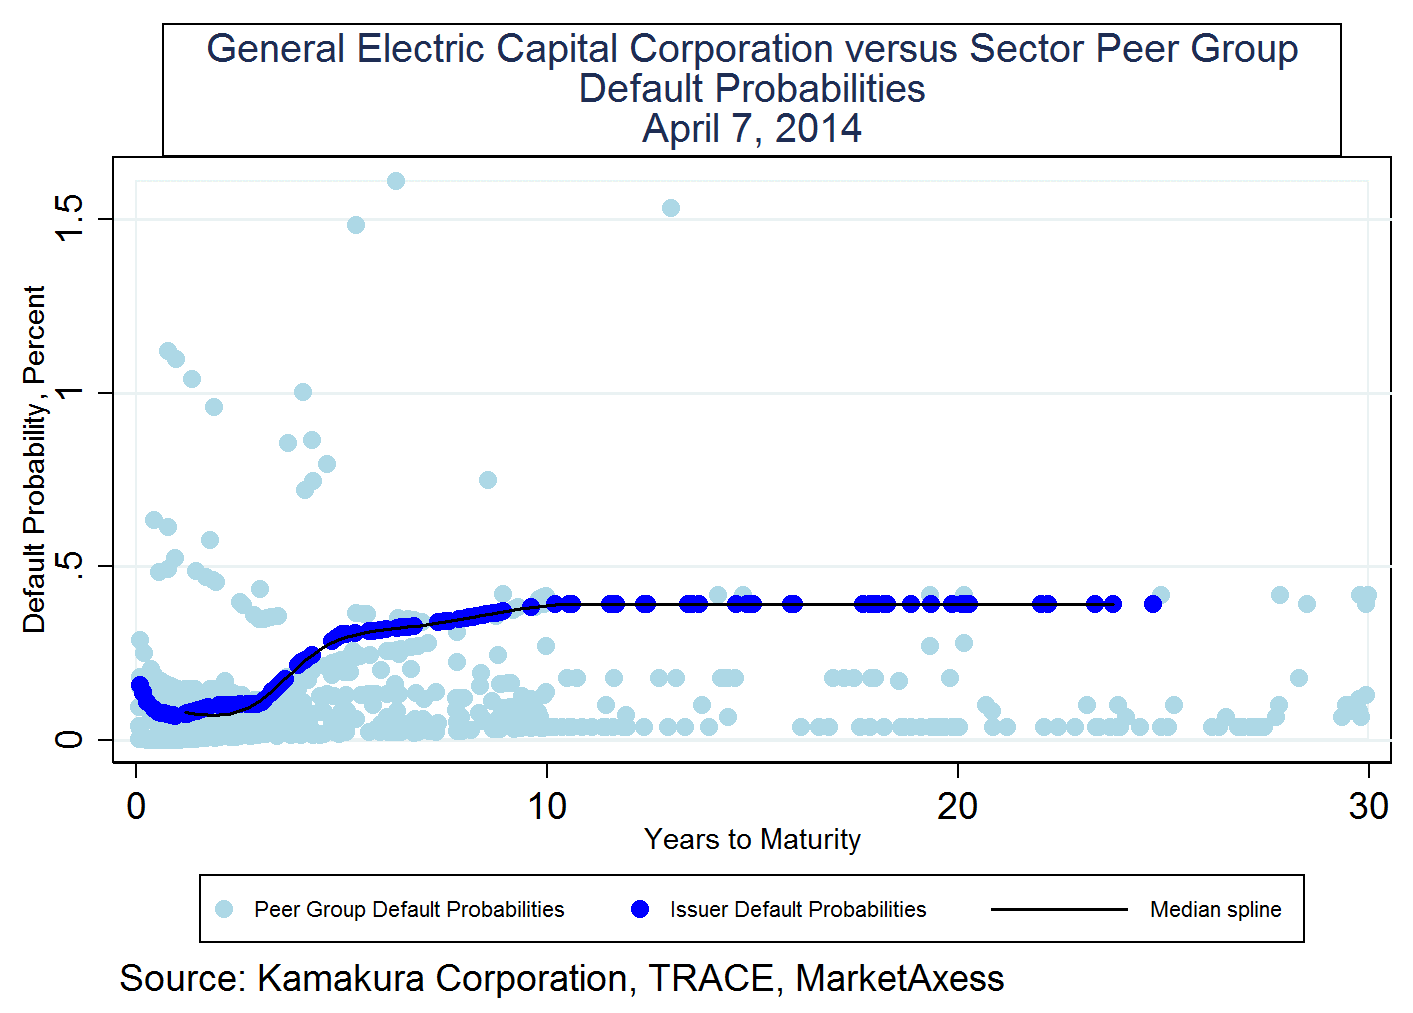
Sector peer default probabilities
When we plot the default probabilities of General Electric Company versus the default probabilities of the peer group whose bonds traded on April 7, the comparison is not nearly as favorable. General Electric Company's default probabilities rank well above the median of the peer group.
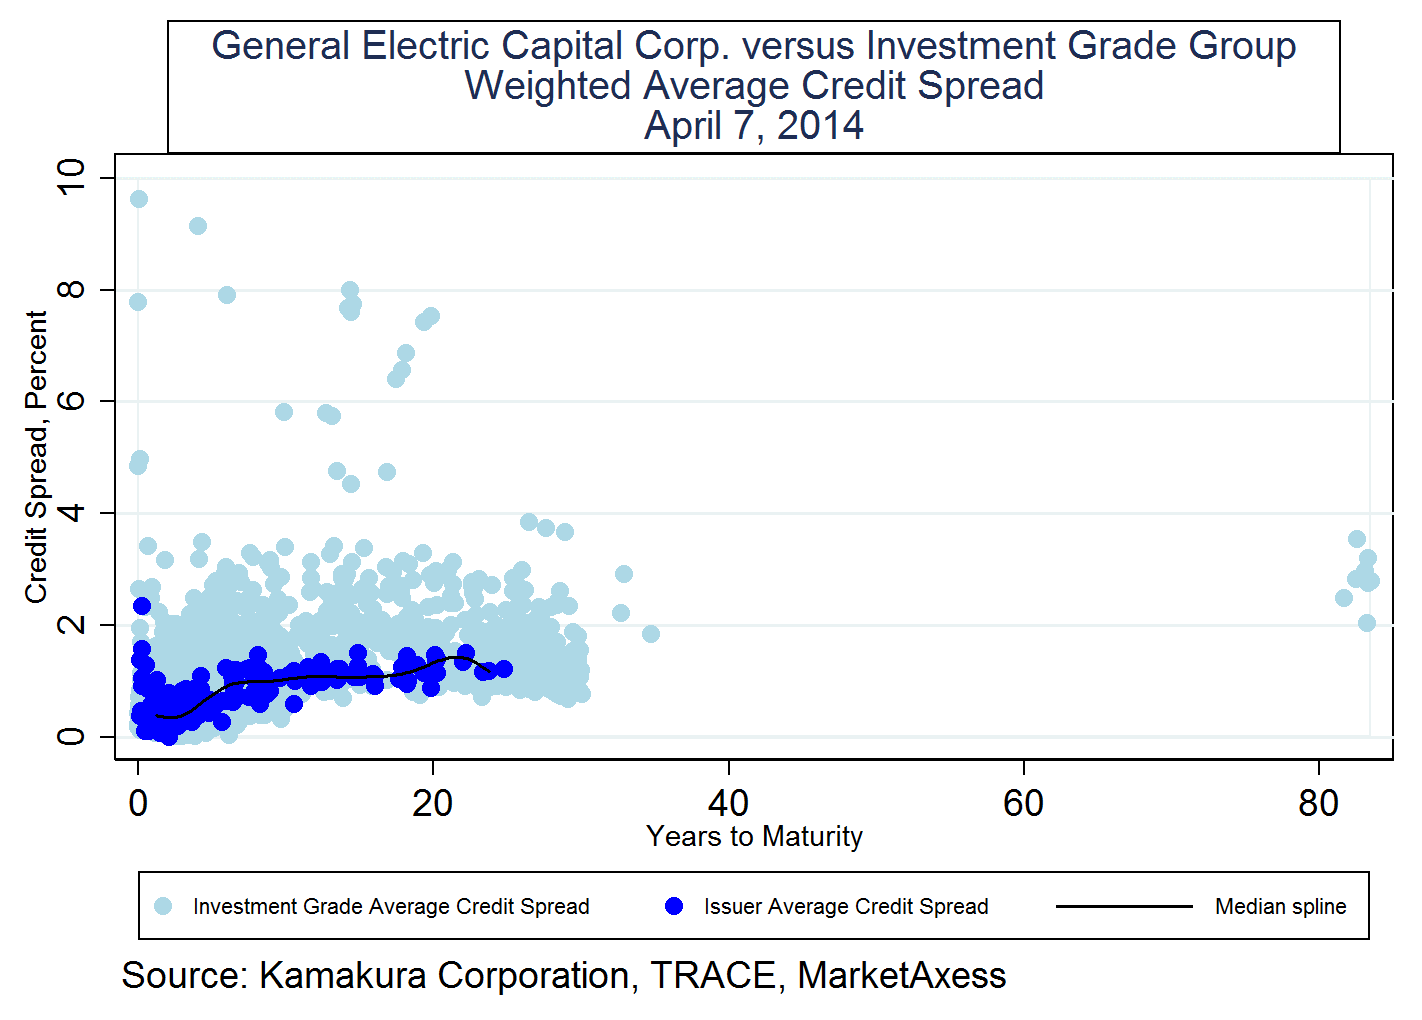
Investment grade credit spreads
We now turn to a comparison of the credit spreads for all bonds traded on April 7 and issued by firms with a legacy classification of "investment grade" by the major rating agencies. The credit spreads of General Electric Capital Corporation are at or below the median in this chart:
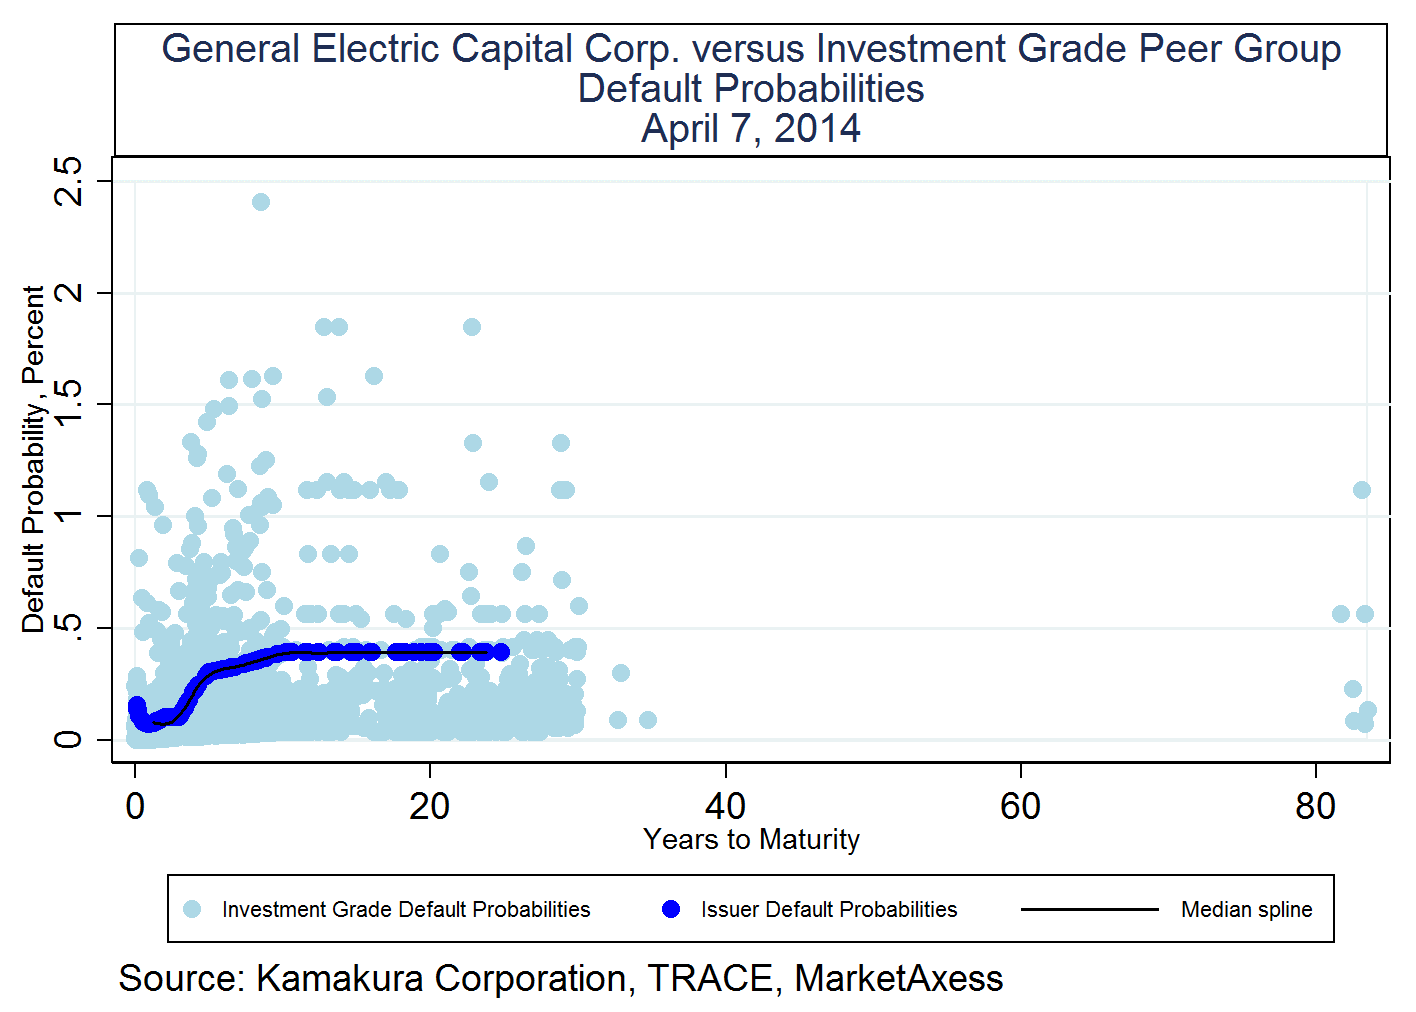
Investment grade default probabilities
When we compare the default probabilities of General Electric Company with the matched-maturity default probabilities of the investment grade firms whose bonds traded on April 7, we again find General Electric Company at or above the median.
Our conclusions about General Electric Company are much the same as the conclusions we reached in December: the firm is a complex credit. Its financial services subsidiary, General Electric Capital Corporation, is more complex still. The viability of a financial services firm that relies completely on wholesale markets for funding is questionable, and we therefore applaud the decision to spin-off the North American retail credit card business. During the last twenty years, many famous names have abandoned the wholesale funding business model either voluntarily or involuntarily, through merger or failure: Industrial Bank of Japan, Long-term Credit Bank of Japan, Nippon Credit Bank, Bank of Tokyo, Continental Illinois, First Chicago, Bankers Trust, and JPMorgan (JPM). Given the riskiness of the wholesale funding strategy, it remains remarkable that the parent company General Electric Company has determined that a lukewarm income maintenance agreement with General Electric Capital Corporation is the strongest credit support it is willing to give. We expect that to evolve if the spin-offs continue.
While there is no doubt that a strong majority of analysts would rate the bonds of General Electric Capital Corporation as investment grade, the reward for bearing the risk of default or a larger spin-off from General Electric Company is only one-third of the average compared to 310 other corporate fixed rate bond issues that traded more than $5 million on April 7, 2014. Investors would have received better returns on 234 of those 310 issues than the most attractive General Electric Capital Corporation bonds.
Author's Note
Regular readers of these notes are aware that we generally do not list the major news headlines relevant to the firm in question. We believe that other authors on Seeking Alpha, Yahoo, at The New York Times, The Financial Times, and the Wall Street Journal do a fine job of this. Our omission of those headlines is intentional. Similarly, to argue that a specific news event is more important than all other news events in the outlook for the firm is something we again believe is inappropriate for this author. Our focus is on current bond prices, credit spreads, and default probabilities, key statistics that we feel are critical for both fixed income and equity investors.
Disclosure: I have no positions in any stocks mentioned, and no plans to initiate any positions within the next 72 hours. I wrote this article myself, and it expresses my own opinions. I am not receiving compensation for it. I have no business relationship with any company whose stock is mentioned in this article.
Additional disclosure: Kamakura Corporation has business relationships with a number of organizations mentioned in the article.