The main thrust of this analysis is concentrated in three parts. The first two parts are based on free cash flow (current and historical) and the third is based on historical price action as a gauge of investor sentiment.
The three methods used in this analysis are:
1) Price to Owners Earnings (OE) = Current and future analysis
2) Cumulative Owners Earnings (COE) = Historical analysis of owners earnings
3) Statistical Indicator Analysis (SIA) = Historical price action
For those new to this analysis please link here for an introduction: OE and COE, SIA, CapFlow.
The main goal of my analysis is first to determine a sell price. With that in mind, we attempt to buy the stock at half its sell price and then hold it for 5 years (provided that no macro- economic negative catalysts force us to sell). Due to the fact that we bought it at par, we can potentially achieve an average annualized return of 15% per year. This may enable us to double our money every 5 years. Occasionally we do find a stock that is not selling at par, but is actually selling at a discount. When this happens, gains are usually higher.
Analysis of ITT Corporation (NYSE:ITT)
Today I was reading the news on Seeking Alpha and I came across the following:
Wednesday 8:40 AM ITT Industries will split into three publicly-traded companies: water technology, defense operations, and its core industrials business. 2011 revenue for the three is projected at $3.6B, $5.8B and $2.1B respectively.
I have admired ITT Corporation for decades and remember the good old days when they were one of the largest conglomerates around. I was happy in 1995 when they split off their ITT Hartford Insurance division and their ITT Destinations (Hotel and Entertainment) and was even more pleased in 1998 when they sold off their auto parts division as those divisions did not fit well with my free cash flow philosophy. Today’s news was a bit of a shocker to me, as the company in its present state is a real free cash flow generator and I cannot see how splitting the company up into three parts will improve on that fact.
Usually managements likes to split off divisions that are hurting the bottom line or are the weakest link. For example when IBM sold of their desktop/laptop division to Lenovo (OTCPK:LNVGY) of China, that was a brilliant move, because they got rid of a low margin/capital intensive division in order to move to a more services/software/mainframe company with much improved free cash flow and CapFlow numbers.
With this move they made Wednesday, ITT’s management deeply curtailed their power of Economies of Scale. The whole advantage of being a large cap company is that your cost per unit shrinks as your company grows, because you are buying in bulk and get ever greater discounts from suppliers. This is important as it reduces your CapFlow and increases your Owners Earnings. Let me now show you the numbers in order to back up my statement.
The following is a table housing ITT’s Owners Earnings data from 1993-2010 (including estimates);
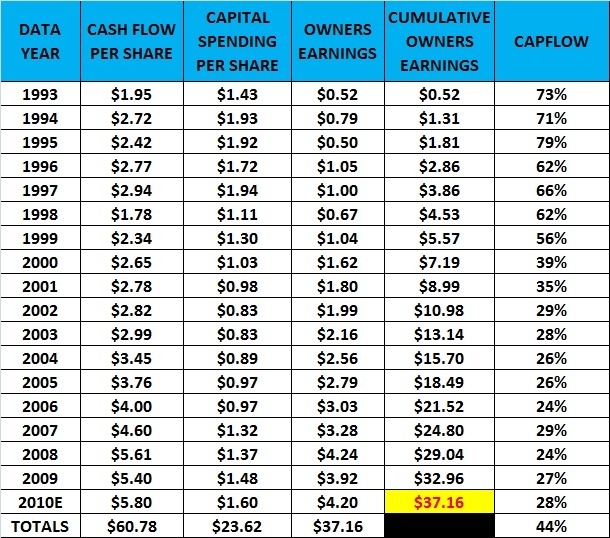
As you can see from the table above, ITT is a Free Cash Flow powerhouse and its CapFlows have been shrinking steadily from 73% in 1993 to 28% for 2010. You will also notice that just two years after selling off their auto parts division (1998), they achieved a massive drop in their CapFlow from 62% to 39%, so that was a brilliant move by management. Here is ITT’s CapFlow chart:
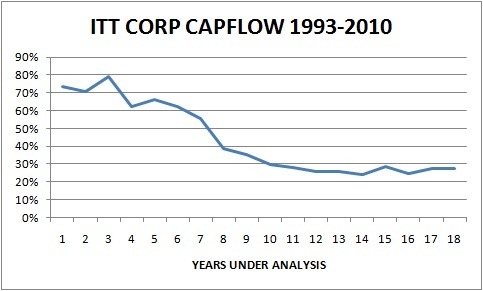
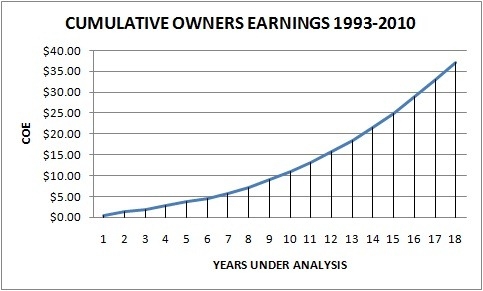
Clearly, Economies of Scale have greatly helped the company. This should not continue to be the case - when they split the company up they will lose the power of EOS. As for Cumulative Owners Earnings (COE), the company has produced some serious COE in less than two decades. Here is the COE chart that proves that:
Well what is done is done and I now need to come up with the three sell prices to determine the Mycroft Research buy and sell prices for ITT. Before I do that I must first state that the company’s stock closed at $61.50 Wednesday, up an incredible +16.52% in just one day. So obviously there are many out there that disagree with me as they piled into the stock.
The first thing we need to do is determine our Price to Owners Earnings (P/OE) sell price. If you look at the table at the beginning of this article, you will see that for 2010 ITT is estimated to generate $4.20 per share in OE. Since we like to sell at 30 times (P/OE), our sell price would be $4.20 X 30 = $126.
COE came in at $37.16 and since we like to sell at two times that number we get $37.16 X 2 = $74.32.
Having two of our three sell prices, we just need our SIA sell price to determine our MR buy price.
Here is the chart for ITT’s SIA :
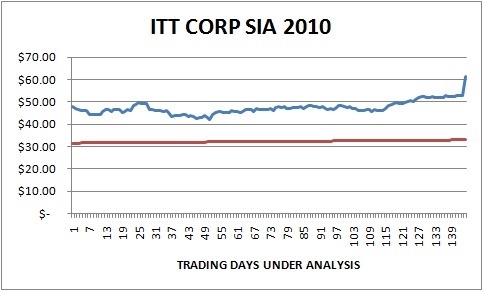
As you can see, the SIA for ITT has a short history as it only just achieved its 3651st trading day on June 21, 2010 and has just 154 days of SIA data. But nevertheless once you achieve that 3651st trading day, the results are just as good as a company that has been around for 7000 trading days. But to make it easier on the eyes here is the same chart from a Price to SIA percentage point of view:
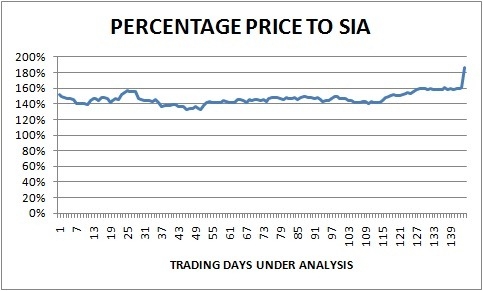
Since we like to sell at 200% or 2.0 times a company’s SIA, Wednesday’s action brought us to a new level in our analysis and closer to our sell price. The current SIA for ITT Corp is $32.95, so $32.95 X 2 = $65.90.
So for ITT we now have three separate sell prices and can now complete our Mycroft Research.
1) P/OE = $126.00 (30 times OE per Share)
2) COE = $74.32 (2 times COE)
3) SIA = $65.90 (2 times SIA)
Total = $266.22/3 = $88.74 = Sell Price
Buy Price = $44.37
Conclusion = ITT Corp. is a Hold
Disclosure: My Clients at Mycroft Research LLC and Geasphere LLC. are long IBM, No Position in ITT, Lenovo