Thursday was a lousy day for equity investors. U.S. stocks, as measured by the S&P 500 Index, dropped by -1.62%, which represented its fifth worst decline in 2014 thus far. When putting this latest decline into perspective, it appears at first glance that the bulls still have good reason to remain optimistic. But when exploring deeper under the surface, troublesome signs are increasingly accumulating that may be hinting that a far more significant change in the long-term market trend may soon be on its way.
First, the good news. Yes, stocks had a lousy day on Thursday. But this was arguably less surprising than what was a notably strong day of trading on Wednesday, when the S&P 500 (SPY) reversed during morning trade and ended the day up +15.5 points. For after today's pullback, stocks simply returned to their recent downward sloping trading channel that they had been moving since the beginning of the week. And when taking Wednesday's and Thursday's trading in aggregate, the S&P 500 Index is down a far more reasonable 17 points, or -0.85%, over the last two trading days.
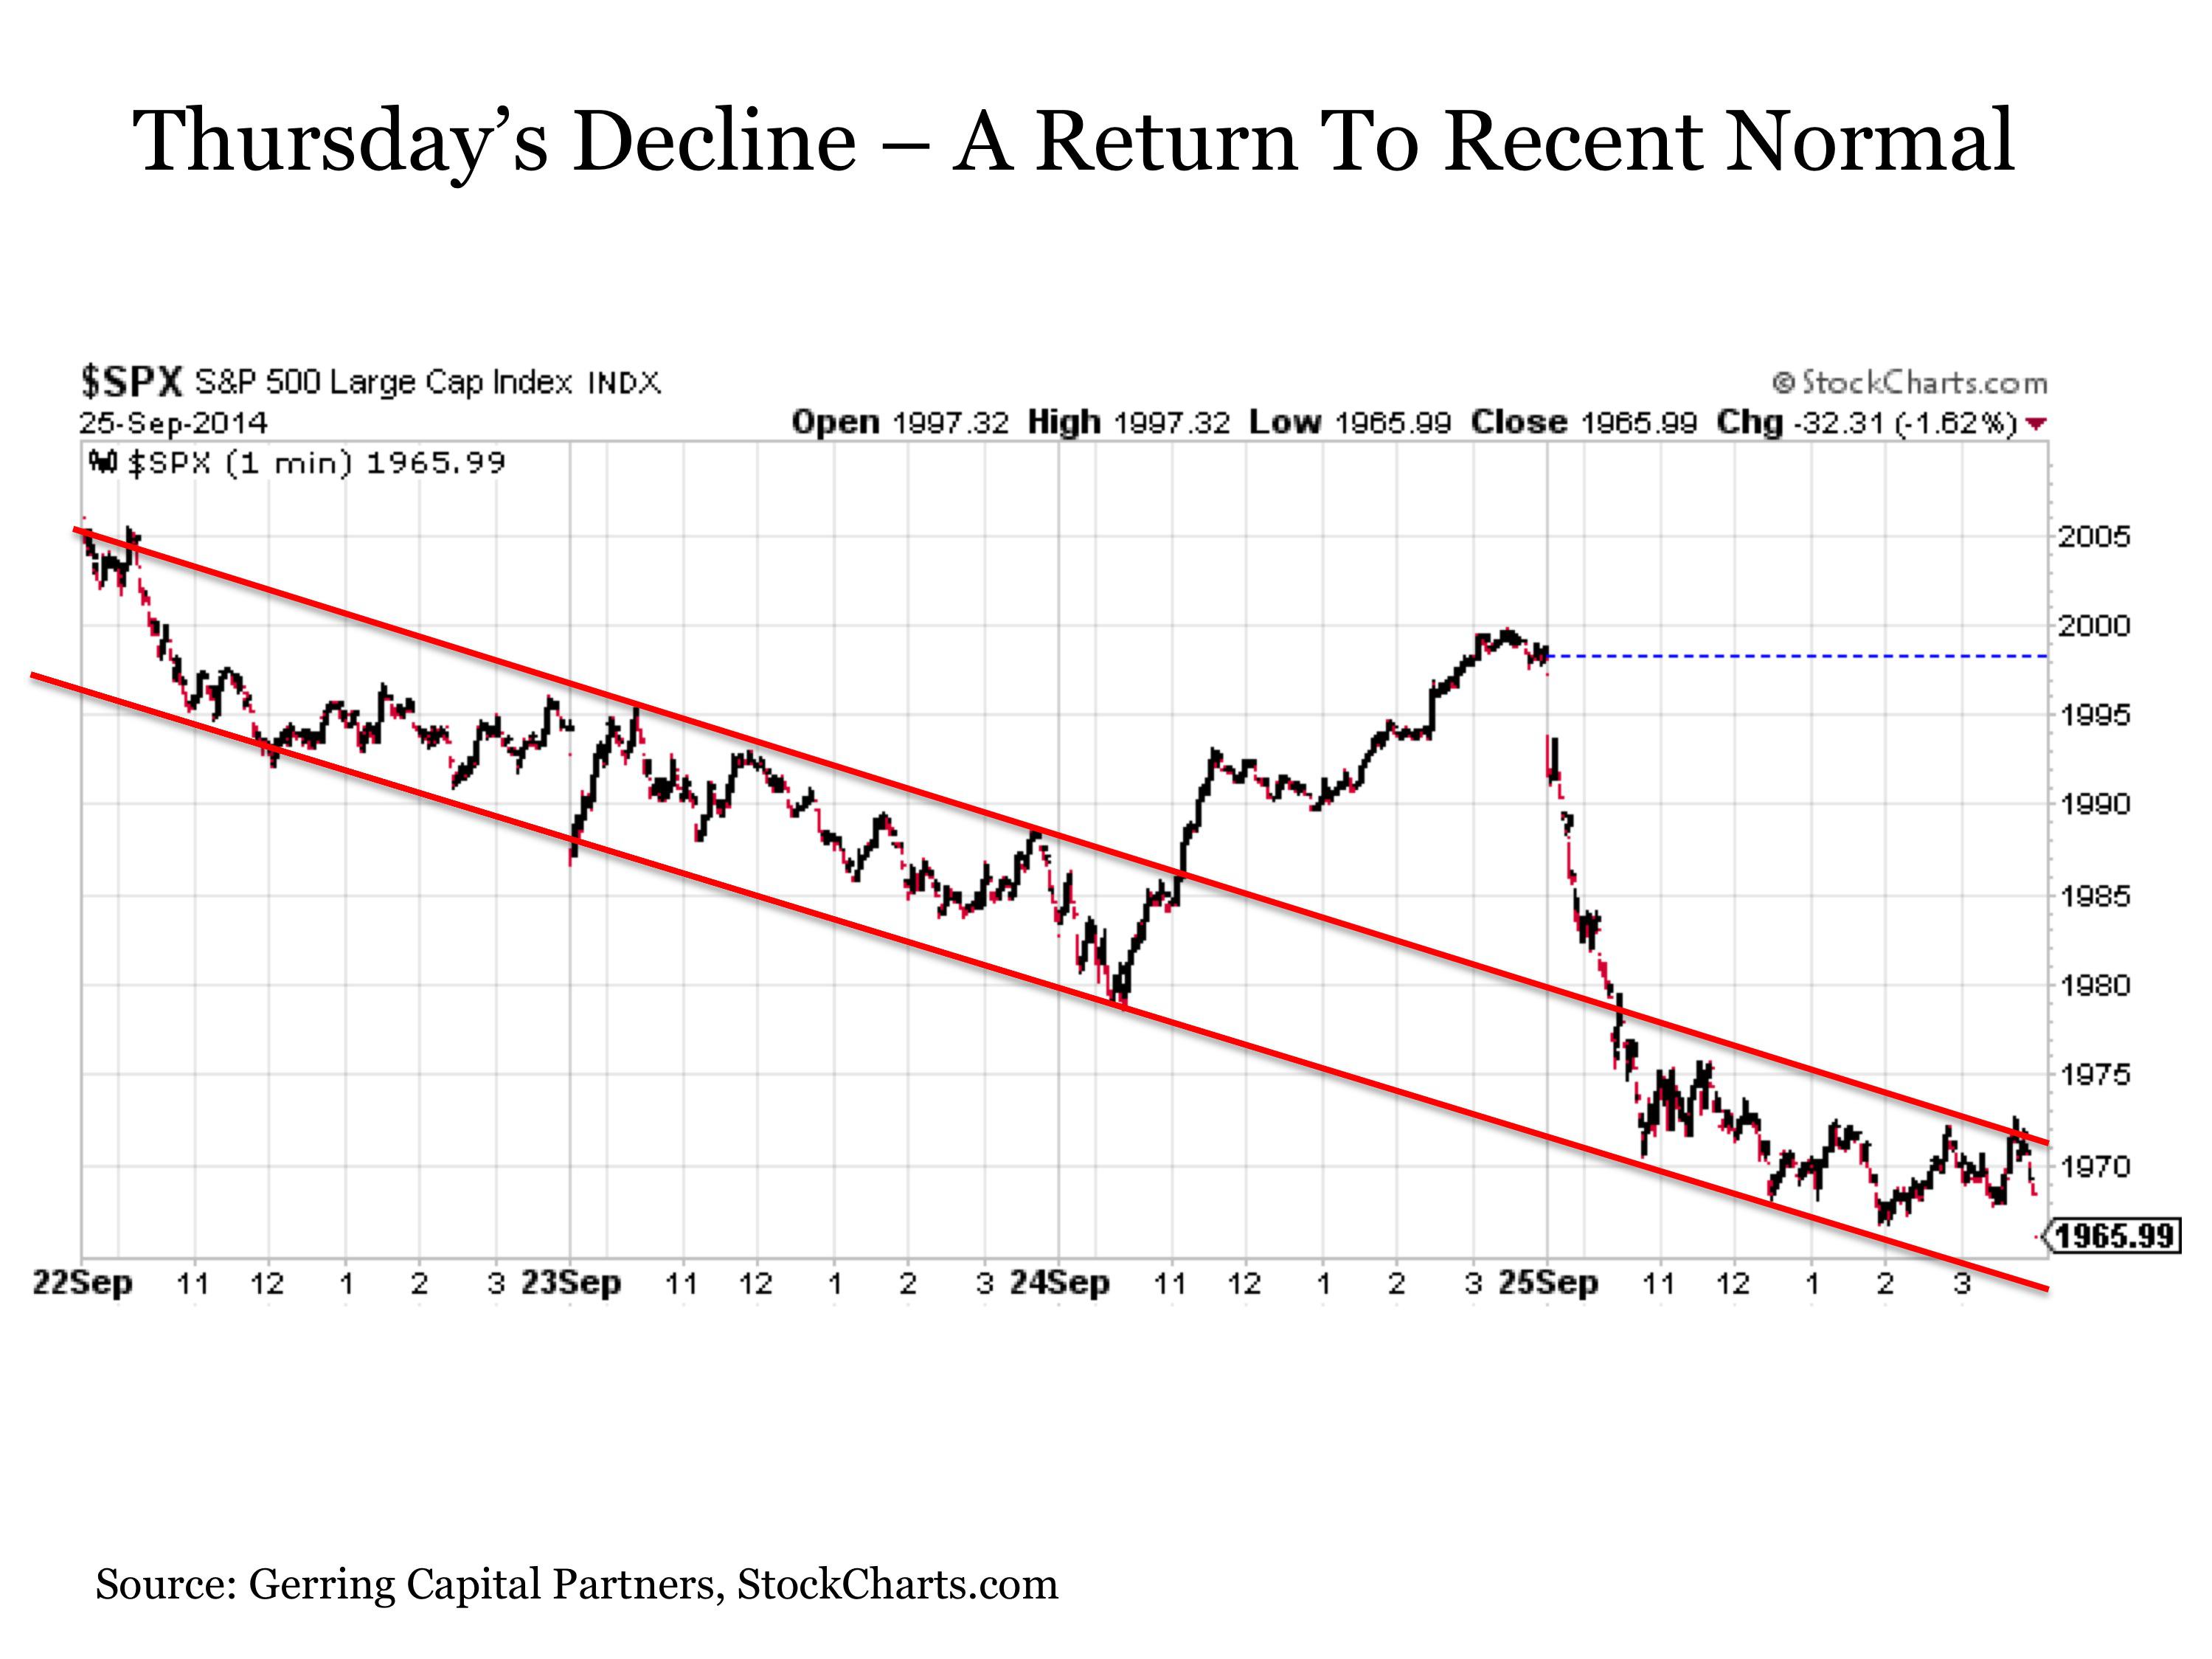
In addition, it is worth pointing out yet again that stocks are now down just over -2% from their all-time intraday high reached last Friday. Any market trading that is trading within a rounding error of record highs is not one that should be ringing any alarm bells just yet. After all, today's closing price after what was a notable sell-off would have represented a new all-time high in the S&P 500 Index as recently as June 30.
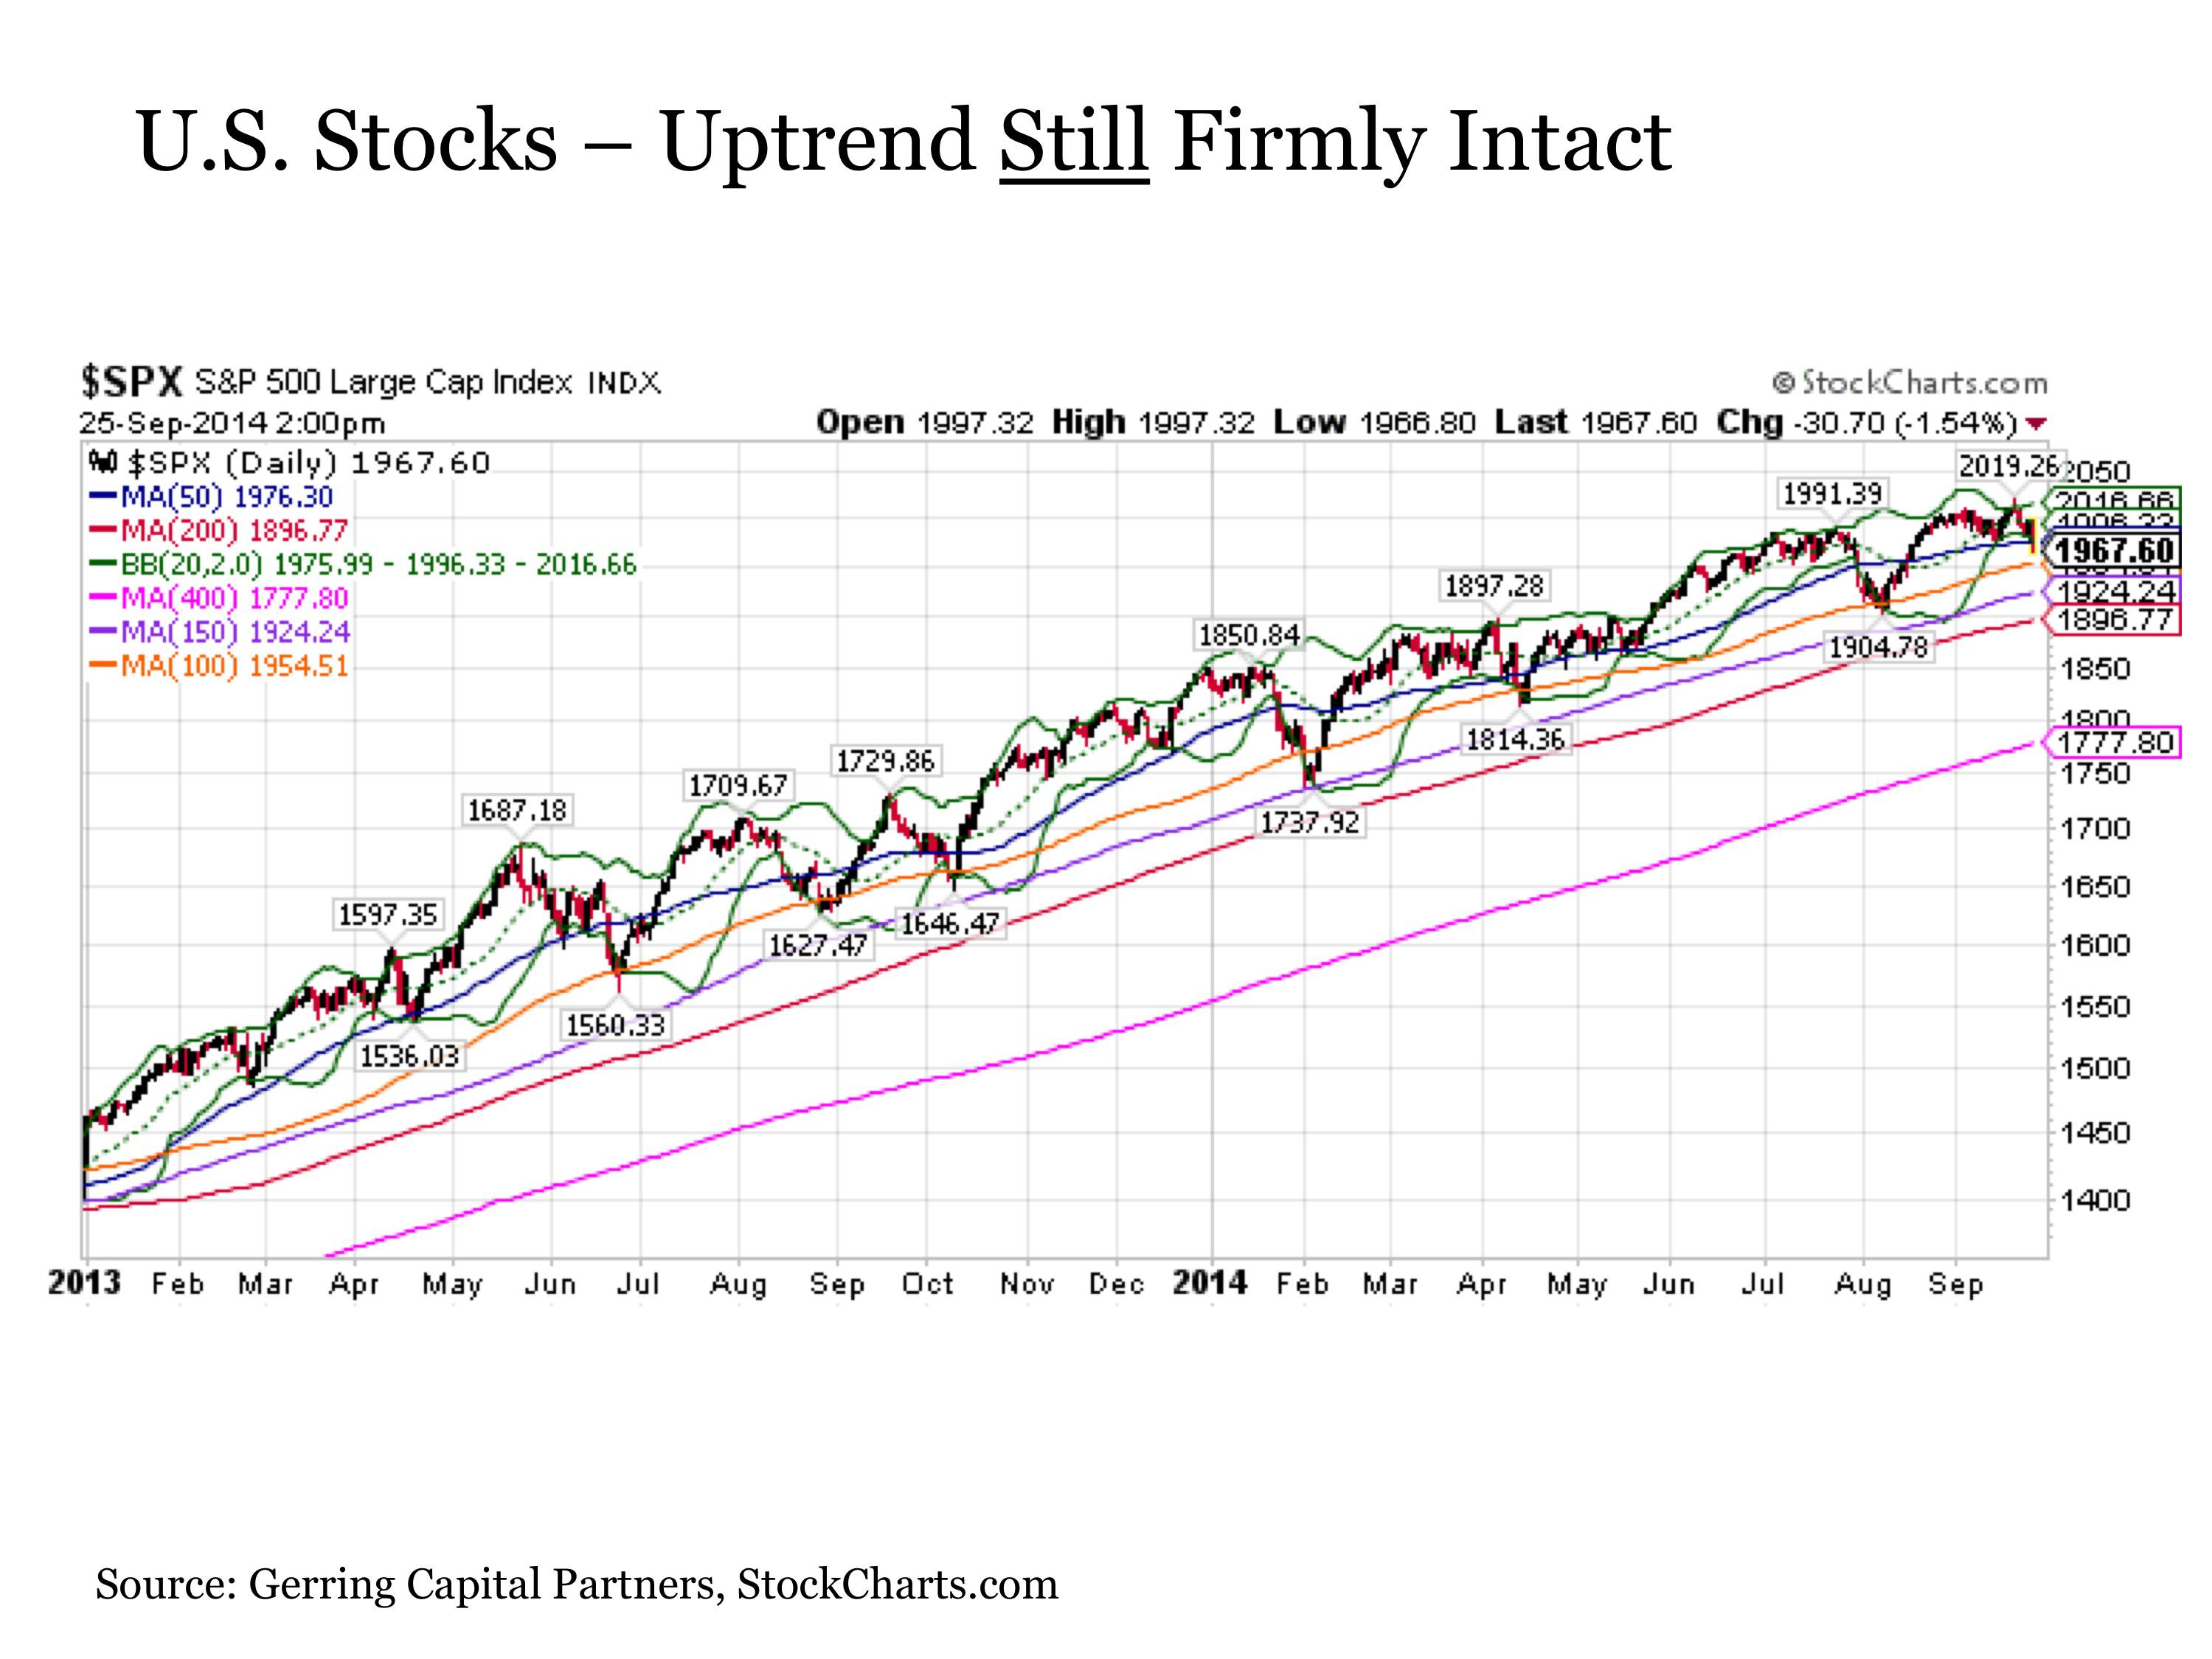
More broadly, it should also be mentioned that the uptrend in U.S. stocks, as measured by the S&P 500 Index, remains solidly intact. Despite breaching its 50-day moving average on Thursday, stocks continue to trade well above a variety of reliable support levels. This includes the 100-day moving average currently at 1954 that has provided support to the market on five separate occasions dating back to the beginning of 2013. It also includes the 150-day moving average currently at 1924 that served as key support for the market during the late January 2014 into early February sell-off. And it also includes the 200-day moving average down at 1897, which is still 5.40% below current levels and has not been breached since late 2012. In short, the S&P 500 is a stock market that remains in more than sturdy condition. And most anyone that trades on the short side of this market will confirm that positioning for anything other than the stock market going up is a treacherous proposition.
With all of this being said, this does not at all mean that U.S. stock investors have nothing to worry about. In fact, forces continue to accumulate on a variety of fronts that suggest the seemingly relentless U.S. stock market rally may soon be drawing to a close. And these reasons stretch well beyond the fundamental factors of generally sluggish corporate earnings growth and premium valuation that have hung over the market for some time.
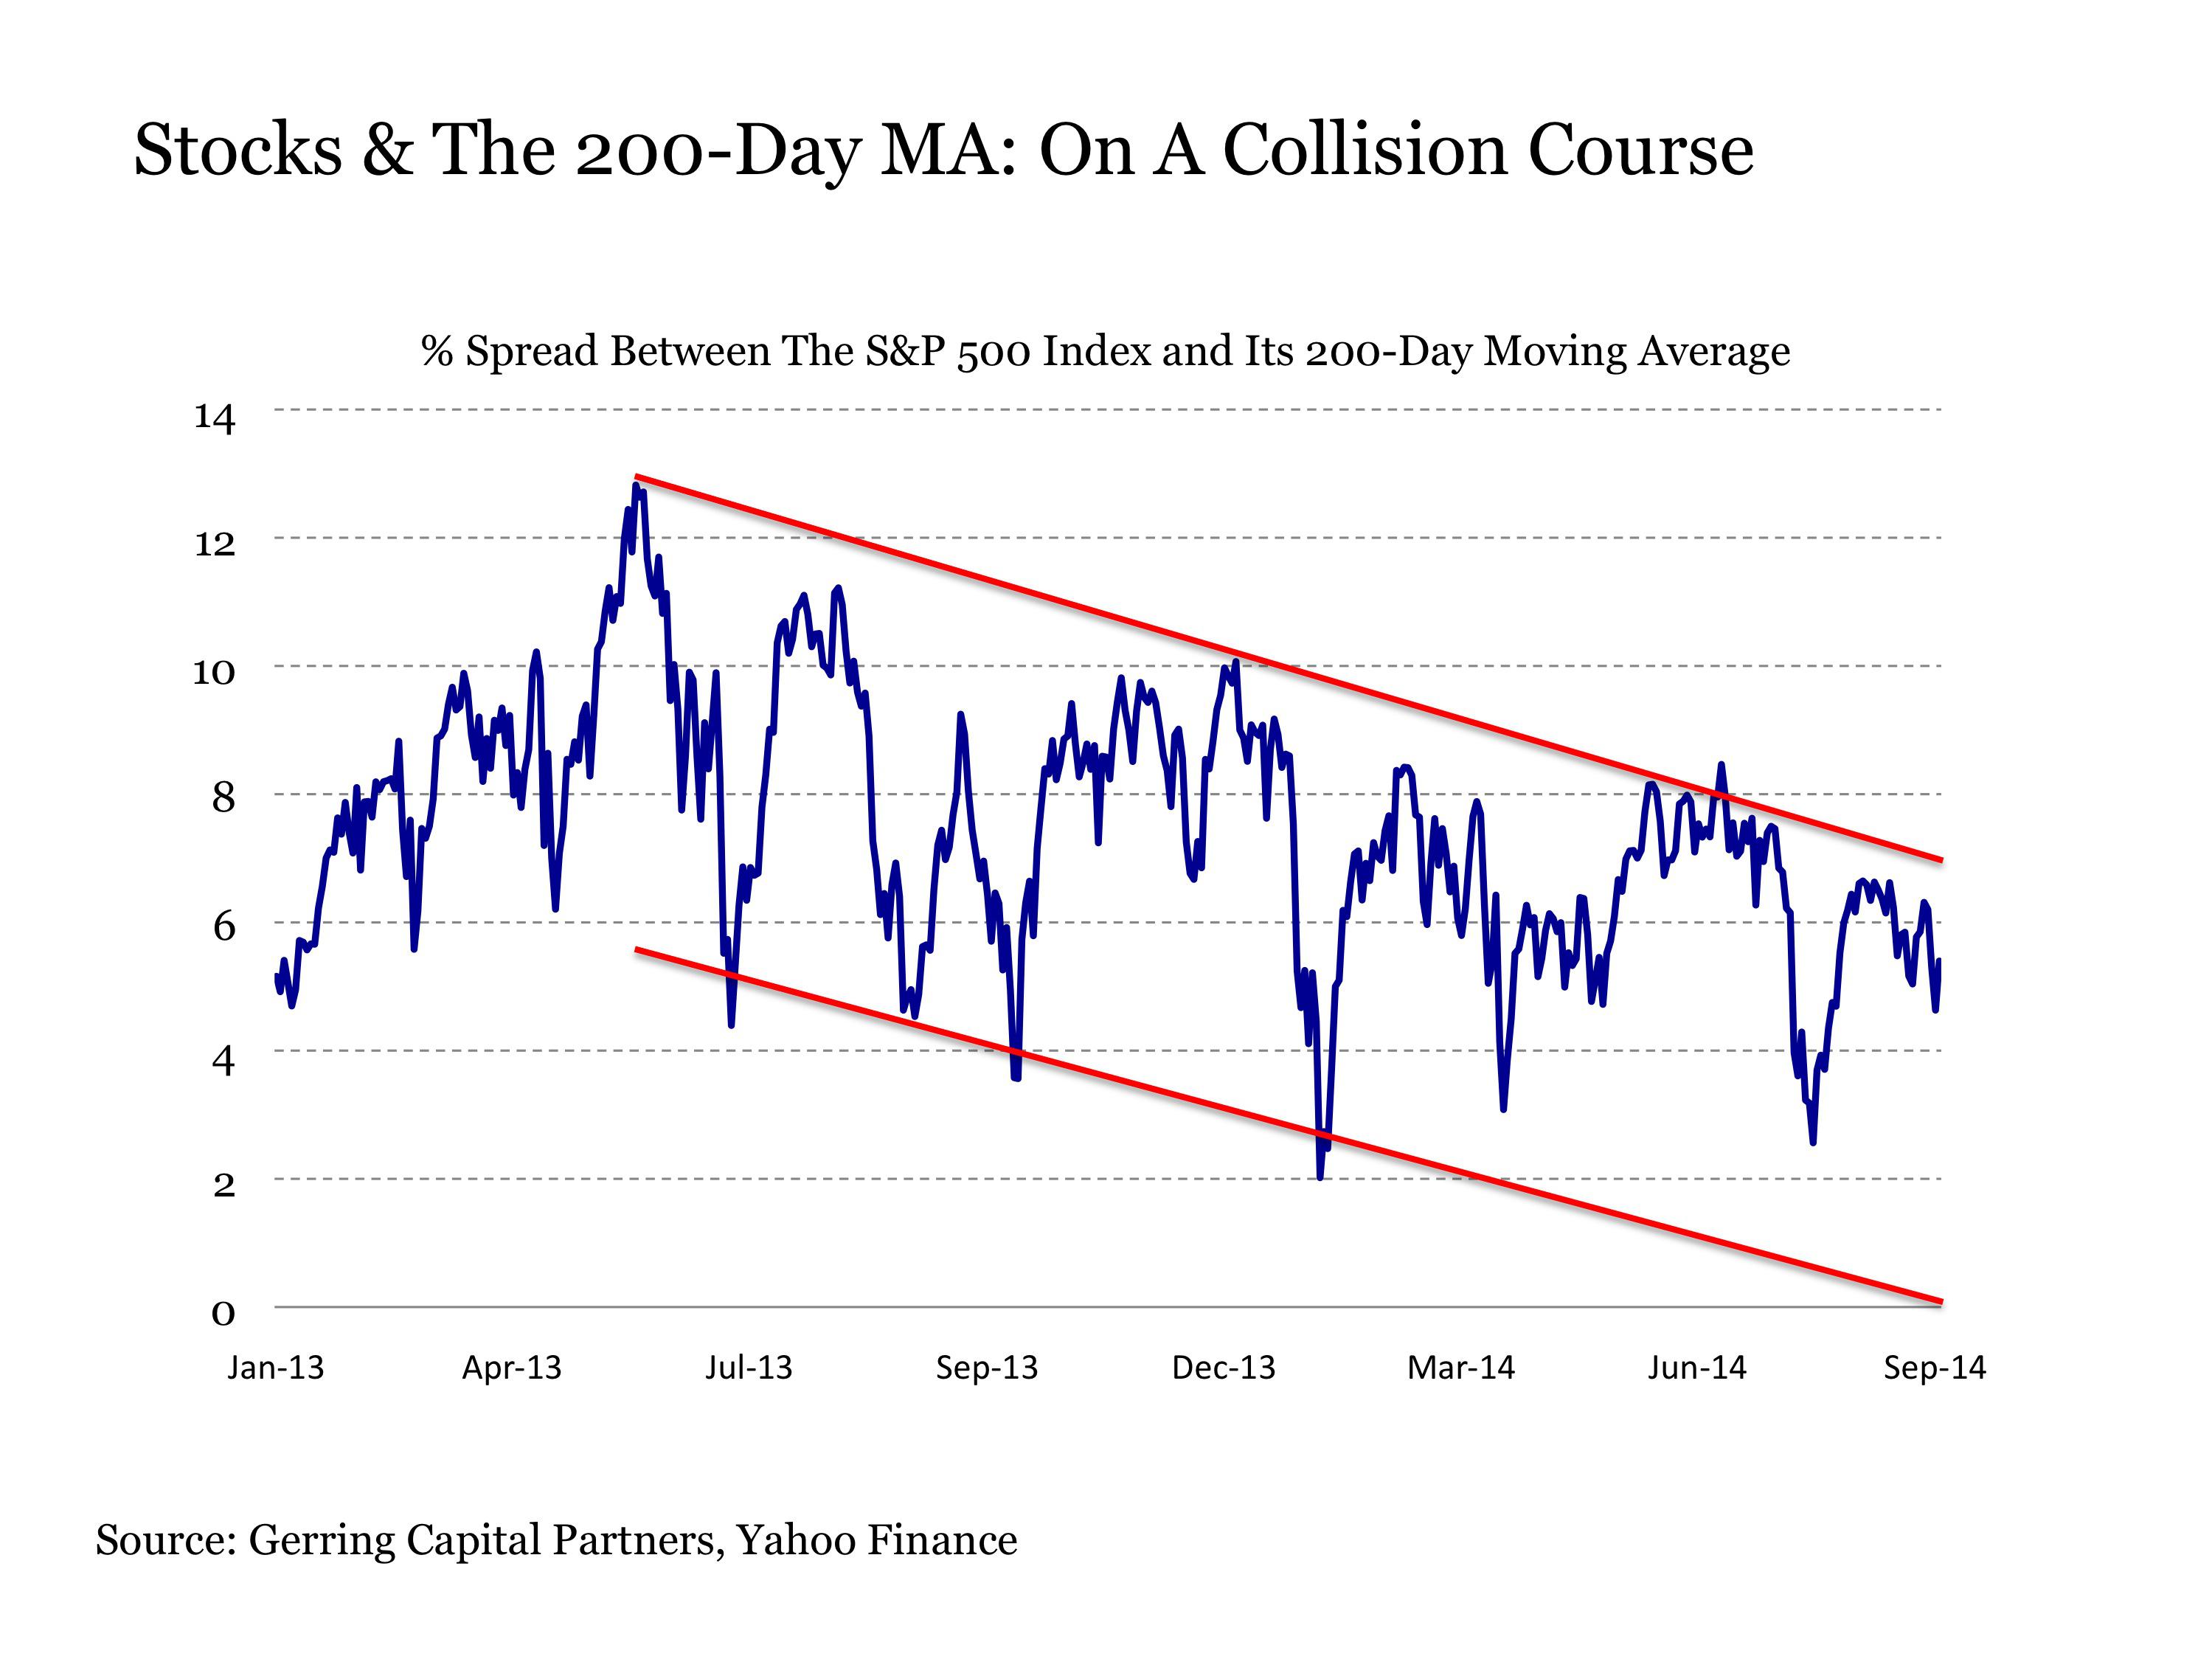
To begin with, the upward trajectory of the stock market continues to fade. For example, the S&P 500 Index has been able to achieve a steadily waning spread above its 200-day moving average with each successive rally in the daily Treasury purchase QE3 era that began at the start of 2013. And while this spread has not fallen below +2% throughout the entire period, the trend since mid-2013 suggests we may see a challenge to this key support level finally take place over the next few months.
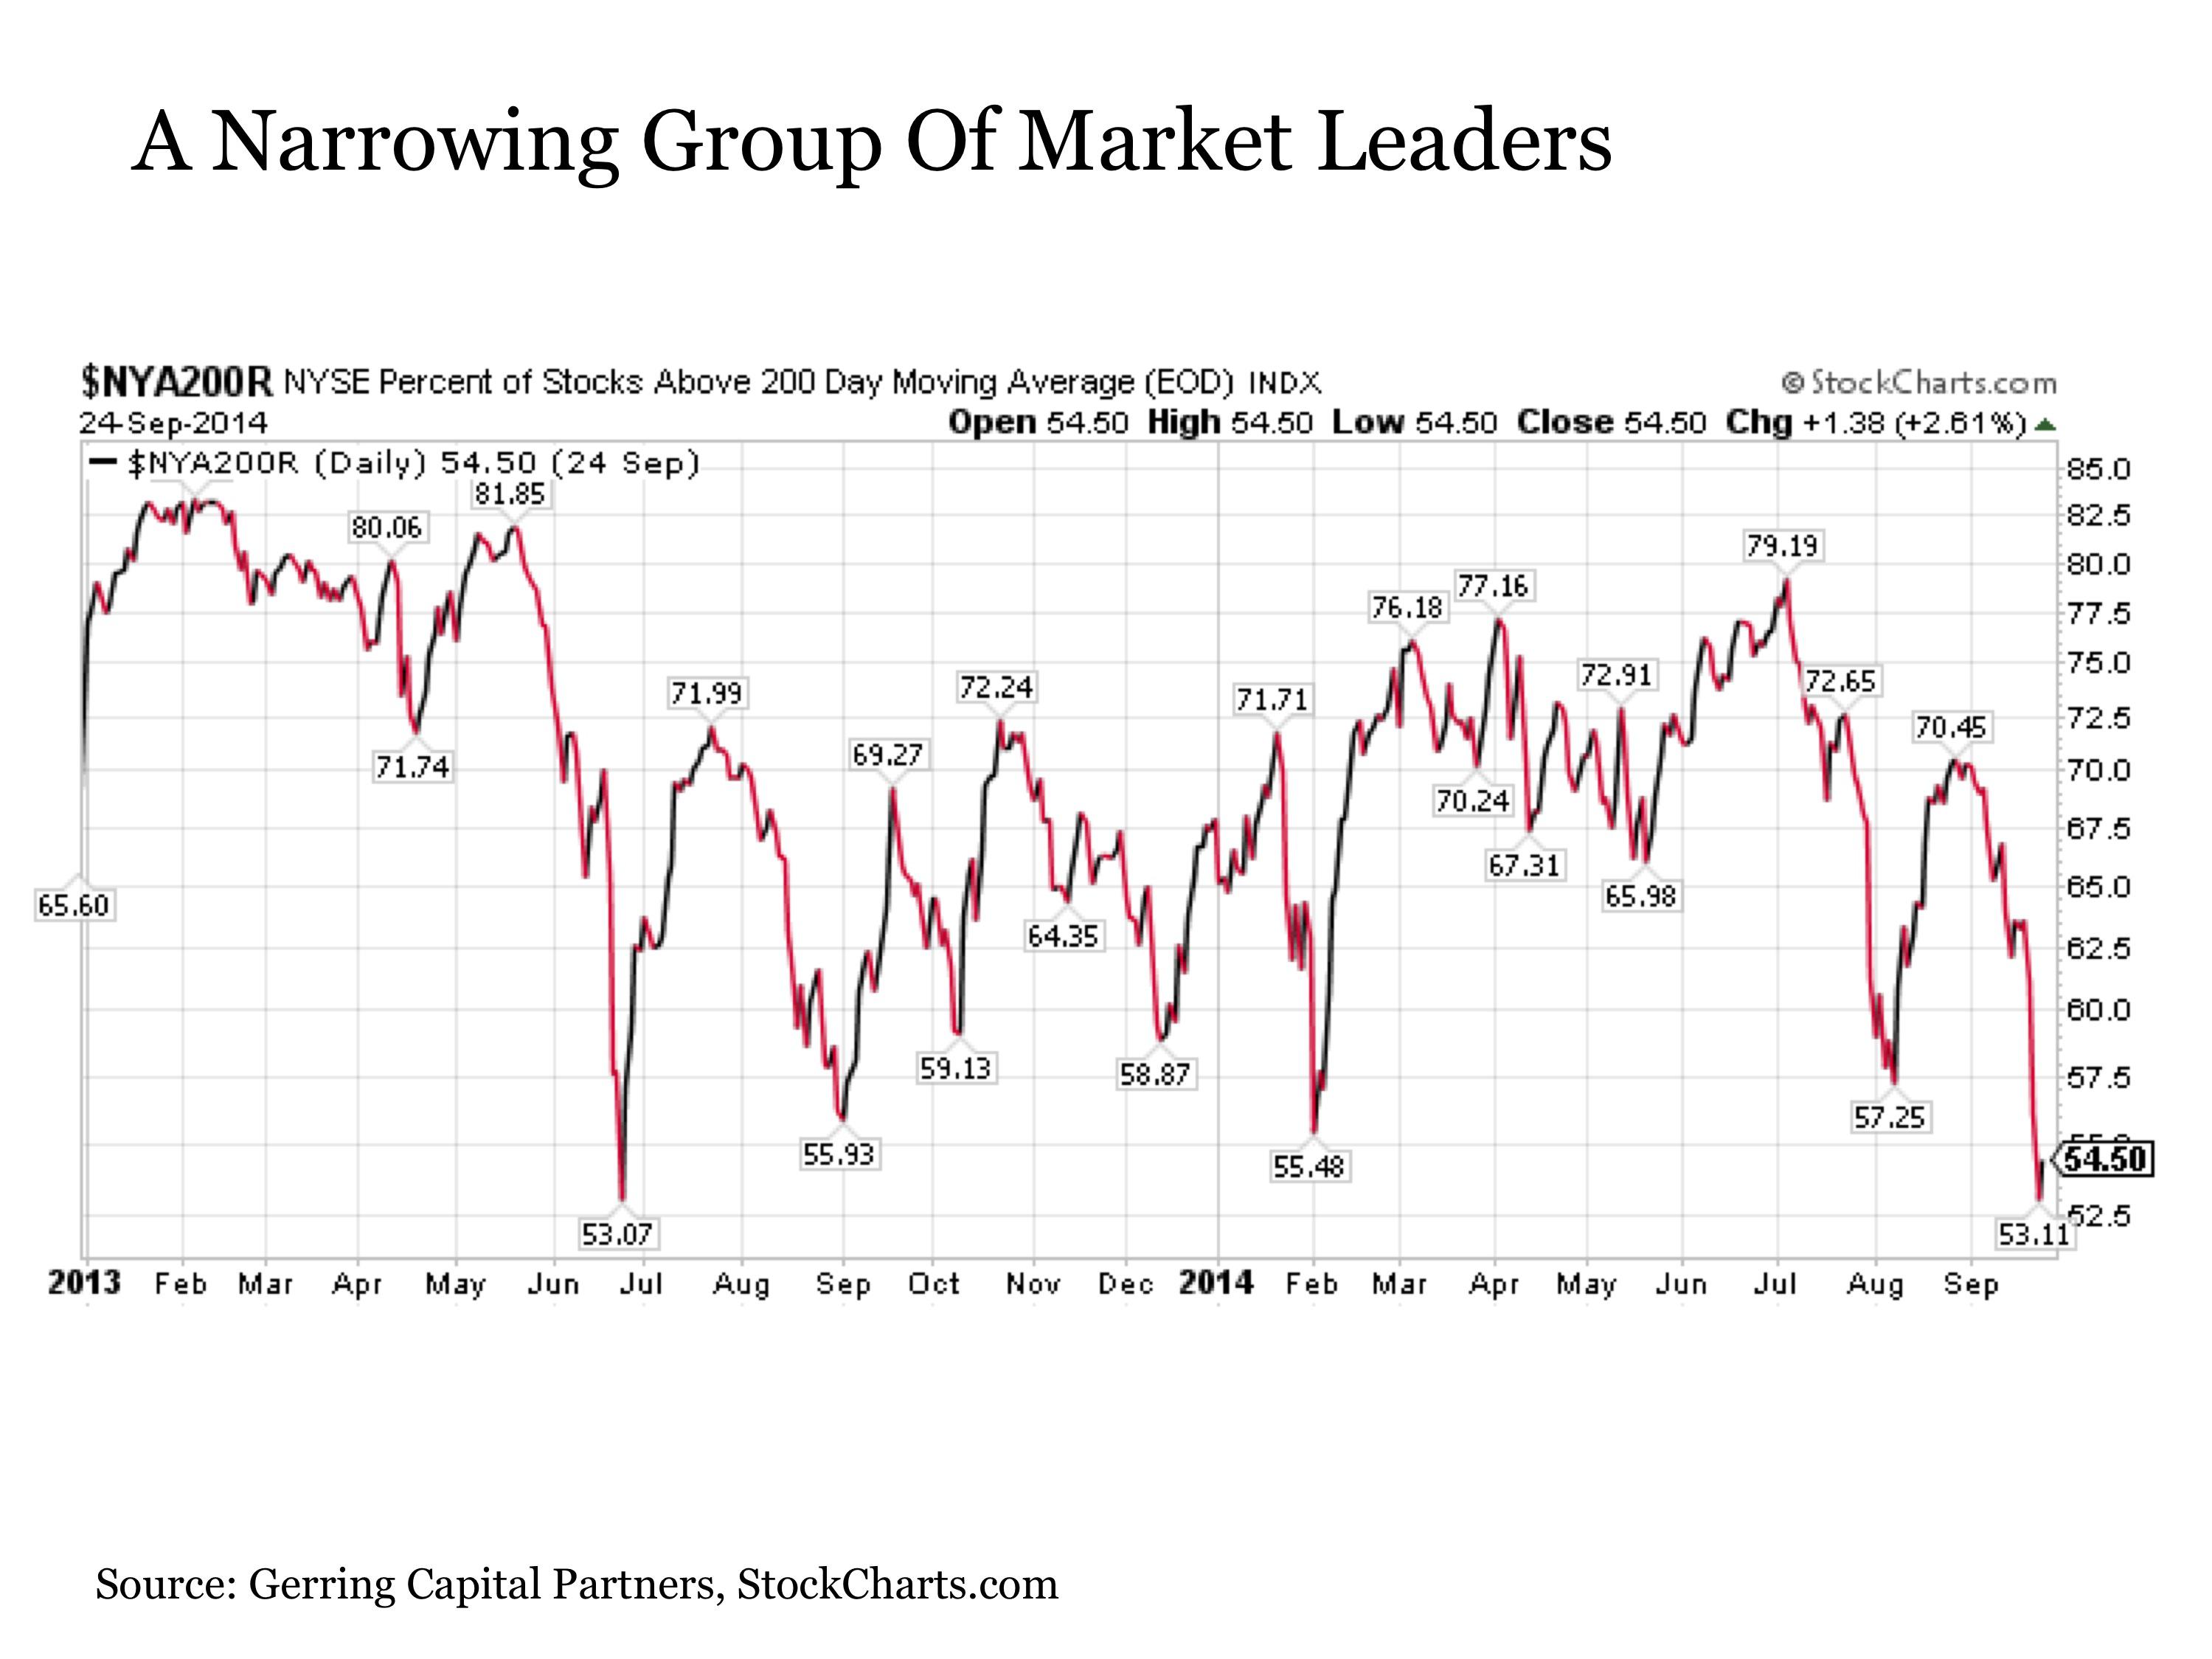
Digging under the surface on this point reveals more troubling news. Since the beginning of July, the number of stocks within the S&P 500 Index that are trading above their respective 200-day moving averages continues to fade. In fact, during the most recent market pullback, the number of stocks trading over their 200-day moving average has fallen to just over half, which represents the lowest levels seen since the 2013 rally began, and was only matched at the bottom of the sharp sell-off that took place in May and June of 2013. If nothing else, given that relatively fewer stocks are trading above their 200-day moving average at a time when the market is just off of its all-time highs suggests that an increasingly narrowing group of stocks is driving the rally at this stage, which does not bode well for the future sustainability of the uptrend.
It is upon looking outside of the U.S. stock market to other related asset classes where the reasons for concern continue to mount.
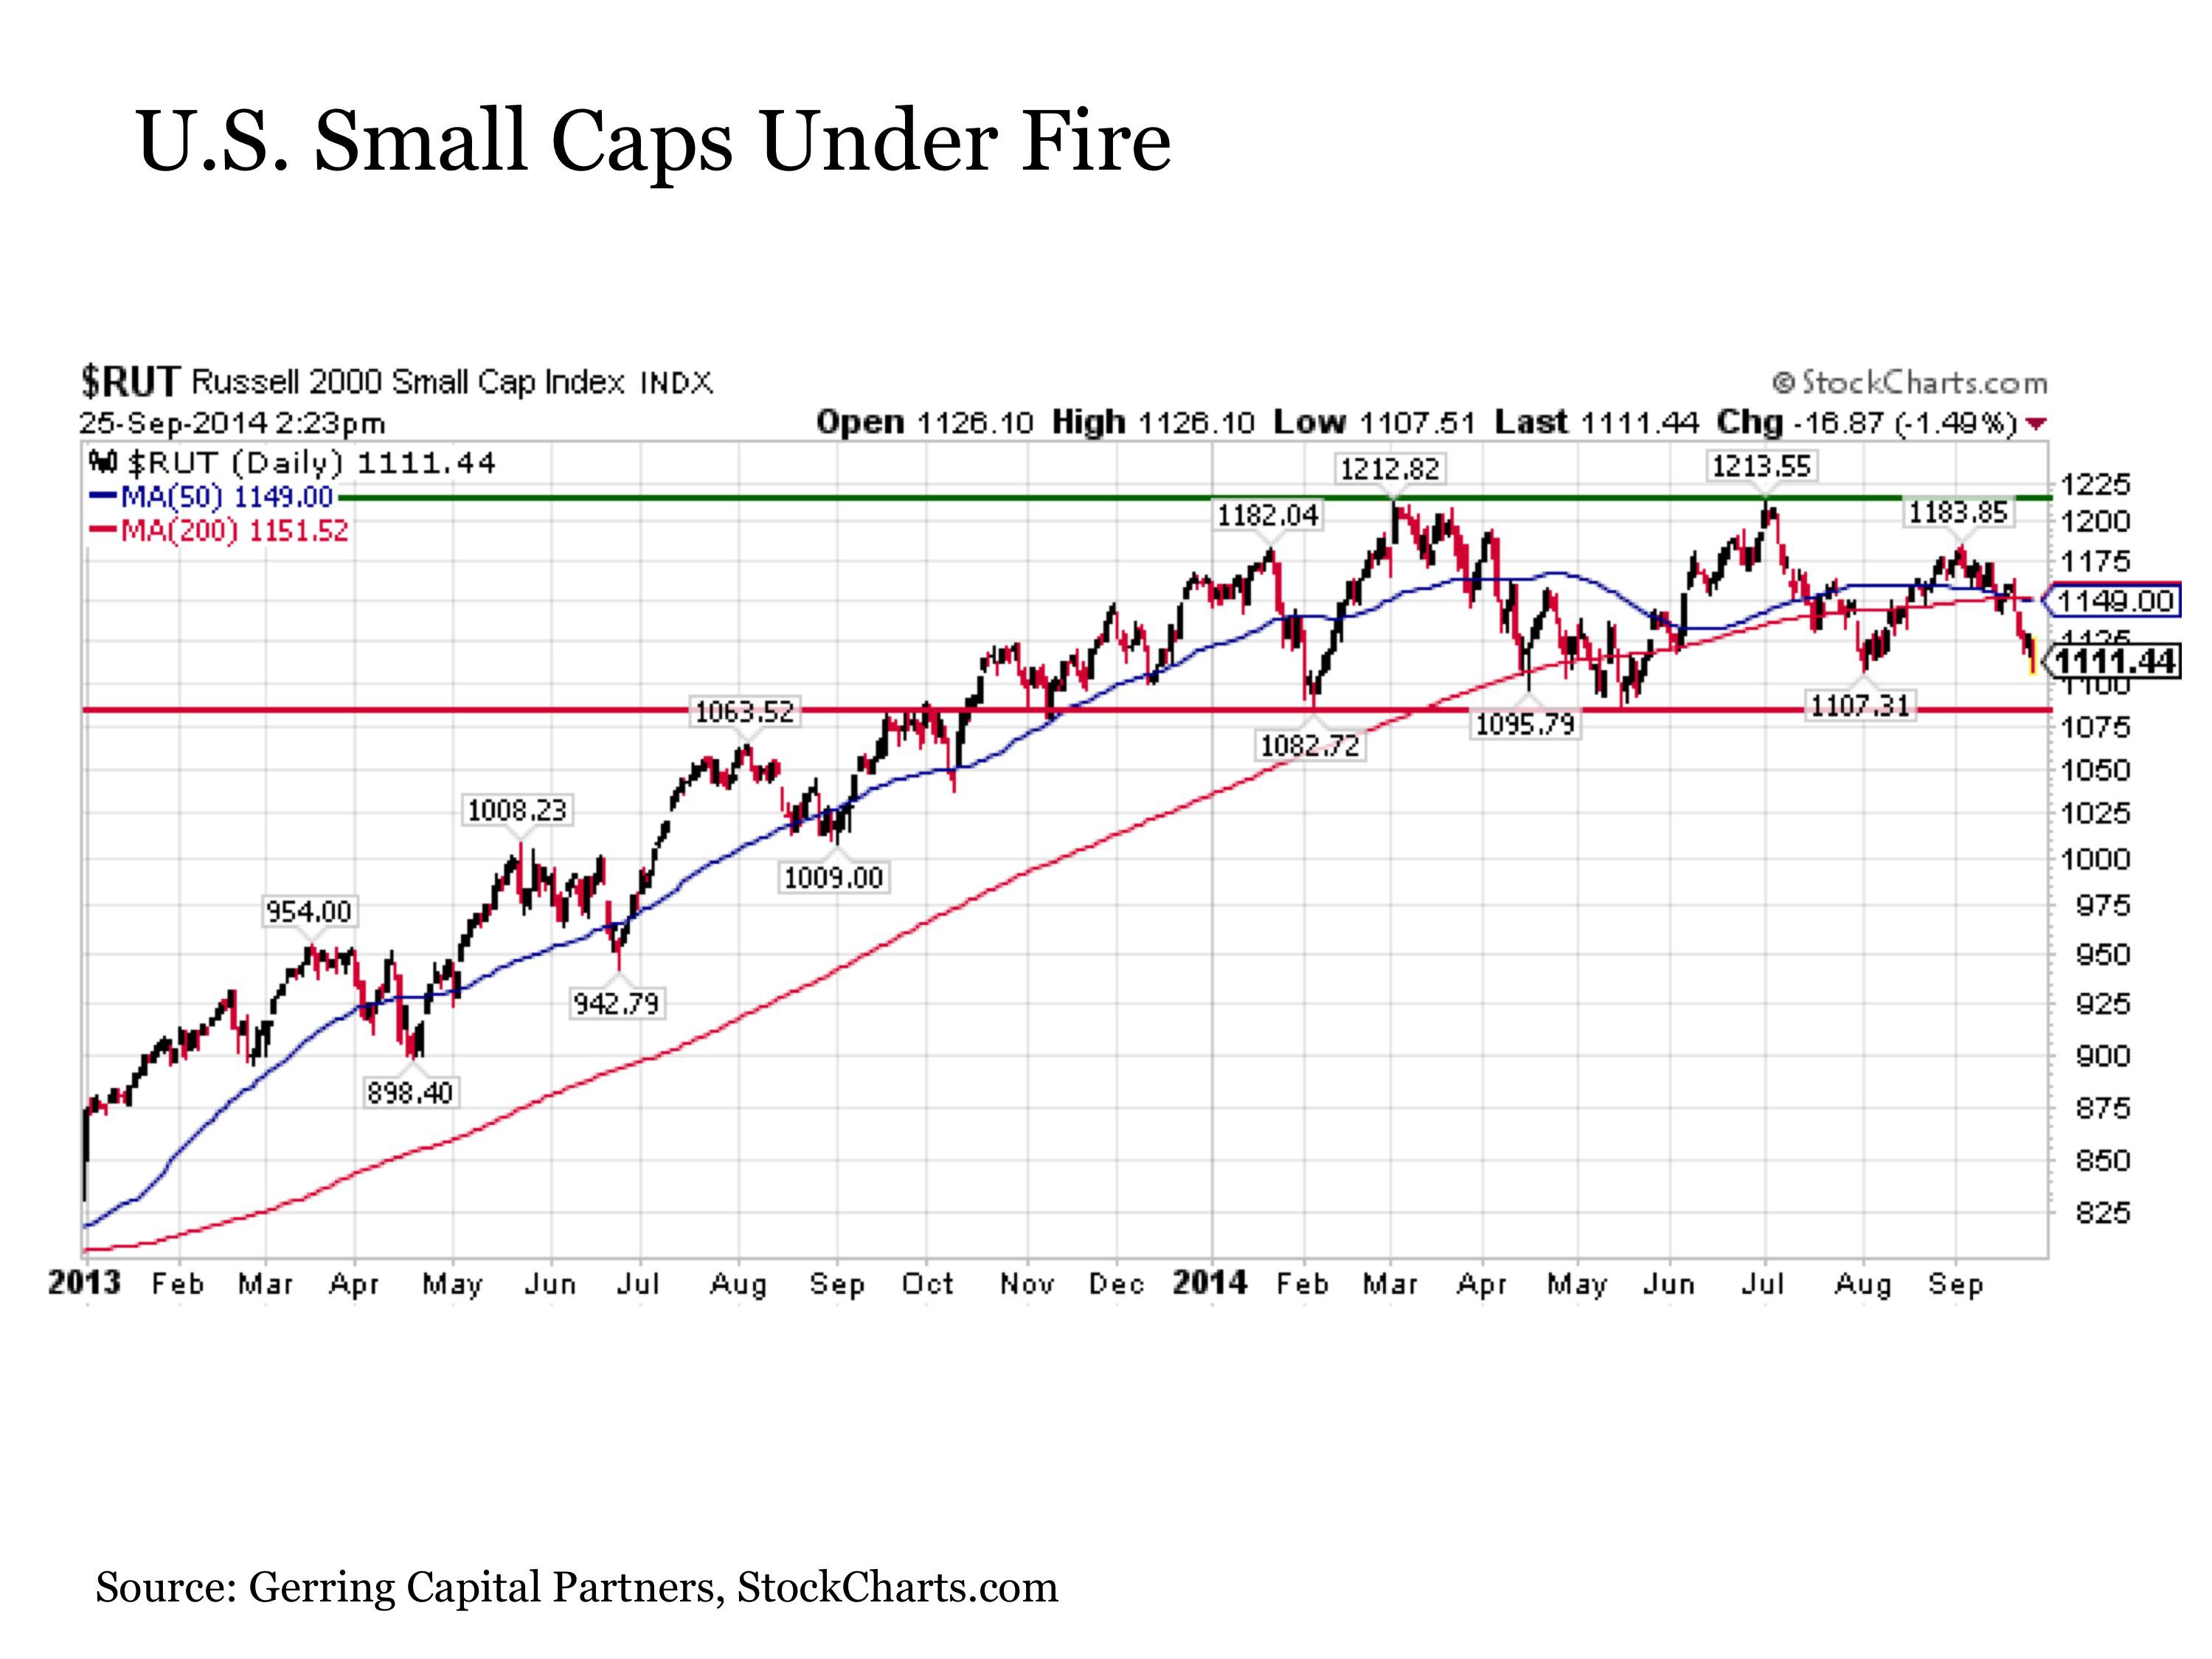
One sign of trouble remains well-documented. The U.S. small cap area of the market, as measured by the Russell 2000 (IWM), is struggling to keep its head above water at this point. While the S&P 500 is still up on a price basis by +6.5% thus far in 2014, the Russell 2000 is down by -4.5% year-to-date. The small cap index recently breached its 200-day moving average for the third time in the last six months. Such repeated breaks of the 200-day moving average often serve as early warning signals that a major reversal in trend may soon follow. With all of this in mind, key levels to monitor on the Russell 2000 in the coming weeks include 1095 on a closing basis and 1082 on an intraday basis. Any decisive breaks of these levels may confirm a double top and far more considerable downside to follow in the small cap space. And if small caps break, it should be anticipated that large caps may not be far behind in following to the downside.
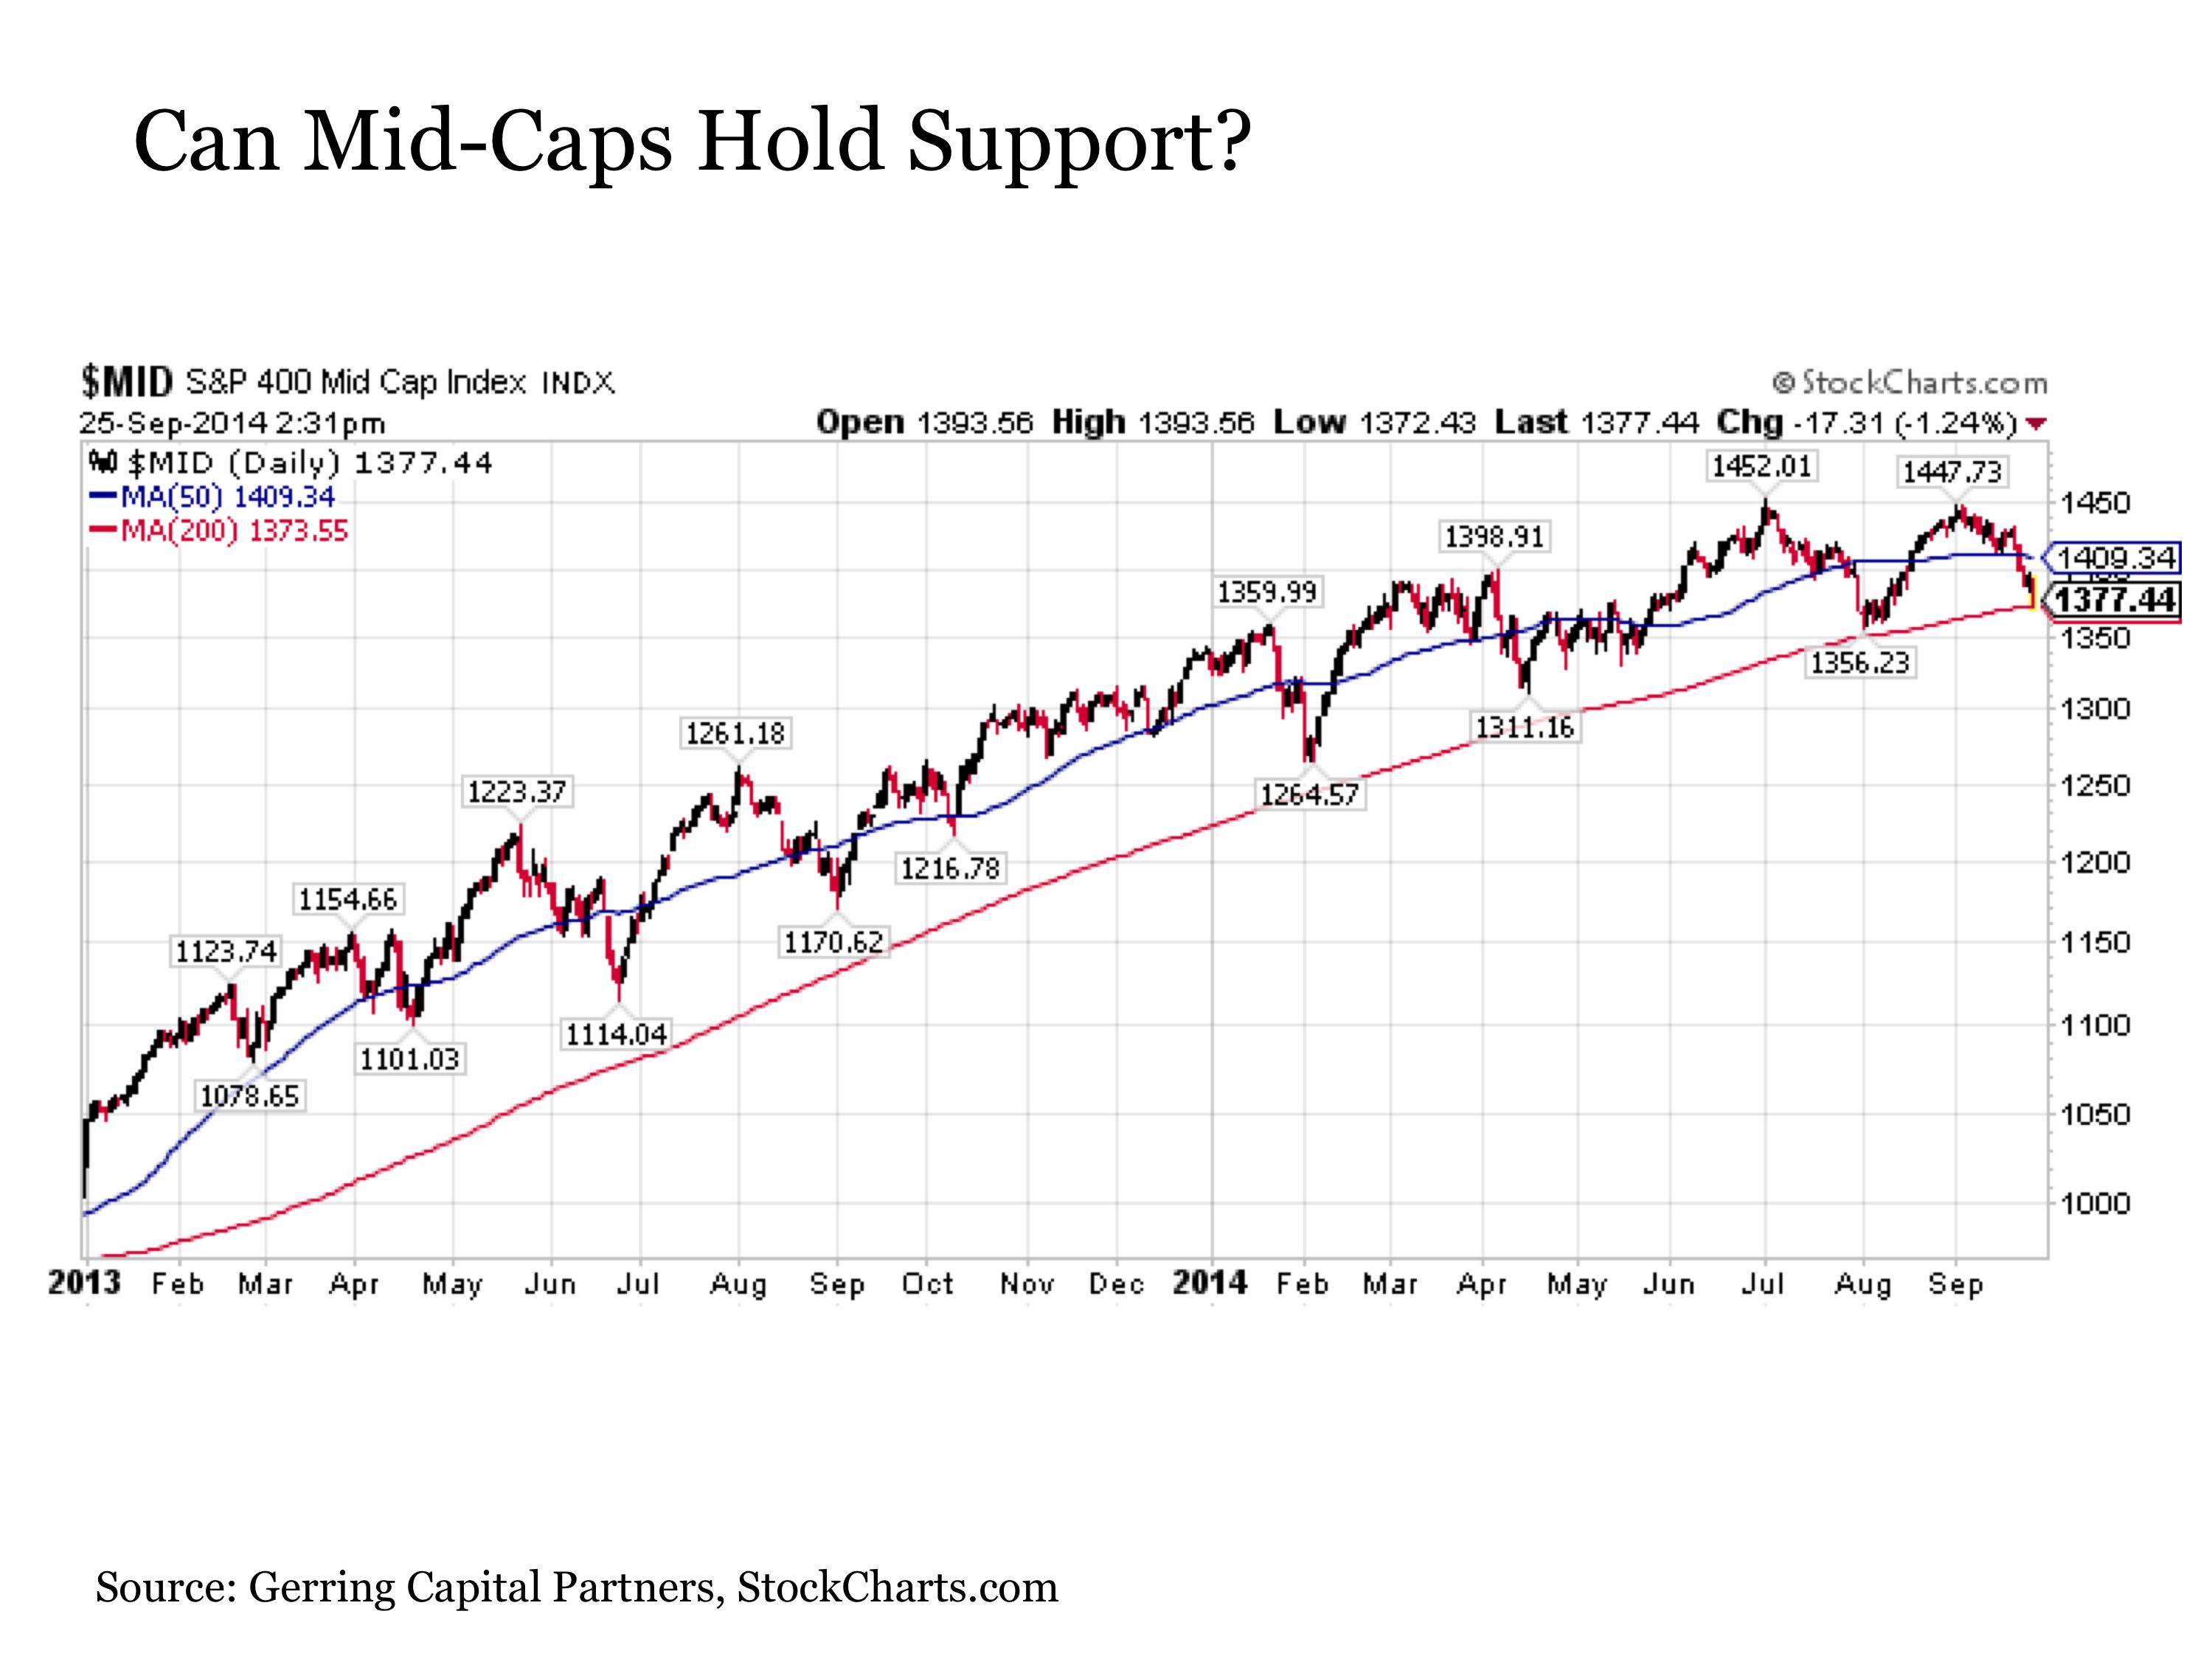
Highlighting how such downside can slowly creep up the size spectrum, it is worthwhile to take a glance at the S&P 400 Mid-Cap Index (IJH), which effectively resides in the space between the large cap S&P 500 and the small cap Russell 2000. While the uptrend remains intact here for mid caps, much like its large cap counterparts, it is worth noting that the S&P 400 Mid-Cap was not able to set new highs during the summer rally the same way that the S&P 500 did. Moreover, the mid cap index briefly broke below its 200-day moving average on Thursday for the first time since late 2012. Whether mid-caps find support to bounce at these levels or break further to the downside warrants attention in the coming days.
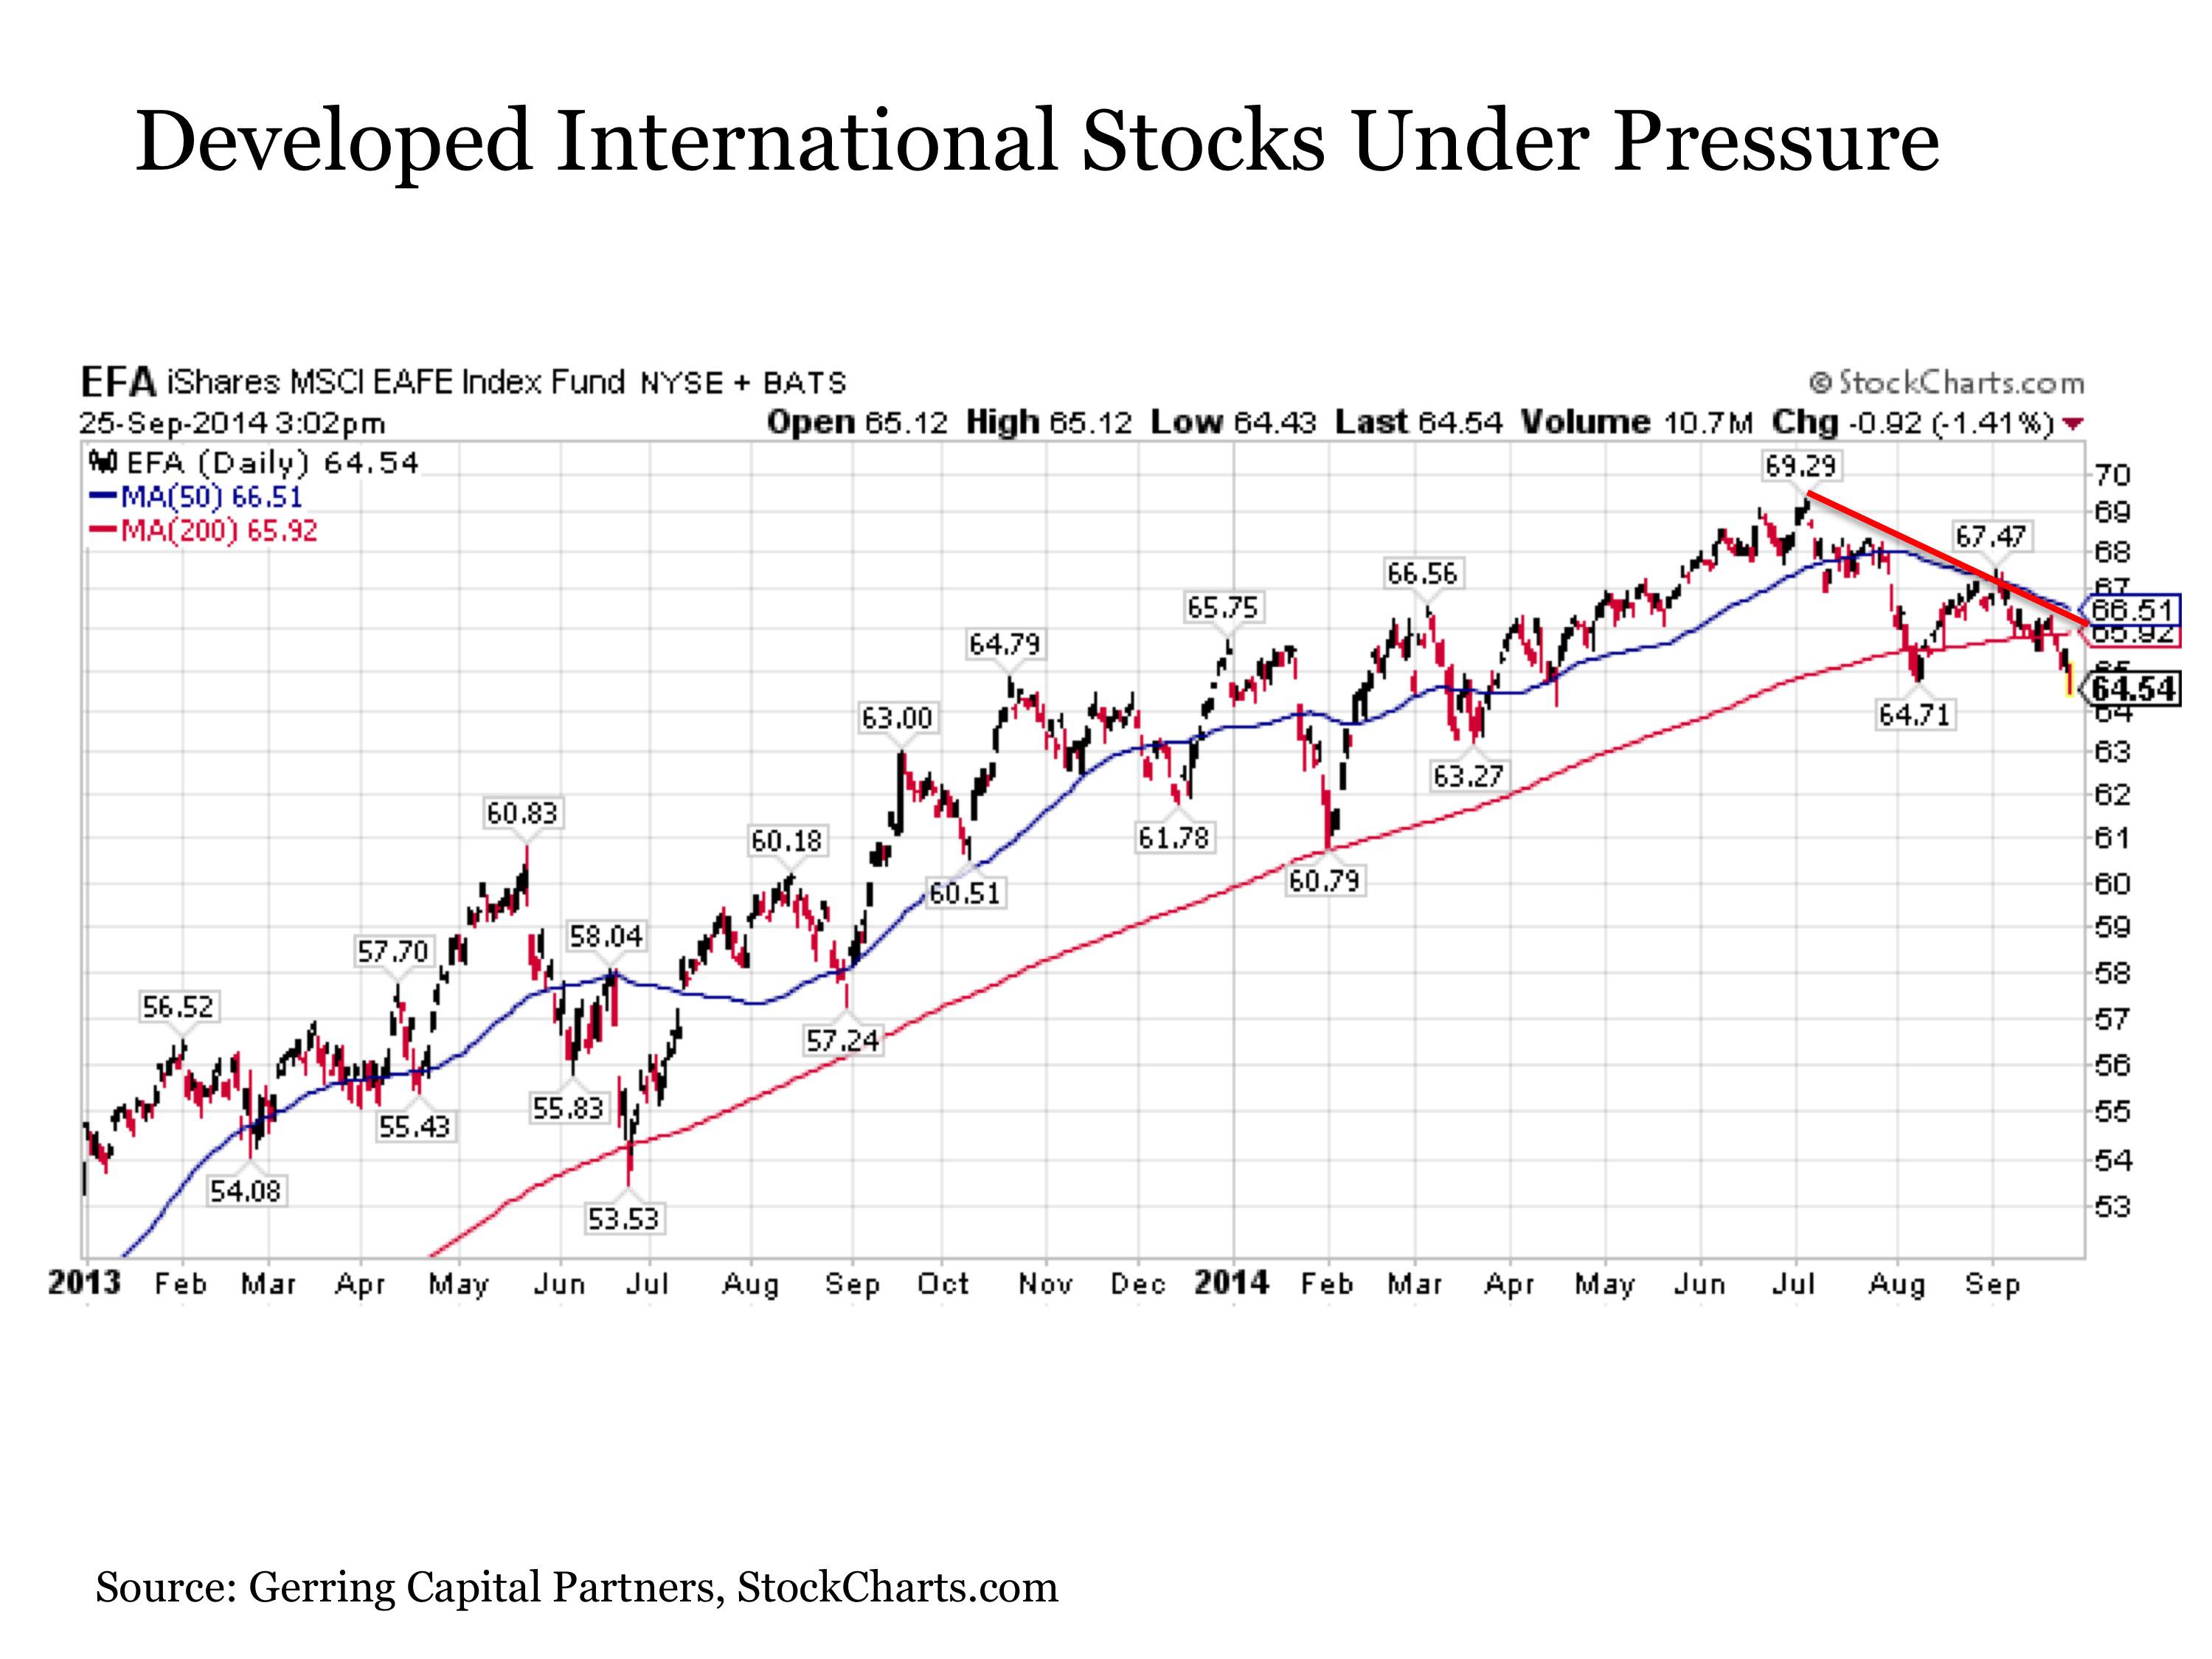
Looking outside of the U.S. reveals more troubling signs. Developed international stocks, as measured by the MSCI EAFE Index (EFA), have been stuck in a fairly sharply sloping downtrend since the beginning of July. Along the way, the index has broken its 200-day moving average twice now following the latest breach in recent days.
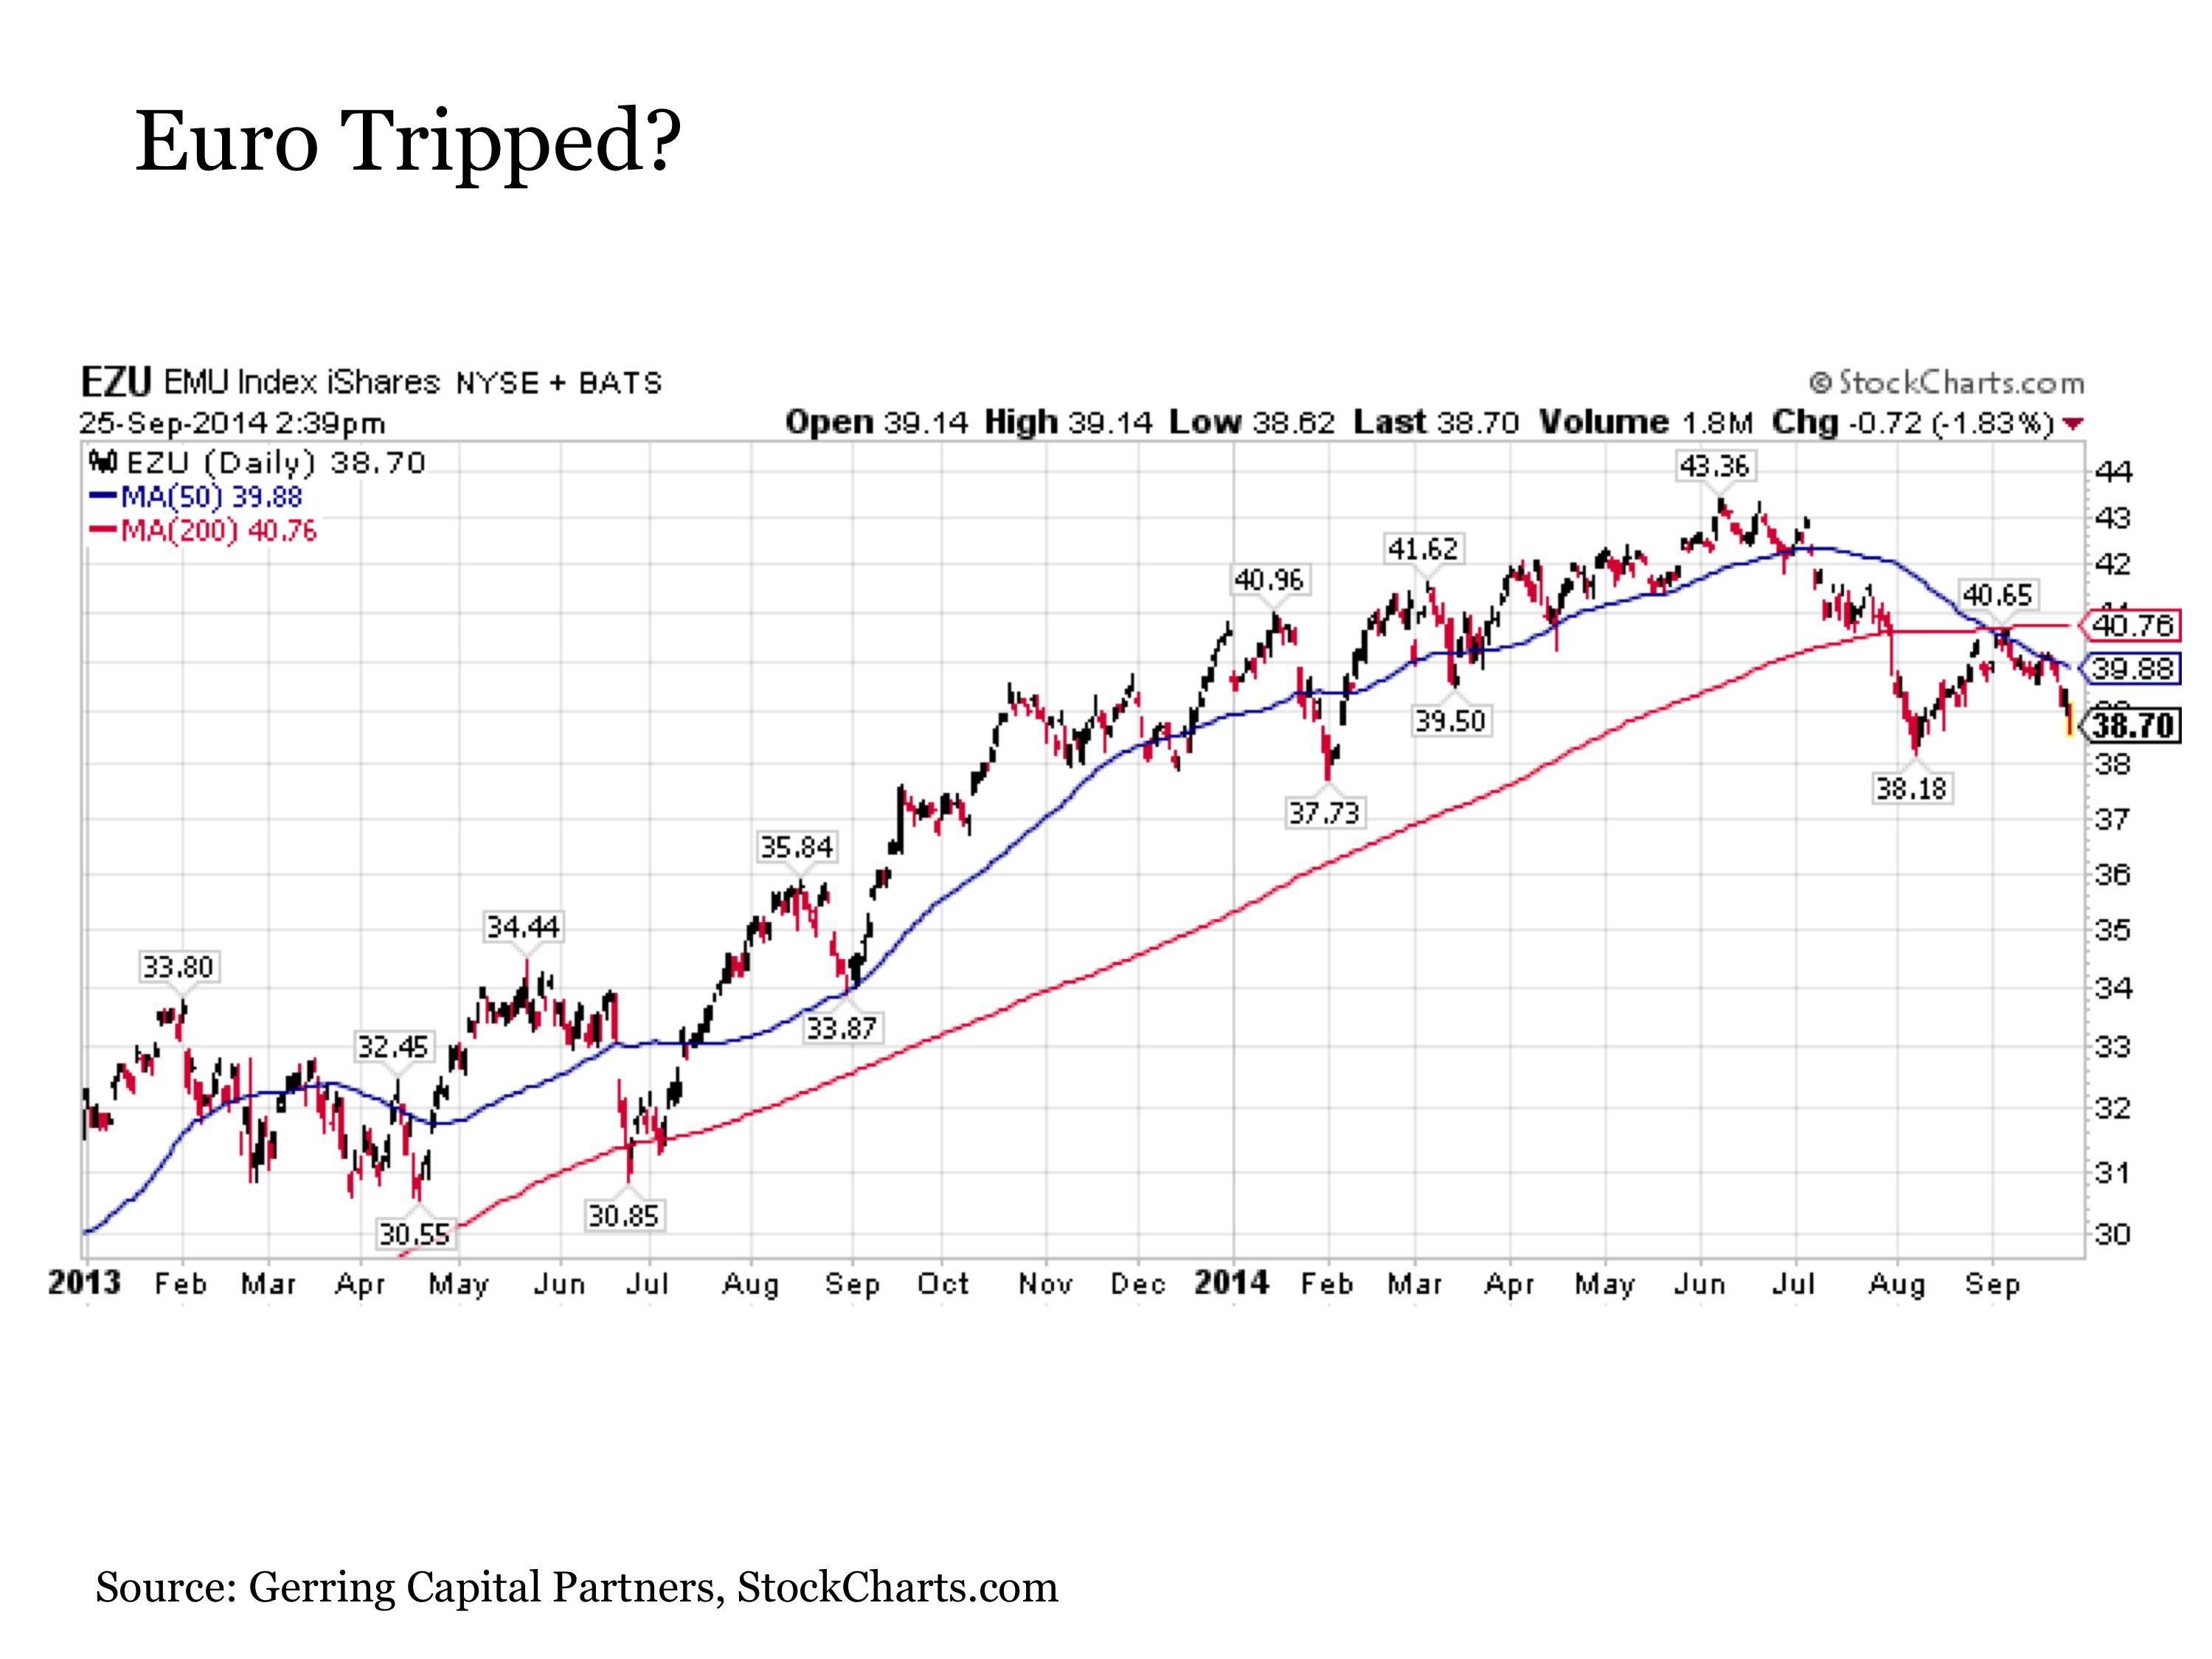
Dissecting developed international stocks reveals some key areas of concern. Leading among these are the stock markets that make up the eurozone. Not only have these markets, as measured by the EMU Index iShares (EZU), also been stuck in a sharp downtrend since early June and breached the key 200-day moving average support level in the process, they have since failed in trying to reclaim this key support level in early September. Moreover, the now downward sloping 50-day moving average has also been serving as heavy resistance through the month of September. Such price action only confirms the recent economic challenges that have been facing the region and that threaten to spread to other parts of the world.
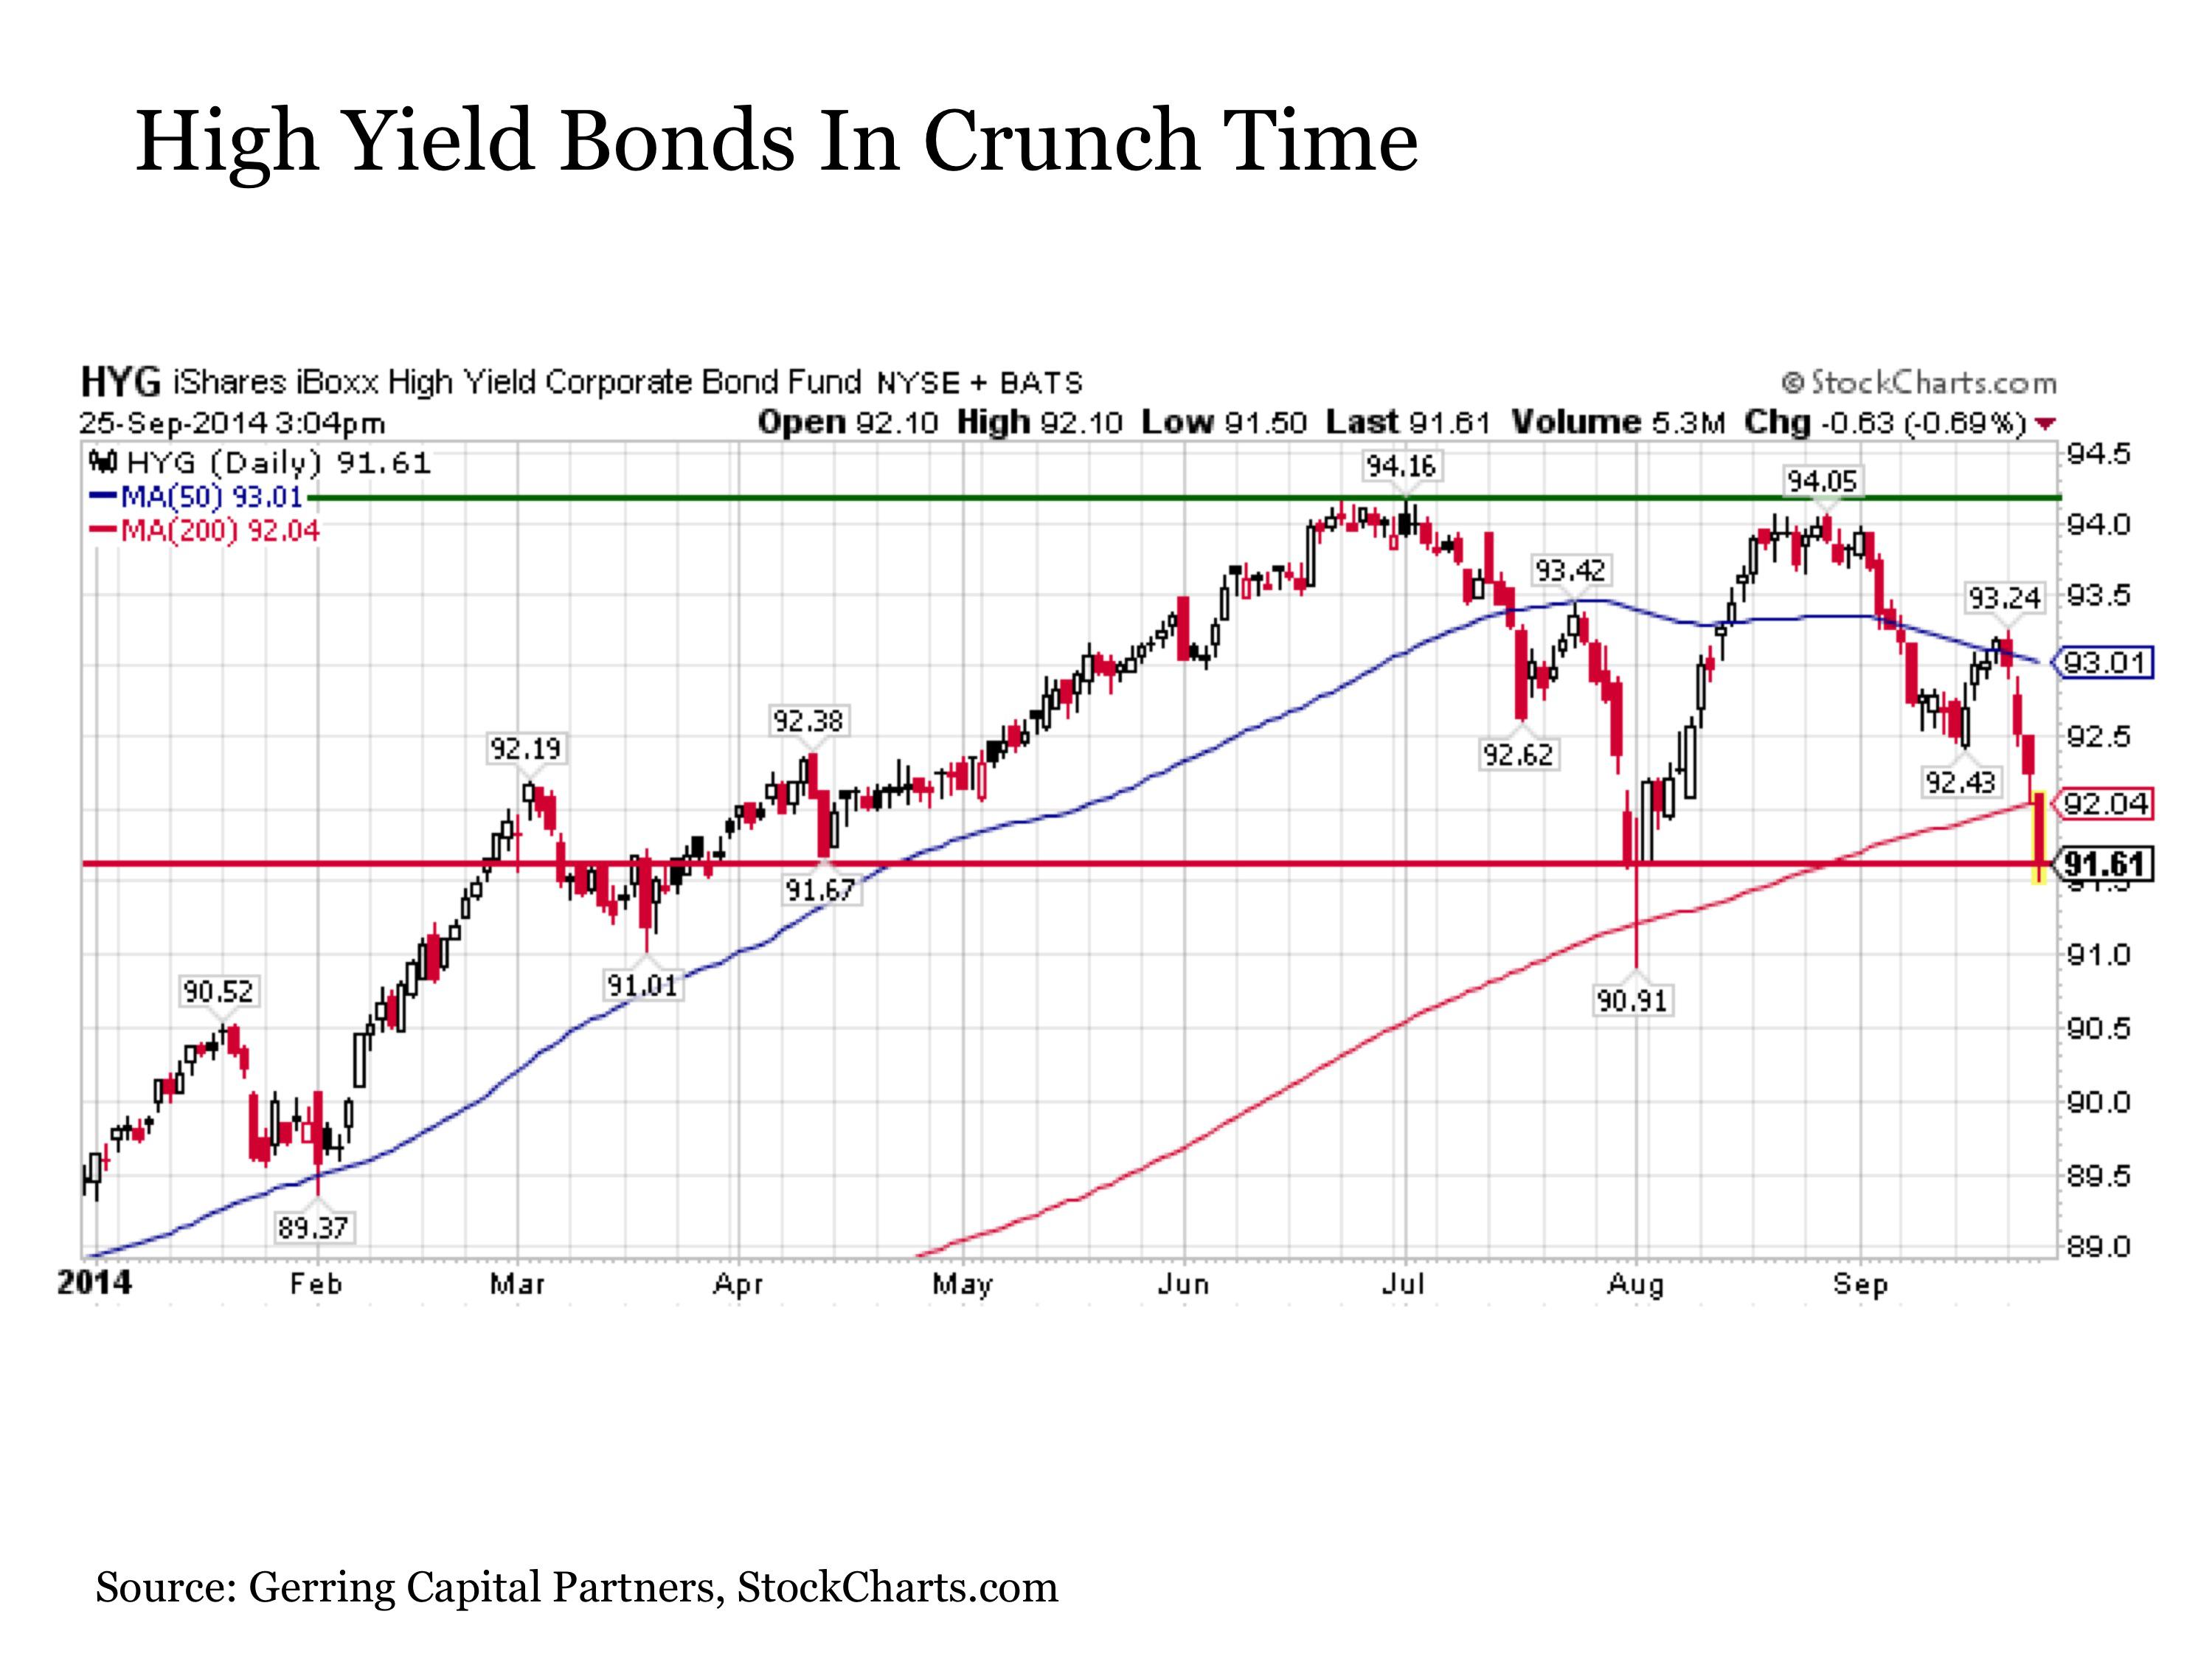
Moving beyond stocks, other asset classes that are highly correlated to U.S. stocks are also showing signs of mounting weakness. Among these is the high-yield bond (HYG) market, which, like U.S. small cap stocks, are threatening to set a double top if recent price trends continue much further. High-yield bonds peaked at the beginning of July, and after finding support at its 200-day moving average, were unable to breakout to new highs by the end of August. Since that time, high-yield bonds have recorded their second intraday breach of the 200-day moving average in the last two months. And a close on the iShares iBoxx High Yield Corporate Bond Fund decisively below 91.62 or on the SPDR Barclays High Yield Bond ETF (JNK) decisively below 40.09 would signal that the time has potentially come for a more sustained correction in high yield. And just like with U.S. small caps or developed international stocks, it will likely prove difficult for the S&P 500 to continue to march higher if so many other highly correlated categories have rolled over and are heading to the downside.
So while the sharp market decline on Thursday may at first seem relatively benign and not unlike several of the other sharp drops we have seen from the S&P 500 since the beginning of 2013, conditions are seemingly changing for the worse under the market surface. Perhaps the S&P 500 will end up being right once again, and the many other weakening indicators around it will be proven wrong. After all, the resilience of U.S. stocks in the face of so many challenges in recent years has been extraordinary. But with additional factors like the Fed bringing QE3 to an end and Fed Chair Janet Yellen firing vocal warning shots across the bow of the market, it may be reasonable to conclude that the days for this long standing bull market in the S&P 500 Index may now be numbered.
Disclosure: This article is for information purposes only. There are risks involved with investing including loss of principal. Gerring Capital Partners makes no explicit or implicit guarantee with respect to performance or the outcome of any investment or projections made. There is no guarantee that the goals of the strategies discussed by Gerring Capital Partners will be met.