Shares of Varian Medical Systems (VAR) are trading materially lower in after hours action, after the company posted revenues and earnings that missed consensus (and my own) estimates. Having recently gone long on shares, does the earnings miss suggest I made a mistake with my original investment thesis and that a significant reduction in fair value is in order?
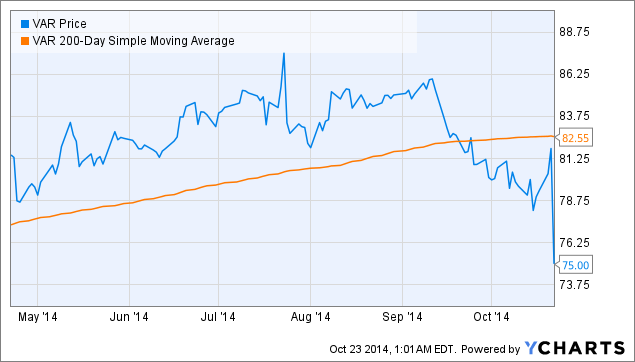
VAR data by YCharts
Operating Results:
Net orders for the fourth quarter came in at $1.12 billion, representing a 25% year-over-year increase from the same quarter last year. For the year, net orders of $3.35 billion were 13% higher year-over-year, above historical averages but well within the company's historical norms. Order backlog increased by 10.4% year-over-year, but consolidated revenues for the year increased only by 4%, well off historical norms, as revenue for the fourth quarter increased by only 5.6% year-over-year. Revenues were adversely affected by incomplete financing for the Maryland Proton Center (preventing Varian from booking revenues), which in 2012 had previously been expected to supply some $70 million in revenues to Varian, though the project remains under construction. Completion of the financing for the project would have contributed an additional $0.17 per share to the bottom line. Operating earnings and pre-tax earnings both fell, by 2% and 1%, respectively, as operating expenses as a percent of revenue came in 50 basis points higher (22.3% vs. 21.8%) for the quarter, and taxes on earnings came in substantially higher up 640 basis points (33.9% vs. 27.5%), though the tax rate for the year only rose about 100 basis points. The higher tax rate was influenced mainly by forex effects as well as the delay in the Maryland proton project. As a result of the confluence of the above factors, consolidated net margins came in materially lower for the year, down 270 basis points (13.2% vs. 14.9%).
Breaking down performance by segment, Oncology Systems continued to show strong top-line growth, growing revenues by 6% for the quarter, though only growing 4% for the year. Growth was most significant in North America for the year, with gross orders rising 7% for the year versus only 4% internationally. Despite the discrepancy, however, international growth came on strong in the fourth quarter with emerging market orders rising by more than 20 percent, and overall, order backlog improved by over 9% for the segment. Revenues for the more cyclical Imaging Components segment were a bit more disappointing, coming in less than 1% higher for the quarter and only 2.8% higher for the year. Flat panel orders came in lower based on a difficult comparison from a year ago, but future revenues for the segment should be aided by a $40 million order for security and inspection products. Revenues for the smallest and lumpiest "Other" segment, which includes Varian's particle therapy businesses, recorded a 30% increase in revenues year-over-year for the quarter, though this accounted for a mere $22 million.
Taking a look at the balance sheet, net current asset value by about 20%, from $950 million to $753 million, driven by a substantial decrease in cash. Book value, excluding goodwill, decreased about 8% to $1.38 billion from $1.49 billion, and total stockholder's equity was diminished by about 6% year-over-year.
Assessment and Outlook:
Overall, results for Varian were moderately lower than I had anticipated, though my view of this miss is tempered by the relatively temporary nature of some of the adverse factors. Varian is not building in any recognition of revenues from its backlog or pending proton projects waiting for completion of financing, and completion of those projects should provide substantial upside to revenues and earnings in FY 2015. That said, with operating cash flow missing my projection by about 10%, and with Varian's management notably going ahead with a staff restructuring and "enhanced retirement plan", some operational problems seem to be afoot, and I may need to temper my expectations for the company's margins and cash flow accordingly, until the company proves otherwise. For the upcoming fiscal year, Varian projects top-line growth of 5-6%, and EPS of $4.16-$4.26, materially lower than what I had previously projected.
Valuation:
After updating my discounted cash flow model and historical valuation model to account for these latest results, I am decreasing my fair value estimate for Varian shares to $88 from $93, with an uncertainty range of $80-$96. For my discounted cash flow model, I continue to project 8% revenue growth over the next 5 years, as the company continues to build out new linacs in emerging and international markets. I project 10-year average revenue growth of 5.3% per annum. I am decreasing my average net margin forecast by about 100 basis points, from 14.5% to 13.7%, as higher taxes and operational difficulties may offset Varian's continued pricing power. As there are only 2 significant players in the radiotherapy devices market, and as there really hasn't been a significant change in the qualities of linear accelerators or proton beam therapy per se (these are still capital intensive, complex pieces of machinery with a built-in recurring revenue base), I feel comfortable projecting these assumptions for a 10-year period. I continue to employ a weighted average cost of capital of 8.4% to discount cash flows. My discounted cash flow model yields a fair value estimate of $87 per diluted share. My historical valuation model now yields a fair value estimate of $92. Projected data are reproduced below.
| 2015 | 2016 | 2017 | 2018 | 2019 | 2020 | 2021 | 2022 | 2023 | 2024 | |
|---|---|---|---|---|---|---|---|---|---|---|
| Revenue | $3,334,524,223 | $3,596,465,534 | $3,877,683,902 | $4,126,993,049 | $4,392,185,488 | $4,613,044,317 | $4,844,684,066 | $5,087,659,773 | $5,343,184,869 | $5,611,474,561 |
| Cost of Revenue | $1,949,091,552 | $2,088,246,973 | $2,257,104,796 | $2,410,494,781 | $2,574,355,120 | $2,678,773,071 | $2,813,230,547 | $2,947,312,090 | $3,087,889,975 | $3,235,235,366 |
| Gross Profit | $1,385,432,671 | $1,508,218,561 | $1,620,579,106 | $1,716,498,268 | $1,817,830,368 | $1,934,271,246 | $2,031,453,519 | $2,140,347,683 | $2,255,294,894 | $2,376,239,195 |
| Operating Expenses | $743,455,072 | $796,751,761 | $861,019,569 | $919,501,702 | $981,879,727 | $1,021,918,487 | $1,070,715,048 | $1,121,781,533 | $1,175,347,616 | $1,234,397,886 |
| Operating Income | $641,977,600 | $711,466,799 | $759,559,537 | $796,996,566 | $835,950,641 | $912,352,758 | $960,738,470 | $1,018,566,150 | $1,079,947,278 | $1,141,841,310 |
| Taxes | $201,213,007 | $214,041,409 | $228,512,328 | $239,793,387 | $251,549,487 | $274,555,520 | $289,114,418 | $306,494,657 | $324,986,984 | $343,575,261 |
| Net Income | $440,764,593 | $497,425,391 | $531,047,209 | $557,203,180 | $584,401,154 | $637,797,239 | $671,624,052 | $712,071,492 | $754,960,294 | $798,266,049 |
| Depreciation & Amortization | $66,554,301 | $71,173,562 | $76,164,933 | $80,103,970 | $84,286,848 | $87,644,362 | $91,149,540 | $94,729,004 | $98,457,778 | $103,494,980 |
| Operating Cash Flow | $507,301,381 | $568,551,360 | $607,199,381 | $637,301,904 | $668,691,559 | $725,461,111 | $762,790,592 | $806,803,448 | $853,414,310 | $901,755,359 |
| Capital Expenditures | $93,897,323 | $99,966,262 | $108,739,574 | $118,330,187 | $128,751,479 | $134,403,553 | $139,028,298 | $143,890,163 | $148,833,575 | $156,266,660 |
| Free Cash Flow | $393,485,547 | $441,336,363 | $484,293,120 | $496,692,229 | $508,835,865 | $556,595,804 | $594,515,186 | $639,415,373 | $687,252,851 | $727,578,237 |
My fair value estimate implies a forward PE of 20.9 for 2015, inline with historical trends, and a forward EV/EBITDA ratio of 12.6, modestly higher than the current EV/EBITDA ratio of 11.6. With after hours action taking the stock down to $77 as of this writing, I continue to see the stock as trading at a considerable discount to fair value, and view shares as attractive, though potential upside is naturally more constrained than I had previously anticipated.
Conclusion:
| Free Cash Flow Yield | 4.3% | ||
|---|---|---|---|
| Calculated FCF Growth | 6.3% | ||
| FCF Total Return | 10.7% | ||
| Expected Earnings Growth | 6.95% | ||
| Dividend Yield | - | ||
| Anticipated EPS Total Return | 6.95% | ||
| Median ROIC/WACC | 3.5 | ||
| Morningstar Moat | Wide | ||
| Fair Value Estimates | DCF: $87 | Hx: $92 | $69 | Consensus: $92 |
| Estimated Fair Value | $88.00 | ||
| Margin of Safety | 12.5% | ||
Though I am mildly disappointed by Varian's performance this latest quarter and by their forecast for the coming year, I still view the company as best-in-breed and see no reason to change my long-term view of the company or its prospects. Cancer epidemiology is unlikely to radically change over the next decade, and radiotherapy utilization is unlikely to radically decline. Threats to capital expenditures for these expensive machines will continue to surface, and certainly increased taxation is a constant worry. That said, I see no reason to severely constrain my outlook for the company's earnings prospects given these secular trends, though I do think some "wait-and-see" attitude needs to be accounted for in my fair value estimate. Even so, shares trade at a material discount to my fair value estimate, and I would be happy to commit more money to the name if shares correct further.
Disclaimer: This article provides opinions and information, but does not contain recommendations or personal investment advice to any specific person for any particular purpose. The author is not a professional financial adviser. Do your own research or obtain suitable personal advice. You are responsible for your own investment decisions.