This is an excerpt from a post published recently: Bought: 50 EPOL at $24.45 and 50 AMNB at $22.07/Reality Creations Made by Politicians, Citizens and Investors and the Profound Negative Consequences Flowing Therefrom
My general approach when republishing a blog excerpt is to write a preface that is not found in the blog that describes what I am doing for those who are not regular blog readers.
I design my portfolio by assessing the Big Picture variables that drive asset correlations and asset allocations.
Inflation expectations built into the pricing of treasury inflation protected securities are extremely important. A persistent low inflation scenario, not too hot and not too cold, is necessary for both major asset categories. That point was seared into my brain when I started to invest in the late 1960s:
CPI Annual Increase Between 1966 to 1982:
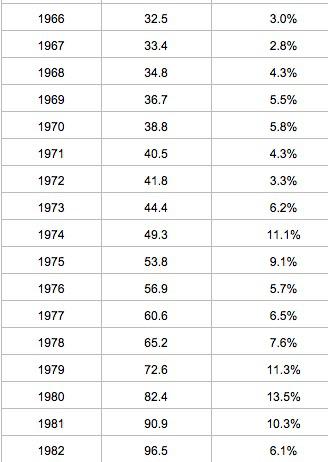
Consumer Price Index, 1913- | Federal Reserve Bank of Minneapolis
30 Year Fixed Rate Mortages Since 1971Freddie Mac:
Average Annual Rates:
1979: 11.2% with 1.6 points
1980: 13.74% with 1.8 points
1981: 16.83% with 3.1 points
1982: 16.04% with 2.2 points
Average Annualized Total Return for the S&P 500 (Dividends Reinvested), Adjusted for Inflation and Before Taxes (Dividends Taxed at highest marginal rate):
-1.813% between 1/1/1966 through July 31/1982
The total S&P return over a period of 6,056 days, or 16 years and 7 months was -26.055% adjusted for inflation (523,238,400 seconds or just a long time would do) You have to have been there and done that to appreciate how torture slows down time.
Sourced: S&P 500 Return Calculator
In that kind of long term scenario, I am going to be really cash heavy in FDIC insured instruments and short duration bonds using a ladder approach. There would likely be a few asset categories that will be working and those need to be identified and researched for investment opportunities.
Back in 1970s, my cash allocation was large, my bond allocation was nil, and I attempted to find anything that was working. The pickings were slim and based in large part on the companies benefiting from problematic inflation.
Energy stocks were generally in a bull mode after OPEC's 1973-1974 oil embargo.
The annualized return of the S&P Goldman Sachs Commodity Index in the 1970s was 21%.
Gold and silver bullion had a parabolic up move in the 1970s that popped in 1980 and again in 2011.
Historical Gold Price Chart | MacroTrends
So once the Big Picture problem is identified, which was not hard to do when problematic inflation was causing such havoc, other than possibly for those braid dead zombie creatures on TV, then adjustments have to be made to the asset allocations. The Importance of Identifying the Underlying Causes of Long Term Bull and Bear Markets (6/27/2011)
I noted in a recent comment here that I was classifying until 2012 the bull move off the March 9, 2009 lows as cyclical bull move within the confines of a long term secular bear market for several rational and fact based reasons. That is apparent when reading the last referenced post published in June 2011.
Then, I changed my mind after reviewing the relevant evidence with fresh eyes, washing out existing opinions from my brain, and concluded that a new long term secular bull market was, more likely than not (certainty is always illusive), the correct characterization.
That was a critical change in my asset allocation decision making. I am a fact based investor. I want to make the best decisions possible when managing my own and family members' money. I do not want to base decisions on impulses, emotion or reality creations.
I noted some of the important data that caused me to change my classification in a February 2013 SA comment and more recently in a comment to an article disparaging the importance of the following chart:
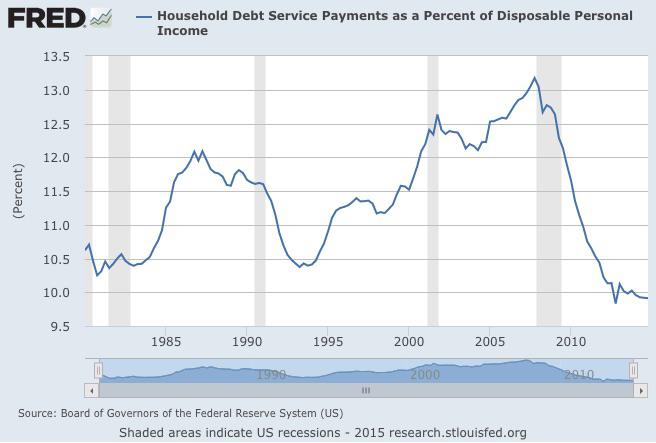
There are investors who believe the more disposable after debt service payments is not important or even a negative for the U.S. economy. Millions of households in a consumer led economy have more disposable income after debt service payments that they can spend without incurring more debt, save and/or pay down more expensive debt, due in large part to a refinancing tsunami at abnormally rates. It takes a great deal of reality creation to dismiss or even attempt to degrade the long term importance of this ratio.
One major stock market was in a bull mode during the 1970s that accelerated into a seven year parabola spike during the 1980s before collapsing upon itself, as dangerous parabolas will do:
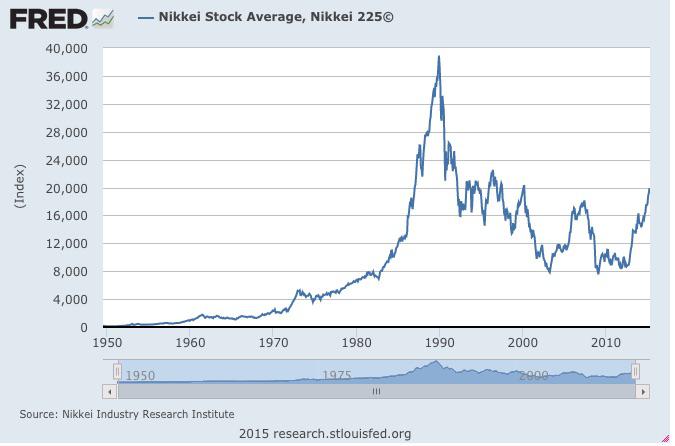
This chart clearly reflects one of the longest and most powerful dangerous parabolic spikes in modern financial history.
I believe that I jumped ship in 1985, too soon given what ultimately happened, but nonetheless a rational and informed call. My ownership then was only a Japanese stock CEF, the only one then in existence as I recall, that was then managed by Scudder (fund later open ended into a mutual fund) In 2010, the Nikkei was about 50% below where it was in 1985.
In case anyone was buying stocks at over 100 times pretend earnings in 1999, market price does not necessarily mean a rational one but has frequently only meant an insane one for as long as that so called "Rational Man" has been living on this planet.
Efficient Market Hypothesis as Hokum 3/29/2010 Post
Introduction Section: Acquiring Relevant Information (9/8/11 Post)
In the following discussion, I will be discussing one small component of my current investment strategy. The purchase of foreign country ETFs priced in USDs that meet several criteria:
1. The foreign currency has declined by at least 20% against the USD.
2. The foreign stock index has a Shiller P/E of 12 or less.
3. The dividend yield of the ETF is greater than 3% at the current price.
4. I prefer to see a low Price to Book, Price to Sales, and/or earnings declines in major index components that may be temporary (e.g. energy producers) and consequently they may be potential catalysts for an earnings reversal causing a rise in the ordinary shares priced in the foreign currency.
When looking at this ETF, I am relying on original source providers, rather than an impulse that just popped into my head, and gave this purchase some Left Brain attention and a clearly defined rationale for its purchase before making a miniscule purchase.
Too many investors allow the Right Brain to make investment decisions with the Left Brain left out in the cold to freeze to death. Investing is a serious business and needs to be treated as such.
Right Brain and Left Brain Inventory
1. Bought 50 EPOL at $24.45 (see Disclaimer):
Snapshot of Trade:
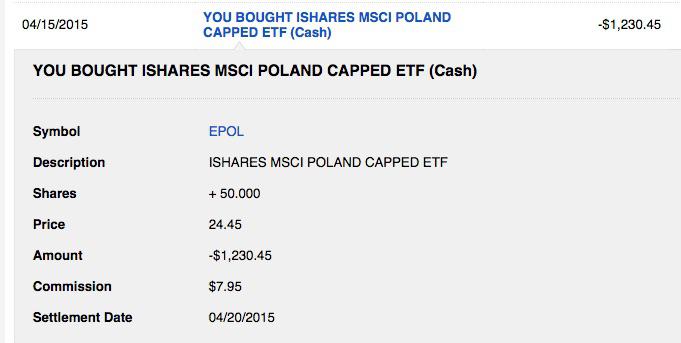
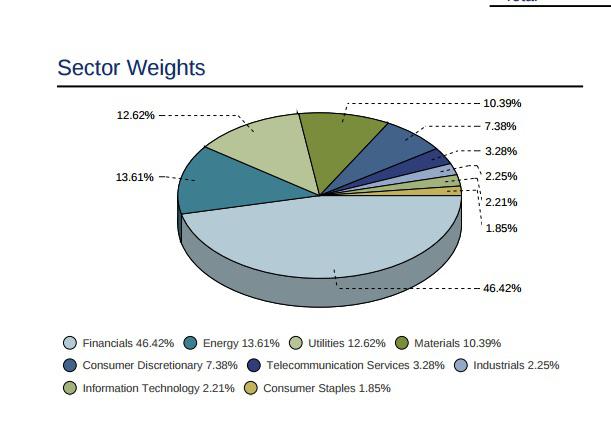
Security Description: The iShares MSCI Poland Capped ETF (NYSEARCA:NYSEARCA:EPOL) attempts to track an index representing Poland's stock market.
Sourced: MSCI Poland Index.pdf
Sponsor's website: iShares MSCI Poland Capped ETF | EPOL
Sponsor's Fact Sheet as of 3/31/15: EPOL (beta vs. S&P 500=.57; the standard deviation is high at 21.92 over 3 years compared to SPY at 9.56)
I view the expense ratio as high for an ETF at .6%.
Sponsor's Website: iShares International Select Dividend ETF (expense ratio: .5%)
I am not familiar with any of the stocks owned by this fund.
I took a snapshot of the top 15 holdings as of 4/16/15:
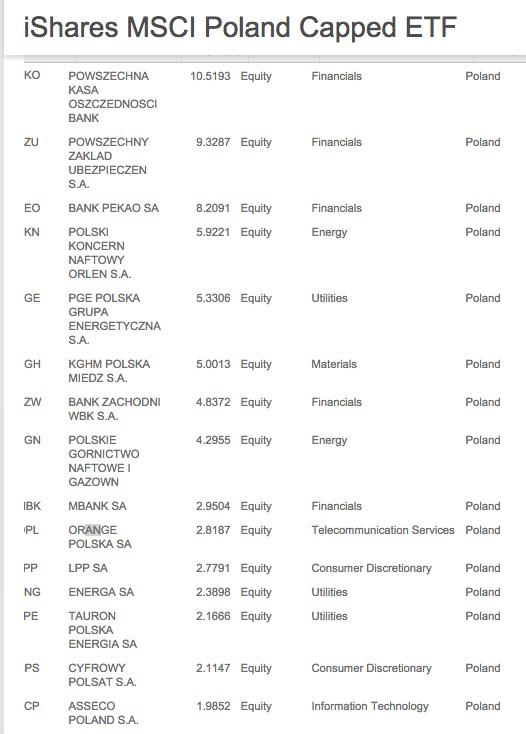
The fund at that time owned 45 stocks.
I know nothing about those stocks and would never take the research them for a possible purchase. A few of the top 15 names are at least capable of being pronounced by me.
I just limited myself to looking at the Marketwatch pages for the top two holdings and glanced at their recent earnings reports:
Powszechna Kasa Oszczednosci Bank Polski S.A. Stock Price Today (PKO:WAR)Financial Reports | Investor Relations | Polish PKO Bank | Bank PKO Polish
ADR Trades in USDs on the Pink Sheet Exchange: PSZKY
Powszechny Zaklad Ubezpieczen S.A. Stock Price Today (PZU:WAR)Analyst Coverage And Recommendations
One money manager currently calculates the following valuation metrics for Poland's Stock Market based on what was shown as of 4/20/15:
Poland
Shiller CAPE P/E: 10.2
P/E: 19.8
Price to Book: 1.3
Price to Sales: .8
Even with three low ratios, I would not have bought this ETF but for the substantial decline in the Polish Zloty's value against the U.S.
Two themes are being played with these small foreign county ETFs: a substantial decline in the ordinary currency vs. the USD and a low Shiller and other valuation ratios.
The Polish stocks have 3 out of 4 of those valuation ratios suggesting only a low valuation. As with any individual stock, there are reasons why investors are not enthusiastic about future prospects, at least when viewed at the current moment in time.
U.S.
Shiller CAPE P/E: 28.8
P/B: 2.9
P/S: 1.7
P/E: 20.6
Global Stock Market Valuation Ratios
The sponsor claims that the P/E ratio was 17.7 as of 3/31/15. It is important to click the "i" next to that number to see how that P/E is calculated. The P/E is based on trailing 12 months earnings but excludes "extraordinary" items, companies with negative earnings and stocks with greater than 60 P/Es. My response is to give me the facts as they are rather than after a massage.
In my article discussing the purchase The Global X MSCI Norway ETF (NYSEARCA:NORW), I noted that the Shiller CAPE P/E frequently has no relationship with annual performance numbers.
Some of the worst performing stock markets in 2014 had the lowest CAPE ratios (e.g. Greece and Russia), while some of the higher CAPE ratios performed well into positive territory.
Meb Faber has the CAPE ratios as of 12/31/13 and the 2014 performance numbers.
There are other objective and subjective factors that will have material impacts on overall performance, ranging from rational economic future forecasts to delusions.
Poland had a 12.3 CAPE as of 12/31/13 and EPOL lost 15.34%. The highest CAPE was Indonesia at 26.5 with a +24.05% performance. Those who adhere tightly to Shiller's CAPE will argue that the high CAPE ratio countries will revert to their means, which is established by data since the 1880s for the U.S. stock market.
Poland's Economic Indicators:
The EU believes that Poland "weathered the economic crisis and its aftermath very well".
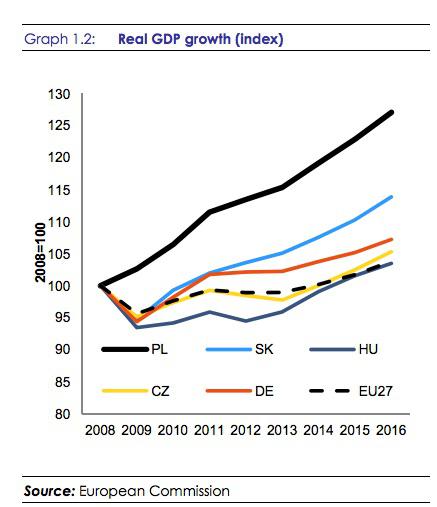
Sourced: europa.eu/ poland/ pdf
Poland's unemployment rate is currently high at 11.7%.
Poland's annual GDP growth rate has averaged 4.2% from 1995 until 2014. The 2014 GDP increased by 3.1% compared to the 2013 4th quarter.
On a negative note, Poland's CPI numbers have been negative since June 2014, with a -1.5% reading in March 2015. The average inflation rate was an unhealthy 9.64% from 1992 through 2014. While it is to soon to know, replacing those problematic historical inflation numbers in the rear view mirror and generating low future inflation numbers, would be more positive operating environment. Persistent deflation and problematic inflation numbers are unhealthy
EU Forecasts for Poland's economy:
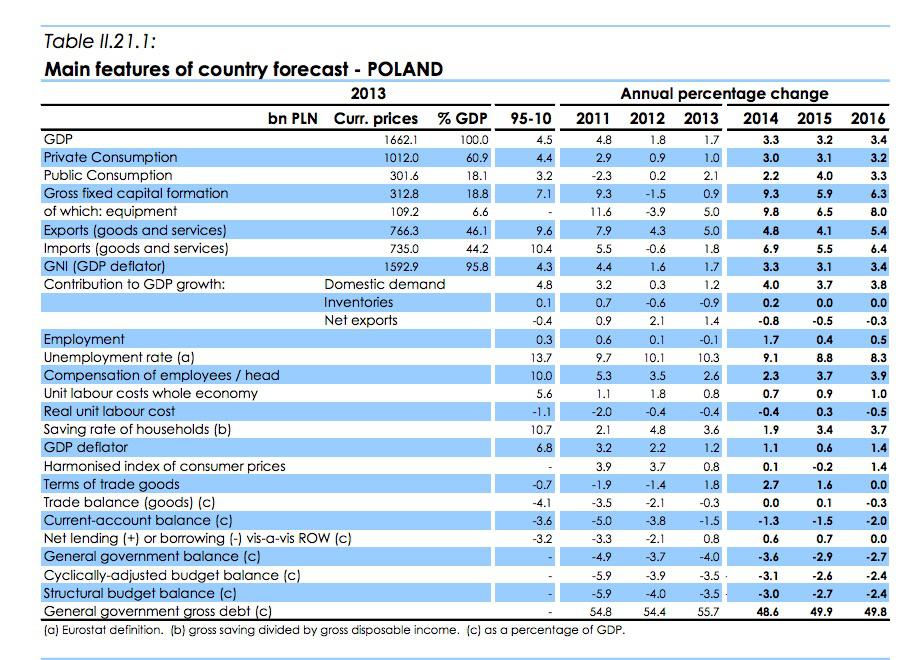
Sourced: .EC Forecasts as of February 2015/pdf
Prior Trades: None. This is my first purchase.
Dividend History: Dividends are paid semi-annually at variable rates.
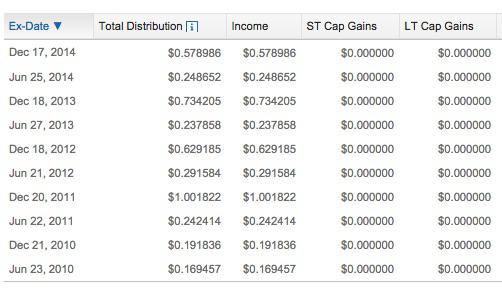
The fund paid out $.827638 per share in dividends. If I use that number, the dividend yield would be about 3.39% based on a total cost per share of $24.45. The actual yield will vary based on future distributions.
Chart: The price peaked in April 2011 near $40 per share and then crashed to about $23.5 within a few months thereafter. A low was hit near $20.9 during May 2012. Since that time, EPOL has been trading in a channel mostly between $24 to $30. The last upward price spike started in June 2013 near $24 and peaked at near $31.5 in November 2013.
All of the foregoing severe up and down spikes contribute to the high standard deviation number. Usually, I prefer far less volatility in a stock or a fund.
Standard deviation is explained in a number of articles available for review using the internet, including these articles published at Morningstar and StockCharts.
Rationale: I have been buying 50 share lots of foreign country ETFs that have low Shiller P/Es and other ratios, particularly compared to the U.S. stock market, and whose currencies have declined 20% or more versus the USD.
The large decline in the Polish Zloty ("PLN" hereinafter) against the USD makes Polish stocks cheaper for a new buyer of a USD priced ETF that owns stocks priced in PLNs.
A one year chart shows the carnage. The important point is that I missed the decline until the date of my purchase.
One Year Chart PLN/USD:
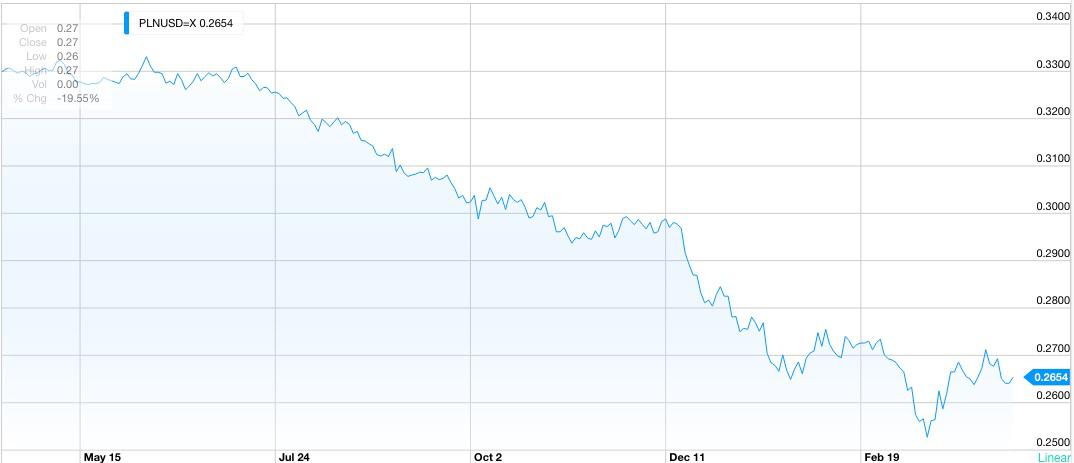
7/14/14: 1 USD=3.04 PLNs
3/15/15: 1 USD=3.954 PLNs
PLN's Value -30.07%
TOP on Day of EPOL Share Purchase 4/15/15=3.8
% Decline 7/14/14 to 4/15/15: -25%
The USD is at a ten year high against the PLN. USD/PLN Chart The prior spike in the USD topped at 1 USD buys 3.9 PLNs on 2/18/2009. The USD was strong against most major currencies during that post Lehman bankruptcy period. The recent spike high hit 3.954 on 3/15/15.
It remains to be seen whether or not that level will be the top.
In a recent article, I discussed the rationality of the USD spike against major currencies: Added To iShares International Select Dividend ETF-iShares International Select Dividend ETF (NYSEARCA:IDV) | Seeking Alpha
It is impossible to know at what level or the time period of a parabola's peak, up or down.
And, it is possible that the USD's parabola will collapse upon itself using the U.S. Dollar Index (6 currencies weighted in the EURO) or the broader Bloomberg Dollar Spot Index with 10 foreign currencies, while the PLN remains weak against the USD for reasons specific to that country.
The PLN is not included in those two Dollar indexes, where dollar strength is measure when the line moves up. The 5 year charts for the DXY and the Bloomberg Dollar Spot Index clearly shows the USD's current parabola.
A Seeking Alpha published an article after my purchase discussing his arguments for PLN to continue its decline against the USD.
There is some dividend support for the ETF.
The $24.45 current price was near the low end of the 2012-April 2014 price channel.
Risks: Currency risk is of course a dominant risk as noted above.
The fund describes the usual risks in the Prospectus (e.g. risks associated with concentration, country, currency, stock, sector risks (e.g. financials), non-diversification, EU, etc. and so on)
Barron's published a negative article about Poland's stock market in November 2014. One of the problems was the overweight in financials that were in the author's view richly priced at the time.
There is certainly concentration risk with this ETF.
I suspect that Poland's stocks are feeling some blowback from Russia's renewed military aggression. Poland borders both the Ukraine and Russia. The Ukraine confrontation appears to have just boiled to a simmer in recent weeks.
And, as we know, Russia had an ongoing military occupation of Poland after WWII.
And the current Ukrainian President claimed that Putin privately threatened to invade Poland, Hungary and the Baltic states. Sounds about right but who knows unless there is a recording and that would need to be forensically examined by impartial experts.
Disclaimer: I am not a financial advisor but simply an individual investor who has been managing my own money since I was a teenager. In this post, I am acting solely as a financial journalist focusing on my own investments. The information contained in this post is not intended to be a complete description or summary of all available data relevant to making an investment decision. Instead, I am merely expressing some of the reasons underlying the purchase or sell of securities. Nothing in this post is intended to constitute investment or legal advice or a recommendation to buy or to sell. All investors need to perform their own due diligence before making any financial decision which requires at a minimum reading original source material available at the SEC and elsewhere. Each investor needs to assess a potential investment taking into account their personal risk tolerances, goals and situational risks. I can only make that kind of assessment for myself and family members.