Background:
State Street Corporation (NYSE:STT) offers a variety of financial products and services to institutional investors worldwide. The company also provides investment management services. Products are also offered to mutual funds, collective investment funds, and other investment pools. It was founded in 1792 and headquartered in Boston, Massachusetts.
STT has recently broken the resistance drawn from the highs of late April. Stock trades over all SMA figures, uptrend evident. SMA 20 is above the SMA 50 and also along the SMA 200, showing that the short-term momentum is bullish, since the crossing of the SMA 20 over the SMA 50 and later the SMA 200.
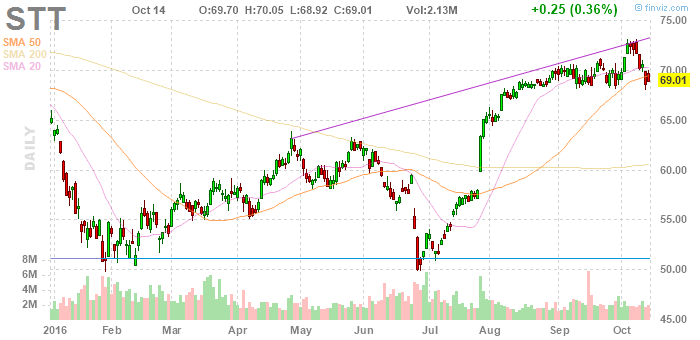
Data via finviz
Crossover in early August pushed the price level upward drastically. It doesn't take a technical analysis guru to know that gaps in equity prices can be filled up very easily due to weak support and resistance levels, which formed after the SMA 20 crossing over the SMA 50 through the month of August. Thus, a price movement into the $57-65 territory, influenced by a retracement by the overall market in the near future, could make STT an attractive buy.
New CFO Eric Aboaf will be appointed in December, who is coming from Citizens Financial Group (CFG), right around the same time period we are expecting an interest rate hike by Janet Yellen. State Street is currently up 8.5% YTD even though it was rated as "Underperform" by KBW. However, it has recently re-rated State Street as "Market Perform". While at the same time, peers in asset management like BNY Mellon (BK) and Northern Trust (NTRS) were going through small declines. Smart beta ETFs may be the next opportunity to see industry growth realistically. A realistic forecast would be that new entrants that gain market share will be bare minimum, leaving the market to large segment holders, like STT. This would lead to a decline in actively managed funds and even more of a decline in single-stock trading. Empirical evidence points towards +0.81 of a correlation between AUM and the age of ETF. State Street is alongside iShares (BLK), Schwab (SCHW), and PowerShares as the largest ETF sponsors.
Passive money saw inflow of $16.4B versus $33.8B in July. Emerging markets saw inflow of $6.2B from developed markets. STT alongside Vanguard saw capital inflow into active strategies, which is a good indicator for State Street since it has been doing well on both active and passive management. Named for the 10th time in the last 11 years for the North America Dow Jones Sustainability Index. The index reflects on corporate sustainability.
Catalysts
U.S Election Process:
A possible Donald Trump presidency could result in short-term volatility within markets. Movements on the volatility index (VIX) will reflect with increased volatility as the election process comes to a close.
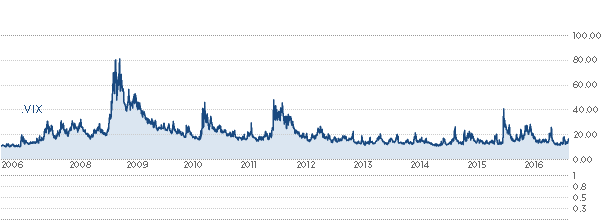
CBOE VIX data via CNBC
There were two clearly visible spikes on the VIX. While the last two elections were going on, the subprime mortgage crisis had a more significant effect on the volatility of financial markets relative to the actual election in 2008. Resulting with a spike through the election process reaching over 72 levels. Obama's second term saw a spike in the VIX to the 45 levels, which defined the level as a resistant level, considering the stagnation at the same levels after the '08 election. Realistically, this election cycle should test the 45 levels. However, the resistant being broken is very unlikely, given that '08 was one of the most volatile years in equities due to the housing bubble bursting. Hence a spike in volatility is expected but not at the levels that the housing bubble caused. A Hillary Clinton presidency is more appealing to asset management firms compared to the alternative choice. A Donald Trump presidency could mean the repealing of the "Affordable Care Act". On top of that, a close election and a statistically unlikely Trump presidency could result with the VIX to surge through the resistance level of 45.
Interest Rate Hike in December
Following the market correction due soon, which will be orientated around the election, I expect markets to be in a consolidation state until the interest rate hike in December. Market-moving events going into November should consist early on in November as: personal income and outlay, FOMC meeting announcement, two back-to-back EIA petroleum status, and jobless claim figures. If the rates are increased, the financial services should perform better than the market itself. Janet Yellen still hasn't confirmed the likelihood of the December rate hike, which, in return, brings a lot excess uncertainty that the market does not need currently. The federal funds rate (U.S interest rate) is currently standing at 0.5%.
Market Environment:

Data via bespokepremium.com
Graph indicates that the earnings multiple of the S&P 500 is at an over-priced state. Earnings season was poor on an aggregate level. Therefore, a case for a bullish market for the near future is unlikely. Lower-than-expected earnings mean that bullish market is not sustainable. Consolidation all across the board is a likely catalyst. Hence I believe it is critical to look for equities that have been along for a significant amount of time, and have kept consistent and growing earnings profiles.
Interest Rates:
Central banking authorities around the world keep on believing that low even negative interest rates will steer growth, which is resulting in decline of capital and ineffective "easy money" policies. Japan and some European central banks are keen on keeping rates unchanged. Draghi, head of the ECB, stated that rates are likely to stay the same for the foreseeable future. Financials are in hope for a rate hike from Janet Yellen in December. With a Fed that doesn't look too eager to raise rates due to the risk of a pullback in markets, there is no certainty that the Fed will raise rates in December.
Post-Brexit Settlements:
Clarification in regards to Great Britain's departure process from the European common market will be vital in the following months. Hence the Fed and ECB will be following talks in regards to Article 50. Specifically, the framework in which the new trade and travel laws that will be established as a major catalyst alongside the possible rate hike in December by the Fed and the U.S election. After the framework in which Article 50 of the Lisbon Treaty is settled, the Eurozone will see more stability in markets. Deutsche Bank (DB) is dependent on the clarity of Great Britain's departure from the common market for stabilizations. Exposure to European banks should be limited, even though most European banks are close to 52-week lows. Especially, Italian banks still carry systematic risk and Deutsche Bank is still unattractive - ~$13 - due to the climate of uncertainty. Banks and asset management firms with minimum exposure to the Eurozone are more attractive relative to their European counterparts. Settlement of conditions should be laid out in March of 2017.
Consolidated Financials
Data via Reuters (10/10/2016), unless indicated otherwise.
Price: $70.34
Market Cap: $28.15B
P/B: 1.48
- P/E: 14.69
- Fairly large equity, price to equity (P/B) is relatively small and less than the industry average of 1.59. Earnings multiple (P/E) isn't very representative when it comes to financial equities. However, P/E of State Street is still undervalued relative to the industry average of 131.75. Three-year dividend growth rate: 37.15%. Five-year dividend growth rate: 154.55%. Dividend payout increasing over time. ROE TTM 10.52%, return on equity positive while industry is at -7.99, indicating that the asset management firm is showing signs of clear profitability, meanwhile the asset management industry is in the opposite state. EPS (MRQ vs. Qtr. one year ago): 55.52. Earnings per share drastically higher than industry average of -10.82. Assets under management (AUM): $1.91 Trillion, assets under custody: $18.79 Trillion. Decline in overall debt YoY in 2015, relative to 2014 from $23.37B to $17.79B, a decline in total debt of 31%. Lower total debt compared to previous years indicates the strength of the company's financial solvency. Low debt is something we are always looking for in financials, especially in banks and asset management firms. Capital spending - five-year growth rate: 21.82%, capital spending shows us the amount of capital a company spends to increase the scope of its operations. Industry average 13.08%. State Street is spending significantly higher amount of capital relative to the industry. EV (Enterprise Value)/Free Cash Flow: 5.5x. EV/FCF: Measures the valuation of the company in respect to its ability to generate cash flow. Citigroup (C) has an EV/FCF of 12.8x, a value much higher than of State Street. Thus, State Street generates cash to reinvest in the company much more effectively than reasonable comparable Citigroup. EV/FCF is a good measurement to take into consideration because the calculation includes debt, minority interest, preferred shares total value, while cash and equivalents are taken out in the calculation. Cash and equivalents are taken out of the calculation because we are trying to calculate the value of the company via EV. If a company is worth the discounted value of future cash flows, then cash and equivalents in the balance sheet must be taken out because it is a non-operating asset and does not contribute to generation of future cash flows.
EV/FCF data via Money.Net
Valuation:
Enterprise Value EV/Revenue:
-
-3.48
Enterprise value used because it takes debt into account whereas market capitalization would not reflect on it. More reflective than P/E. Negative value indicates that the company can acquire itself with its own cash accounts. Cash and cash equivalents greater than market capitalization and debt structure of STT.
Return On Equity (ROE):
-
10.74%
ROE ranked higher than 75% of 1,570 companies in the global asset management industry. Median ROE for the last 10 years for State Street was at 9.2%, a value relatively higher than the median ROE figure for the industry at 2.19%.
Discounted Cash Flow Model (DCF):
Discount rate: d=12%
Growth rate in growth stage: G1=5%
Years of growth stage: Y1=10
Terminal growth rate: G2=4%
Years of terminal growth: Y2=20
Thus:
FCF: $18.24
EBIT (1-tax rate) + Depreciation + Amortization - Change in networking capital - Capital expenditures = FCF
DCF (Future Assets Based): $195.2
Cash flow^n / (1+r)^n = Discounted cash flows
Margin of safety for STT is 63.82% using the DCF. Discounted cash flow model gives us an instinctive value based off future earnings expectations rather than current assets.
To offset any sort of risk due to the assumption I have made, I will conduct a DCF valuation again but this time instead of basing it off future earnings, we will use current earnings power to come to a value.
DCF (earnings based): Earnings used instead of free cash flow.
Instinctive value based off earnings is $52.33.
DCF (earnings based): $52.33
Risk:
Pair Correlation between STT and S&P generated via Macroaxis.com (10/10/2016).
Past August, the company paid a fine worth $530 million due to hidden markups in forex trades. Big chunk of the money went to government agencies, the SEC, and the Department of Justice. It has been frequent practice lately that institutional investing companies have been going through such sketchy activities with client accounts, similarly like Wells Fargo (WFC). Although, similarly to Wells Fargo, State Street should not be effective significantly in the medium nor long term. Consolidation is highly possible, especially as the election process comes to a close. As we get closer to the election process coming to an end, financial markets should recover from the consolidation and a "V" curve is plausible in a bullish manner. Although, there isn't certainty that State Street will appreciate with the overall U.S stock market (SPY), the monthly pair correlation between STT and S&P is at 0.7. The correlation value is between 0.7-1. Thus, there is a strong positive correlation between movements between STT and the aggregate stock market, taking into account the firm linear rule. The likelihood of a surge following the consolidation is highly likely, only if the S&P reacts accordingly. Assumptions made on the DCF modelings could not be reflexive of likely market outcomes. The asset-based value could be understating instinctive value and the future earnings-based DCF value could be overstating the instinctive value.
Conclusion:
The distinctive difference between the two models, derived from assumptions made in favor of either earnings or future earnings. Hence we have two prices: $52.33 and $195.2. So, I believe that the mean of the two instinctive values could be neutral growth price target.
DCF (earnings based): $52.33 ($52.33 + $195.2)/2 = $123.765
Next, the first and third quartiles will give us the downside growth and upside growth target prices of; $88.0475 $159.4825.
Upside growth price target:
($123.765 + $195.2)/2 = $159.4825
Downside growth price target:
($52.33 + $123.765)/2 = $88.0475
Concluding my DCF model valuations, I believe the bearish target price at $52.33 is a reasonable entry level considering it is right below the $57-65 corridor that resulted from the SMA 20 crossing over the SMA 50. This range possible if the election process and the economic calendar causes markets to consolidate, after the consolidation, a bounce back from either the $57-65 corridor a price under the range down until the bearish target price. With a Clinton administration getting elected markets would gain more stability and a bullish close to Q4 on the aggregate level is viable. Furthermore, an increase in December would indicate that the majority of the financial services industry would appreciate in price. In order to have a price target at hand, the neutral price target at $123.765 is an attainable probable target.
| Cases | Bearish Target (Current Assets Based) | Downside Target | Neutral Target | Upside Target | Bullish Target (Future Earnings Based) |
| Price ($) | $55.33 | $88.0475 | $123.765 | $159.4825 | $195.2 |
| Relative to Current Price ($) | -34.41% | 25.17% | 75% | 126.73% | 177.5% |
Recommendation: BUY
Target price; $123.765.