halbergman/E+ via Getty Images
Introduction
As the first quarter of 2024 has drawn to a close and the first earnings season of FY 2024 is heating up, we stand at an exciting place in the market.
From economic acceleration to rising geopolitical currents, all of them will have combined effects set to influence the global agenda for years ahead. Notably, China steps boldly back into the spotlight after grappling with the lingering shadows of pandemic restrictions to chart a course of resurgence and renewed influence on the world stage. With the government coming in and setting ambitious targets for growth, the Dragon Nation is not looking at mere recovery. Still, it sets strategic benchmarks to emerge as a central hub of innovation and sustainable development.
Meanwhile, the reality of instability is being felt with the tensions rising between Iran and Israel, casting fear over the international community and also financial markets. These tensions underline a stark reminder of the fragile peace in the world and the thickness of its economies, where a spark in one location can easily ignite problems in other regions.
The first months of 2024 were undoubtedly relatively uneventful, considering the ongoing wars and conflicts. The past few days, however, have been vastly different.
Markets fell drastically on April 12th as hedges came in due to potential escalation in the Middle East, which caused SPDR® S&P 500 ETF Trust (SPY), Invesco QQQ Trust ETF (QQQ), and iShares Russell 2000 ETF (IWM) to drop dramatically in just a few days.
Ycharts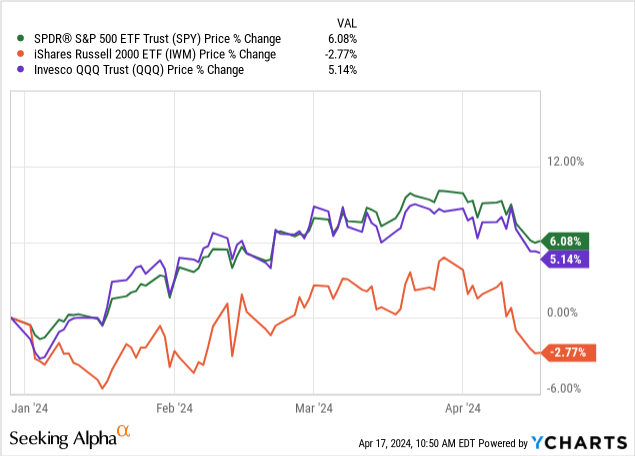
In this article, we will take you through a broad fan of what, we believe, are key areas to be focused on when it comes to what we expect for the performance of the ETFs you see in the chart above.
China
We have talked a lot about China and the economic pressure the country has been under for the past year and a half.
Most people assumed the economy would recover once China had eased its last COVID restriction at the start of 2023. This has by far been the case, and it has taken well over a year before we started seeing signs of a recovering economy in China. Due to recent policy changes and data from the economic powerhouse, we will examine what is happening in mainland China again.
A 5% Growth Target
China is setting its sights on a promising future, aiming for a GDP growth of around 5% in 2024. This ambitious target fits well within its ongoing five-year plan, signaling a bright outlook for its economy. Early indicators, like increased power generation and a boost in tourism, suggest a positive trajectory.
To achieve this, China is taking a proactive stance with a mix of active fiscal measures and cautious monetary strategies. The plan is to ramp up public spending, support local governments with special purpose bonds, and roll out ultra-long-term special treasury bonds to back major national projects.
A key focus is stimulating domestic consumption. The government hopes to refresh new and traditional spending habits by boosting incomes and easing restrictive practices. This includes pushing for adopting new energy vehicles and electronics, aiming to invigorate the market and encourage sustainable practices.
On the international front, China is working to attract more foreign investment by lowering entry barriers in select sectors and fostering a more welcoming reinvestment environment. This "improve the business environment" strategy underscores a broad-based effort to make China an even more attractive place for foreign businesses.
Moreover, China remains dedicated to its green initiatives, promoting sustainable manufacturing practices alongside its ambitious dual carbon goals. By enhancing its carbon credit schemes, China invites others to join its journey towards green development, signaling a commitment to environmental sustainability that aligns with global efforts.
Was the Deflationary Death Spiral Averted?
Between 2022 and the most recent data from 2024, China's inflation dynamics have shown notable shifts. This year, the average consumer price inflation (CPI) has been about 2.0%, which keeps in line with China's moderate CPI over the past decade, averaging between 1% and 3%. This was one of the solid outcomes that emerged with managed economic growth, vast manufacturing capabilities, and targeted interventions by the government, even under an international scare of trade tensions and, most recently, the pandemic.
However, moving into 2024, the trend began to show signs of deflationary pressure. As seen in the figure below, China's CPI in January 2024 was lower by 0.8% than a year before. The decline was the fourth in a row and also the largest since September 2009. A major factor behind such a move was a fall in food prices. Inflation began rising in February and only slightly in March, the most recent reading. We do not see a clear trend yet; however, recent economic stimuli may start to take effect, as seen in the CPI data.
tradingeconomics.com
However, the economist warned that consumer confidence stayed sluggish, putting a ceiling on a demand-led reflation pace. Analysts will watch for the impact of policy shifts, likely to emphasize more social housing, with more role for the government in housing provision. This new policy shift is expected to influence the property market and broad economic trends. Increased credit pressure among the property developers and the transition can contribute to liquidity challenges and demand uncertainties.
Systemic risks, however, are seen as quite remote. For the property sector, the recovery is anticipated to be not quick and uneven, as it reflects intervals of risk followed by stabilization efforts. They underlie the aspect that, though the deflationary pressures were sharp in the early months of 2024, the outlook remains cautiously optimistic, depending on the effectiveness of the policies put by the government and the revival of consumer confidence, as well as growth in the strategic and high value-added manufacturing sectors.
The overall economic outlook for China in 2024-with a slowing down in GDP growth to 4.4% per annum and a moderate inflationary ascending tendency-reflects a mixed and difficult economic scenario. These trends underline China's intricate balance between stimulating economic growth and controlling inflation amidst changing domestic and international challenges. The extent to which China's inflation and overall economic performance will be of serious concern to the government in the next few months will be heavily determined by their policy responses and fortunes inside and outside the Chinese economy.
Geopolitical tensions
If you were looking at the market on Friday, April 12th, you may have noticed that the market took a pretty hefty dive while the S&P VIX Index (VIX) was up to 19 at one point. A lot of this was due to threats made by the Iranian regime aimed at Israel. Iranian officials made explicit threats towards Israel, intensifying concerns of a potential retaliatory strike. After an Israeli airstrike targeted the Iranian embassy in Damascus, causing significant casualties, including members of the Islamic Revolutionary Guard Corps (IRGC), Iran has expressed strong retaliation intentions. The commander of the IRGC has explicitly stated plans to retaliate against what he views as aggressive acts by Israel against the Iranian state.
The situation has led to a series of preventive measures in Israel. For instance, the Israeli government has heightened security protocols, closing several embassies worldwide due to the increased threat level. These closures reflect concerns about potential Iranian attacks on Israeli diplomats and facilities abroad. In addition, the Israeli military has been put on high alert, anticipating possible direct strikes on Israeli soil within a short timeframe.
The discourse around these threats has been severe, with Iran's leadership using extremely harsh rhetoric against Israel, which has been criticized internationally for its intensity and the nature of the language used. This rhetoric has included comparisons of Israel to virulent diseases, underlining the extreme hatred in the official stance of Iran towards Israel.
As of writing this piece, news broke that Iran had sent drones and missiles Cryptocurrencies fell immediately by 10%, and even as much as 30% within the first 30 minutes of Iran's announcement. Given that the situation does not worsen further, we expect the market to react significantly. Still, it is also important to remember that the market was highly leveraged as of market close on Friday, the 12th.
On Monday, April 15th, new developments caused the market to drop again, with the VIX reaching over 19 at one point during the trading day. As this situation develops, drawing meaningful conclusions and analyses is far too early. We suggest moving cautiously for the foreseeable future until tensions have settled again.
Rate cuts?
As we mentioned in our last piece, the market has taken on a "bad news is good news" type of sentiment - and vice versa. The obsession with when and how deep the interest rate cuts will be is a key driver to the current short-term movements in the market today. Therefore, the question of how many rate cuts the market is currently pricing in is critical. In the figure below, we have shown the Fed funds futures for September, November, and December of this year. We have changed the values slightly to represent the current market expectations for each month's Fed funds rate. Effectively, these curves show the expected rate cuts currently priced in by the market.
TradingView
The key takeaway is that the market has slowly adjusted its rate-cut expectations. It now sees a Fed funds rate at 5.11%, 5.0%, and 4.93% in September, November, and December, respectively. Remember that the current rate is between 5.25% and 5.50%. This also means that the market currently expects very marginal cuts in 2024-as of writing, approximately one cut of 25 basis points and one of 15 is currently priced in.
So why the change of sentiment? As we can see, the Fed funds future for December (red color line) had the Fed's fund rate at approximately 3.76% at the beginning of the year. For starters, the inflation rate, shown as the black line in the graph below, has had a recent uptick in both February and March, showing that inflation has been much stickier than first anticipated.
Stock Info
This is due to various factors, but most importantly, shelter inflation has proved to be a much greater hurdle to overcome. It is also the "heaviest" component in that it will take the longest to come down.
The current debate, though, is centered on whether these rates are enough to deal with an inflation that has persisted perhaps longer than expected. The Federal Open Market Committee (FOMC) remains cautious, with even Powell calling a signal for the existing rates as too distant from those that would be optimal to reach the Fed's long-term inflation goal of 2%.
If we use the CME Group's FedWatch tool, the proprietary model evaluates the probability of rate cuts (and hikes) at the different meetings throughout the next 12 months.
CME Group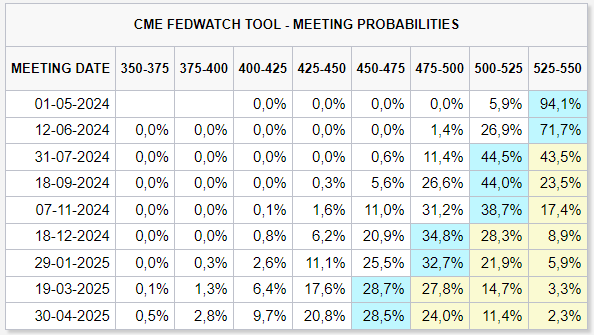
Using this model, the probability of a rate cut in the coming months is not exactly great. Their model suggests that the Fed funds rate will likely be in the 475-500 and 500-525 point space by the end of the year-this is also very similar to what we saw from the Fed funds futures earlier.
In addition, the unemployment rate is another important indicator to be mindful of. Unemployment has come down significantly following the COVID-19 lockdowns from 2020 and 2021, but recently, we have seen a slight uptick in February, to 3.9%. As Powell has stated numerous times, unemployment is also a significant indicator for the Fed.
If unemployment shows trending readings to the upside, it could give a reason for an interest rate cut. For now, we await the unemployment reading for March to see where unemployment is headed.
tradingeconomics.com
So what does all this tell us? Simply put, inflation is stickier than many had expected, so the market has slowly adjusted its expectations to how many rate cuts we see this year. This can change fast once we get new PCE and unemployment data, as these two indicators could allow the Fed to loosen slightly.
Commodities
Commodities have rallied solidly over the first four months of the year, an asset often overlooked by some investors.
Other plausible interpretations from the commodity price of late assessed by the (TRJEFFCRBI) index reflect, perhaps, the explanation that economists have broadly found. It could be because of the complex interrelation of many factors that echo across the global economic landscape, reflecting on both fundamental economic principles and situational dynamics.
TradingView
Economists often point to supply or demand forces to push commodity prices in either direction, but rarely both. Recent disruptions in the supply chain, courtesy of increasing geopolitical tensions and the not-yet-over hangover of the pandemic, continue to exert a huge bearing on prices. This may be, for example, a decrease in supply due to controlled production at the source or slow-downs in major commodity-exporting countries that would send prices upwards. We pointed this out last year about copper production.
Demand, on the other hand, will show a positive response due to the acceleration of economic recovery in the world, thereby pushing prices up with the increase in commodity demand. On the other hand, the growth in industrial activity will raise production speed and help the revival of consumer demand, which will be propelled by growing investments in mainly emerging markets for infrastructure. Sectors that have most relied on commodities-that is, construction and manufacturing-are witnessing a jump in demand.
Monetary policy and inflation expectations play an important role, too, as the low interest rates in major economies after the pandemic makes commodities even more appealing as an inflation hedge. Commodities are sometimes considered safe havens in the face of currency devaluation, and thus attract lots of attention during inflation.
Another significant factor is the strength of the US dollar, since most commodities are dollar-denominated. The lower the strength of the dollar, the more often commodity prices decrease when converted into other currencies, which may bring in further demand, affecting prices.
This makes the Dollar Index (DXY) all the more interesting. As we see the TRJEFFCRBI index rising, so has the strength of the dollar-a somewhat unexpected divergence from normality.
Dollar Index (DXY)
Thus, the rise in commodities can be a mixture of a supply crunch. However, the recent flight to gold could suggest that big institutional investors are seeking a safe haven due to the geopolitical and overall uncertainties regarding rate cuts.
Market Pulse
In this section, we will discuss various indicators that we've examined in our previous market outlook pieces.
First, we want to look at the Nasdaq McClellan Summation Index, or $NASI, index, which we have described in detail in our previous pieces here and here. The $NASI index is a market breadth indicator that tracks the net expansion or contraction of stocks on the Nasdaq, using the daily McClellan Oscillator values.
When the $NASI falls while the market is rising, it indicates that the rally is supported by only a few large stocks rather than a broad array of companies, suggesting underlying market weakness. This pattern can warn of a possible market peak or reversal if the broader market doesn't support the index's increase.
On the other hand, it can also indicate a potential local bottom, as stocks that have fallen behind the stack are picking back up.
stockcharts.com
In addition, this falling $NASI and rising market might also reflect sector rotation, where investment shifts from a wide range of stocks to specific sectors or large-cap stocks, heavily influencing the index. Usually, a divergence between the $NASI and the broader market is seen as a warning sign. However, with the $NASI still above its 50 and 200 SMA and an RSI around 50, the market could still hold up. With that being said, caution is still advised.
Moving onto the Nasdaq McClellan Oscillator, or $NAMO index, which we also talked extensively about here, shows us that the Nasdaq is consolidating and hasn't truly found momentum in either direction for some time now. Remember, $NAMO is a momentum indicator, and given the reading has been hovering around 0 for the past couple of weeks, it indicates that the market does not have a definitive direction when looking at a longer timeframe.
Stockcharts.com
Along with a falling $NASI, it is difficult to determine exactly which direction the market is headed. Recent geopolitical events, such as tensions in the Middle East, make it difficult to predict. Therefore, we suggest taking a careful approach and staying hedged in the short term.
This is very interesting when we look at the overall market breadth using the advance/decline line in the Nasdaq composite, shown below. We want to point out that the A/D line has been continuing to decline even as the Nasdaq has reached new all-time highs. Now, the recent AI craze has definitely helped lure money to the tech-heavy Nasdaq index, but the divergence between the A/D line and the index is something we have yet to see in the last 20 years.
If we draw a parallel to 2009, where the A/D was approximately at the same reading as it is now, we see that shortly after, the market began a steady climb following the great financial crisis. It's important to remember that today's market is not suffering from an economic downswing - quite the opposite; the U.S. economy continues exceeding expectations every month and is in a decent place overall. Inflation is still a problem the Fed is attempting to tackle, partially because the economy is doing as well as it is.
marketinout.com
Next, look at the infamous Fear and Greed Index, a proprietary model by CNN. For the first time in a while, we are well into "fear" territory, potentially indicating a local bottom. This is the first time I have received a reading like this since about November - six months ago. Once again, it might be too early to conclude whether this reading signals worse things to come or if the market is simply experiencing temporary stress.
CNN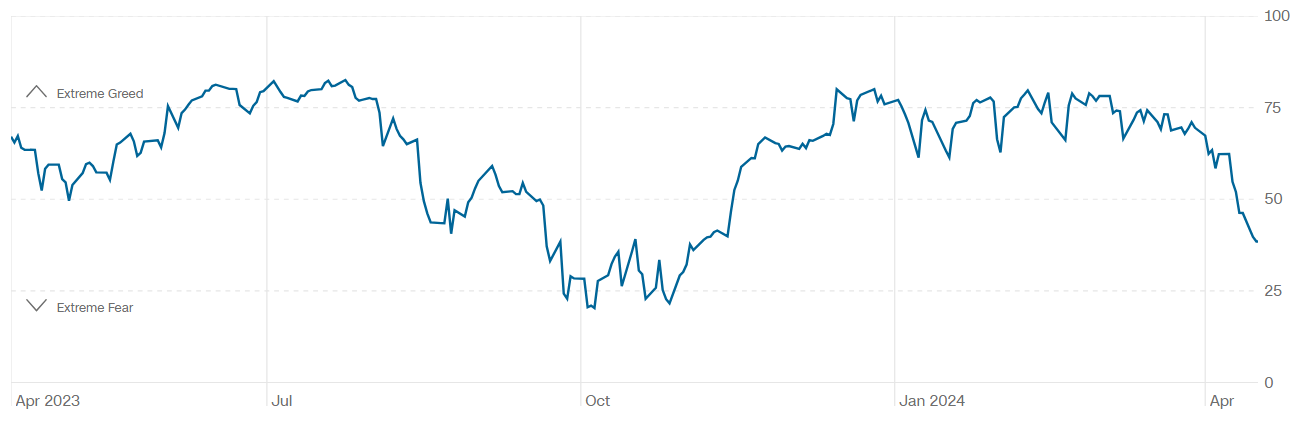
To end this section, we want to draw your attention to the NAAIM index we discussed in previous pieces. This number shows how much asset managers have changed their client's portfolios. An uptick means they have moved more capital into risk assets such as stocks.
The NAAIM number is still relatively big, meaning there is still a decent amount of risk appetite for the managers asked in this survey.
Overall, from a technical perspective, the market seems to be in a directionless position but not necessarily ready for a correction. Based on the $NASI and $NAMO, the market is consolidating, and the Fear and Greed index suggests we are at a point where greed is no longer the sentiment, and there is room for a move up.
Conclusion
As we move into mid-2024, the economic outlook is mixed and complex. This complexity mirrors the intermediate phase in the development of major economies such as China, which is grappling with post-pandemic recovery challenges and the inherent risks of geopolitics.
It will be essential to watch how China manages to maintain growth balanced with sustainability and inflation control. At the same time, there has been a need for thorough monitoring of the global reaction to the accumulation of tensions in the Middle East.
For investors and policymakers alike, the exact thing needed is that they remain vigilant and adaptable, ready to either mitigate arising risks or, conversely, take away emerging opportunities in this dynamic environment.