We advised investors generally to avoid US equity REITs in January 2007. At that time, we felt they had gone too far, too fast and were bound to suffer a reversion to the mean, by not performing or by declining. They went down a lot.
In August 2007, we reiterated our concerns that REITs were overvalued due to their distribution yield being too low relative to 10-year treasuries.
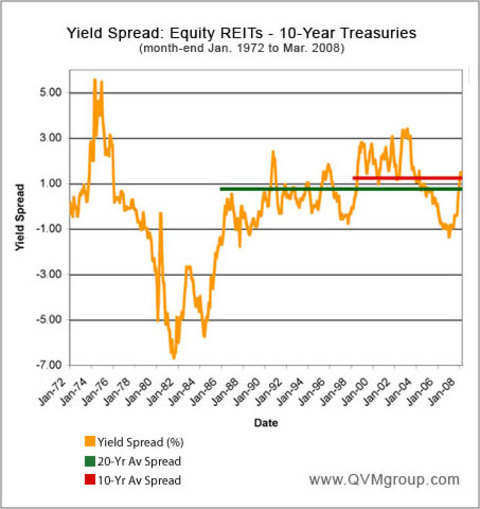
In January 2007, the yields of equity REITs were 1.36% below 10-year treasuries. In July 2007 (the last month before our August article), REIT yields were 0.44% below 10-year treasuries.
We recommended staying out of REITs until they were fairly valued with a 1.00% or greater yield than 10-year treasuries.
We did not say then, but clearly if an investor saw a steady shift from lower to higher yield by REITs, a gradual return to the class could have been considered. In fact, those who took that approach in 2008 have done well, as equity REITs have outperformed the overall US stock market.
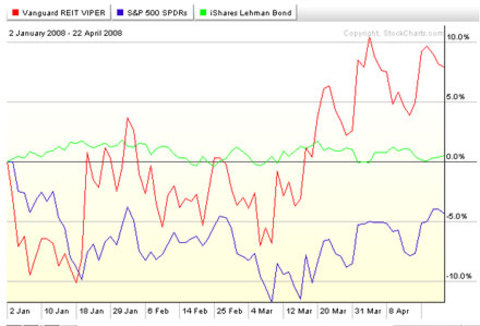
YTD REIT Price Performance:
The chart shows how stocks, bonds and real estate (REITs that is) have done relative to each other year-to-date (April 22, 2008). Stocks are represented by the S&P 500 index (SPY). Bonds are represented by the Lehman Aggregate Bonds index (AGG). Real estate is represented by the FTSENAREIT index (VNQ).
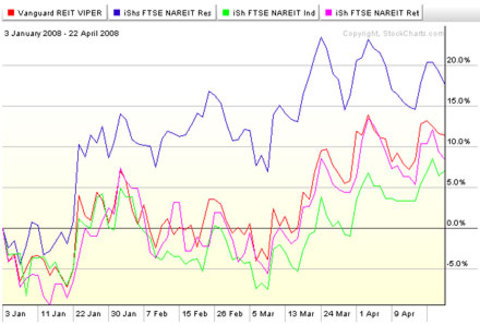
Interestingly, the chart comparing total equity REITs (VNQ) with REIT sector funds for residential (REZ), industrial (FIO) and retail (TRL) shows residential as the clear leader.
Recent Yield Spreads:
Equity REITs crossed over from yields lower than Treasuries to yields more than Treasuries in November 2007. That might have been a good time to enter the class, but with all the credit crisis mess going on at that time, we were not prepared to recommend taking that risk.
As of the end of March 2008, according to the National Association of Real Estate Investment Trusts, REITs yielded 4.99%. That was 1.48% more than 10-year Treasuries, which yielded 3.51% at that time. The spread is not as large today in late April, but is more in the range of 0.75%.
Remember that Treasury yeilds have been driven down by a flight to quality and to liquidity during the CDO and other credit markets crisis we are still enduring. As the crisis subsides and inflation becomes a bigger worry, Treasury yields may rise. REITs will need to follow with more distribution or lower share prices, if they are to hold their yield spread position.
There is never a perfect time to enter a market, but we have begun to feel that equity REITs make sense again, with the caveat that the financial markets are in great turmoil right now. Any recommendation is a short-term credibility risk for any analyst or advisor. Long-term, though, we think REITs make sense again.
The 20-year average month-end yield spread has been that REITs yielded 0.75% more than 10-year Treasuries, and the 10-year average yield for REITs was 1.23% more than Treasuries.
Clearly, REIT yields oscillate around Treasury yields. In a future article, we will explore the relationship of REIT yields to the S&P 500 yield.
There were some huge spreads in the 1970’s and 1980’s. That’s because there were some huge events back then. The question today might be whether the events unfolding now in the credit markets, energy markets, for inflation (real inflation, not the managed CPI put out by the government) and geopolitically, are more or less significant. If they are less significant, then valuation for REITs looks reasonable. If the current events are more significant, then the long-term past suggests we might see more major valuation swings.
REITs Yield > 1% More Than Treasuries (Nov 1973 - Dec 1975):
In the 1974 - 1975 range, we were at the end of a period of government ordered wage freeze (1972-1974). The Vietnam War was ending unfavorably for the U.S. in 1973. The Arab Oil Embargo began in October 1973 and changed perceptions about energy risk, as long lines formed at gasoline filling stations. Wage controls ended and President Nixon resigned in 1974. During 1974-1975, we saw the New York City financial crisis with possible bankruptcy concerns, and the issue of 13% tax-exempt Big Mac muni bonds. The S&P and Dow were deeply down and in a blue funk.
REITs Yield >1% Less Than Treasuries (July 1978-Mar 1986):
Paul Volcker becomes Chairman of the Federal Reserve (1979). Iran violates US Embassy in Tehran and holds Americans hostage. Gold tops at $850 (after bottoming at $104 in 1976). Hunt brothers create Silver crisis attempting to corner world market. The Iran-Iraq war begins in 1980 with prospective oil supply consequences. Spot oil tops $40 per barrel in 1980 for the first time (believe it or not, that was a shockingly high number then). Short-term Treasuries top 16% in 1981. Unemployment hits postwar high in 1982. Continental Illinois fails with a run on the bank in 1984. US Dollar sets a high against the Deutsche Mark and British Pound in 1985. The G-5 sets the Dollar Reduction Pact (yes, the opposite the G-7 plan today to rescue the Dollar). Oil prices falls below $7 per barrel. Interest rates reach 18-year low 1986.
Next:
If 10-year Treasury yields don’t shoot up next, or if REITs maintain a reasonable spread if Treasury yields do rise, REITs could be a reasonable investment now. If today is not as bad as the years before 1986, you might look into equity REITS as a separate class (note that they are in the S&P 500 for about a 2% weight).
REIT ETFs:
Some representative ETFs investing broadly in US equity REITs are:
VNQ, ICF, IYR, FTY, and RWR.
We have a full REIT allocation in our portfolios at this time, using VNQ.