Crude Oil ETF Hits Extreme Low Percent R Level
United States Oil Fund (NYSEARCA:USO), which tracks the spot price of West Texas Light Sweet Crude Oil, has been moving quite a bit lower since last Monday, September 17. Williams Percent R (using the BigTrends Percent R method) on the USO daily chart hit the extreme low level of 0.00 yesterday - we examined previous occurrences of this to see if it gives any indication of further price action. Also below, we take a look at the bigger picture charts on USO.
Going back to its inception in 2006, there have only been a few Percent R readings of 0.00 - it's a small sample size, but three of the four times (75%) or 4/5 (80%) depending on the time frame, USO was lower on the time frames of 5, 10, 15 and 20 trading days later (equivalent to 1, 2, 3 weeks and 1 month). This is based on shorting the open on the following trading day and buying back the close of the exit day.
The most recent reading was on May 18, 2012, and USO moved lower -1.3% over 5 days, -8.4% over 10 days, -11.5% over 15 days, and -9.7% over 20 days. The optimal bearish holding period after a 0.00 Daily USO reading was 25 trading days - - this caught down moves of 28% and 30% in 2008 and 14% in May to June of this year. The best short-term (under 2 weeks) optimization holding period was for 8 trading days, which was 80% accurate and included down moves of 15%, 5%, and 7% in 2008 and 6% in 2012.
Bottom line, although this is a small sample size to be sure, an extreme low Percent R reading on the daily USO charts has preceded further big moves lower in USO over various time frames up to over a month.
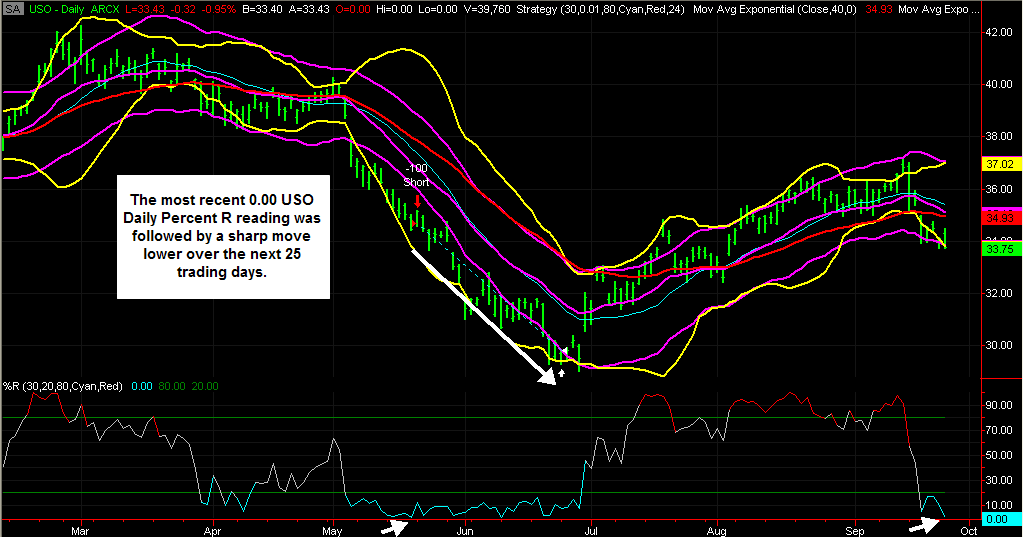
Taking a quick look at the daily chart below, you can see the big plunge in USO that occurred after the most recent 0.00 Percent R reading. Also note that USO closed barely below both its Bottom Acceleration Band (a proprietary BigTrends technical indicator) and its Bottom Bollinger Band yesterday - this often is a sign the strength of a trend when it closes outside both bands.
USO Daily Chart
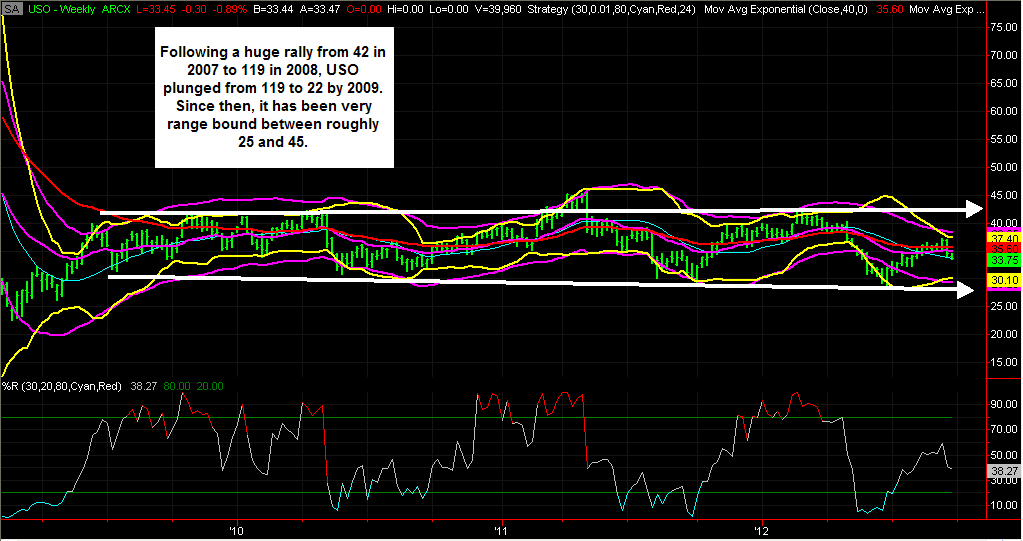
Bigger picture, Crude Oil & USO had a big, bubble-like runup from 2007 to 2008 - that rally was followed by a plunge that wiped out all the gains and more. Since then, USO has been very range bound, see the Weekly Chart below. The range has been roughly 25 to 45 from 2009 to the present.
USO Weekly Chart
With USO around 33.50 this morning, downside targets of 31.82, 30.15 and 28.48 over the next 5 to 25 trading days are derived from potential sell-off moves of 5%, 10%, and 15% if the weakness in USO continues.

Disclosure: I have no positions in any stocks mentioned, and no plans to initiate any positions within the next 72 hours. I wrote this article myself, and it expresses my own opinions. I am not receiving compensation for it. I have no business relationship with any company whose stock is mentioned in this article.