This basket strategy was last update here: Update For Regional Bank Basket As Of 9/23/15 - South Gent | Seeking Alpha
Table as of 10/2/15:
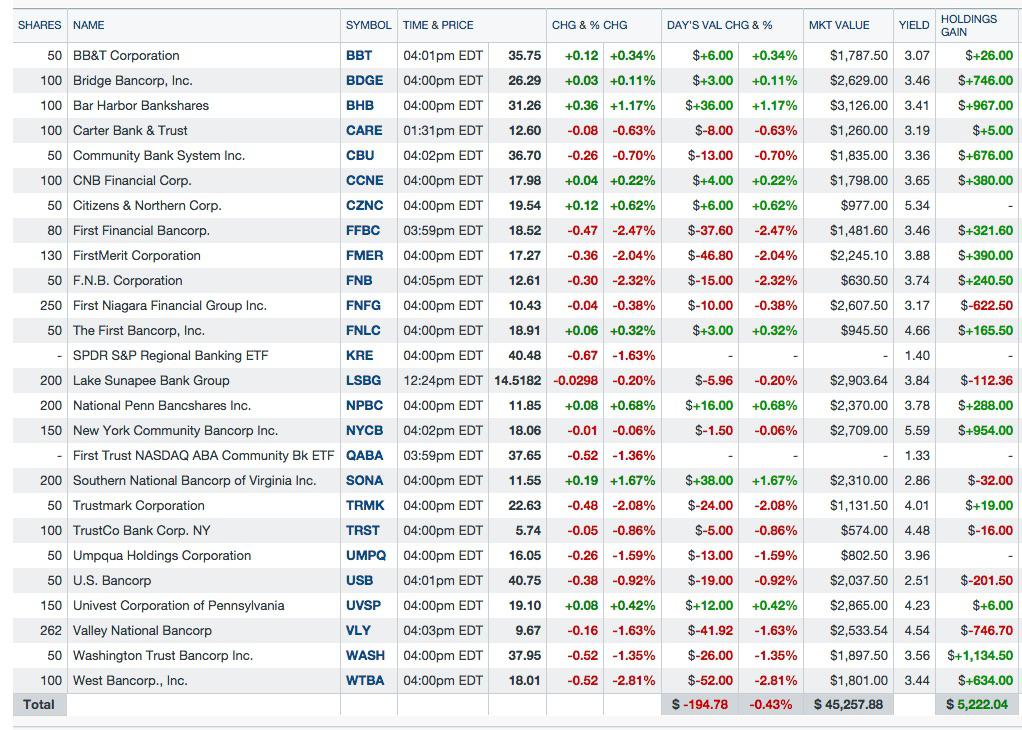
I include two ETFs in this basket's table, which I do not own, for comparison purposes. QABA is the closest ETF to my basket. I may start nibbling on some super regionals which would draw me a tad closer to KRE.
First Trust NASDAQ ABA Community Bank Index ETF (QABA)
SPDR S&P Regional Banking ETF (KRE)
I substantially outperform both of those ETFs last Friday. KRE and QABA declined by 1.63% and 1.36% respectively, while my basket was down .43%.
Regional banks are having a tough time now due to the persistent decline in interest rates. During the trading day last Friday, QABA was down over 3% as interest rates plummeted in response to a lousy jobs report.
The ten year treasury was at a 2.0529% yield as of 8:25 A.M. E.S.T.
The jobs report was released at 8:30.
At 8:35, the ten year treasury had fallen to a 1.9282% yield, which is a huge move. The low was hit near 10:00 at slightly below 1.91%. The ten year then spent the rest of the day giving back some of its gains, and stocks caught a bid. The yield at 4:55 was at 1.9929%.
Notwithstanding that decline in price and rise in yield from the intra-day low, the yield was down .06% compared to the trade just before the release of the jobs report.
The market sees now only a 33% likelihood of a FED rate hike in December, down from 60% a month ago. The probability of a January 2016 liftoff is now down to 41%. The most likely month for an increase based on the market's expectations is now March 2016.
Traders Don't See Fed Moving Until at Least March, Futures Show - Bloomberg
For regional banks, the important movement is a persistent directional trend down in rates that will continue to compress their net interest margins and impede their earnings growth.
The trend reversal in the ten year started on 6/11/15, when the previous up move in yield peaked at 2.5%: Daily Treasury Yield Curve Rates On the next day, the yield was down to 2.38%, another huge move, that signaled to me a directional change in rates.
Throughout June and into July, I sold down my regional bank basket for that reason and others as explained here: Update On Regional Bank Basket Strategy As Of 7/17/15 - South Gent | Seeking Alpha I thought that it was odd that a number of small bank stocks spiked in price after that directional change in rates.
With any basket strategy, I want to outperform on a total return basis. If I can go down less than a comparable ETF or up more, then I have added alpha through my selection process and see no reason to go with a managed or an index regional bank fund.
I also view the difference in yields between my bank stocks in my basket and those ETFs as important. The difference is significant. So, when the price appreciation for an annual period is close to those ETFs, I may outperform solely due to a higher dividend yield.
The dividend yield shown in the preceding table is calculated by Yahoo Finance based on today's closing prices. The dividend yield at my total average cost per share will be different. I currently have two banks in the basket that yield over 8% at my constant cost numbers (WASH and NYCB) and a few others that are over 5%.
My net realized gain in this basket strategy currently stands at $22,926.12. REGIONAL BANK BASKET STRATEGY GATEWAY POST Snapshots of round trip trades can be found at the end of that post. This basket has generated an annual average $1,917 in dividends over the past 3 years.
Over the life of this basket strategy, I anticipate that dividends will generate about 40% of my total return.
Why Buy a Regional Bank Stock When NIM Is Likely to Remain Under Pressure?:
I had to argue with myself after asking that question.
Displaying its normal decree of logic, objectivity, rationality and tunnel vision, Left Brain ("LB") opined that the answer was obviously no.
Right Brain ("RB") said things change, which was immediately called a Nitwit statement by LB. RB then added that the valuations are reasonable and the yields are higher than most non-pass through entity stocks. RB, who never sweats the details, did not arrive at that conclusion by doing research, but simply took out of context a recent statement by LB who had assiduously studied the matter looking into countless variables and alternative scenarios.
By things changing, I am talking about the directional move in U.S. interest rates. I am obviously not making a big bet that interest rates will go up anytime soon with the two 50 lot purchases discussed below. I am merely moving closer to my minimum out-of-pocket exposure level after slashing my exposure earlier this year.
I also know that regional bank earnings are impacted by a variety of variables. NIM is certainly important. It is also important, and this is a simple observation to make, that non-performing loans and charge-offs remain low and/or continue to trend down.
I generally focus on banks that have better than average numbers for NIM, charge-offs and non-performing loans.
Charge-Off Rate: .4% (to total loans annualized)
Nonperforming Loans (past due 90+ days plus nonaccrual) to Total Loans for all U.S. Banks: 1.69%
Net Interest Margin for all U.S. Banks: 2.97%
Those numbers are for the 2015 second quarter.
I am also seeing a slow and steady expansion of loans as charge-offs and non-performing loans trend down:
Net Percentage of Domestic Banks Tightening Standards for Prime Mortgage Loans-St. Louis Fed
Net Percentage of Domestic Banks Tightening Standards on Consumer Loans, Credit Cards-St. Louis Fed
Commercial And Industrial Loans, All Commercial Banks - St. Louis Fed
Total Consumer Credit Owned and Securitized, Outstanding- St. Louis Fed
In addition, community banks generally have a significant mortgage origination business. The rise in mortgage rates in 2013 crimped that profit center, so a rise in rates is not a one way street for these banks.
30-Year Conventional Mortgage Rate
As shown in that chart, the 30 year only went from 3.54% in May 2013 to 4.46% that December, but that was sufficient to cause mortgage originations to go down significantly for a number of banks. Both of those rates are abnormally low by historical standards.
Many will also suffer a devaluation in securities held for sale when rates rise.
1. Bought 50 CZNC at $19.52:
Trade Snapshot:

Closing Price Day of Trade (9/25): CZNC: $19.39 -0.57 (-2.86%)(52 week range $18.83 to $21.5)
Closing Price 10/2/15: CZNC: $19.54 +0.12 (+0.62%)
The market capitalization at last Friday's closing price is about $238+M.
On the day of my trade, volume was heavy at 41,542 shares compared to an average 3 month daily volume of just 16,783. The increased volume apparently was on the sell side as the share price dropped from a $20.06 high to an intra-day low of $19.38 just prior to the close. CZNC Historical Prices
I last eliminated my position at $20.71, as noted in the Appendix section below.
Company Description: The
Citizens & Northern (CZNC) is a small regional bank holding company headquartered in Wellsboro, Pennsylvania (HQ picture at Google Maps)The operating subsidiary, Citizens & Northern Bank, currently has 25 branches in PA and 1 in Steuben County, NY. Citizens and Northern Bank
Virtually all of the bank's offices are located in the Marcellus Shale region. CZNC noted that a significant portion of its lending opportunities, trust and other services were tied directly or indirectly to from Marcellus Shale related activities: Page 3 2014 Annual Report
The bank discusses risks incident to its business starting at page 3 of that Annual Report.
As noted at page 6 of that report, the bank owns all of its banking offices free and clear except for 2 locations that are leased.
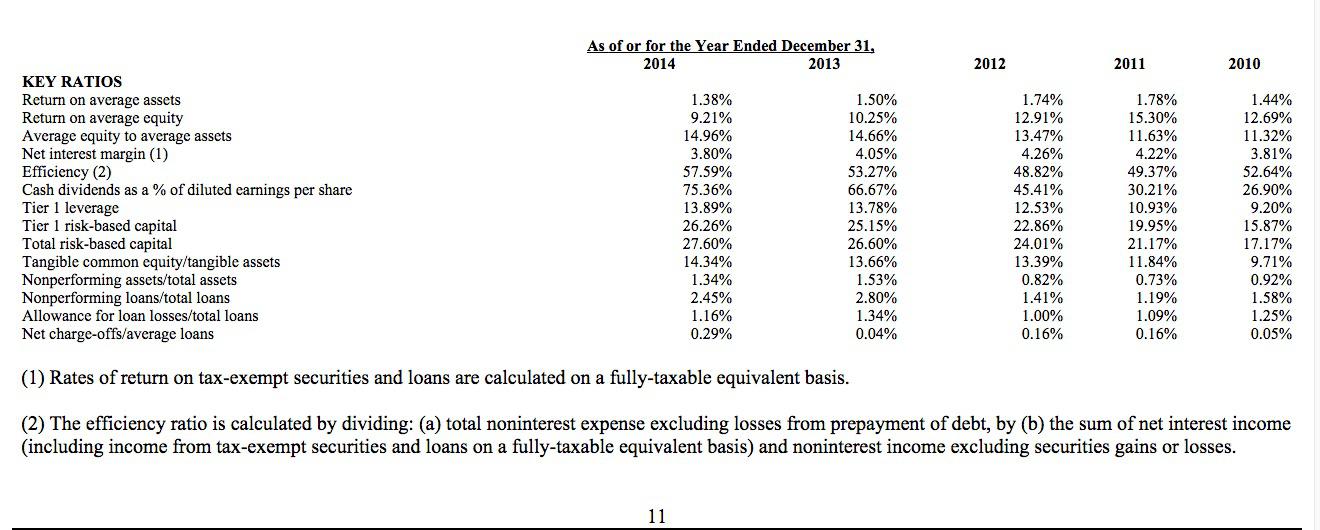
Historical Ratios:
The stock topped out at near $37 back in 2005. CZNC Interactive Stock Chart Most regional bank stocks topped in 2005 or 2006, signaling in retrospect the problems that would become obvious in 2008.
The all time closing high was hit at $37.27 (7/22/2005)
E.P.S. started to decelerate for this bank after it reported an E.P.S. of $1.53 in 2005. 2009 Annual Report at page 12. A large loss of $4.4 per share was reported in 2009. That loss was triggered by an after tax impairment charge of $55.849M in securities held for sale. In other words, the loss was caused primarily by bad investment decisions rather than loan decisions. The biggest problem was in something called "pooled trust preferred securities-mezzanine tranches" (page 14). This issue highlights just one of the many things that can go wrong at a bank. I did not follow up on what happened to those securities in the following years. This write-down in 2009 reduced the value by $73.674M bringing the cost basis down to $11.383M.
Even a prudent bank will suffer an increase in loan losses during a recession. The ones making improvident loans will generally be exposed during those economic downturns, with many being seized by the FDIC.
CITIZENS AND NORTHERN BANK Review: 4 Star Rating Bankrate.com
Dividends: This bank did slash its dividend rate starting in the 2010 first quarter, going from $.24 per share to $.08 and then started to gradually raise it again to the current rate of $.26 per share or $1.04 annually. Dividend cuts are always a distinct possibility for banks during or soon after a recession.
Citizens & Northern Corp (CZNC) Dividend HistoryEffective for the 2014 first quarter, CZNC raised its quarterly dividend to $.26 per share from $.25.
At the current rate, the dividend yield is about 5.33% at a total cost of $19.52 per share.
The last dividend was paid on 8/14: Press Release
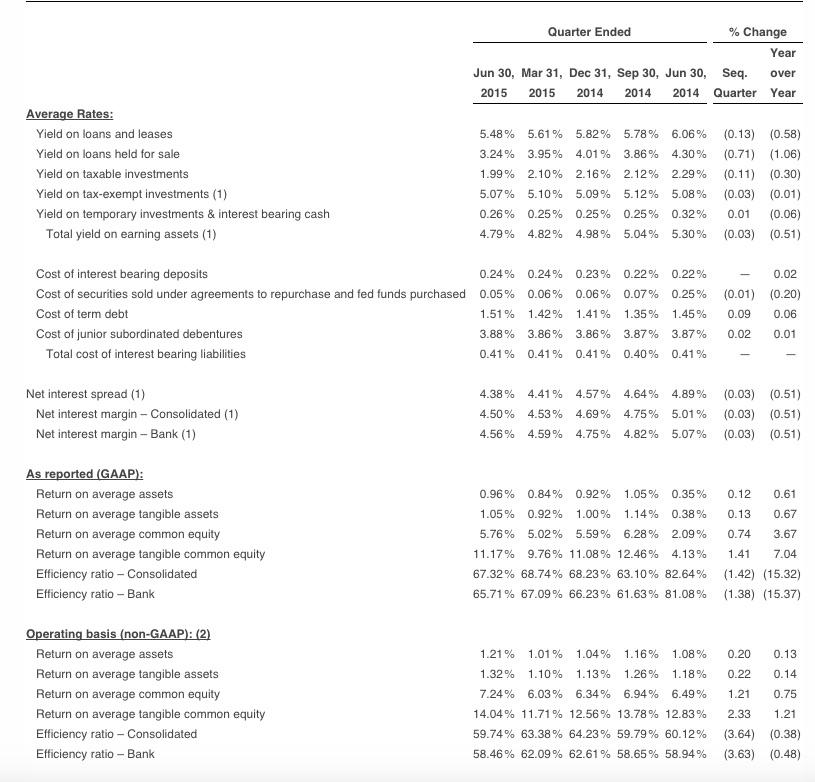
Recent Earnings Report: For the 2015 second quarter, CZNC reported net income of $.36 per share up from $.33 in the 2014 second quarter. For the first six months, return on average assets was reported at 1.21% and ROE was at 8.66%.
NIM declined to 3.74% from 3.84% in the 2014 second quarter.
"The decrease in margin in 2015 has resulted from reductions in yields on earning assets, mainly loans and available-for-sale securities, accompanied by a smaller decrease in average rates paid on deposits and borrowed funds." That is a common problem.
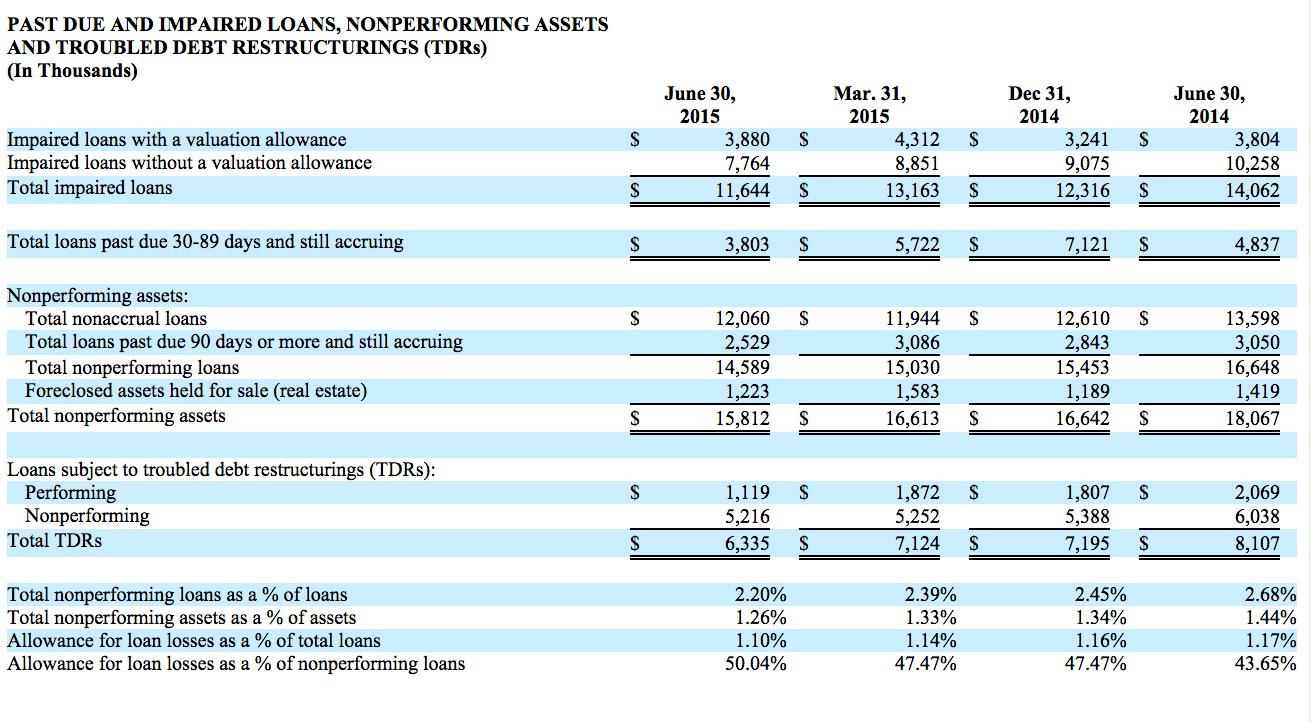
Non-performing loans are trending down, but are still high by my standards:
The capital ratios are excellent:
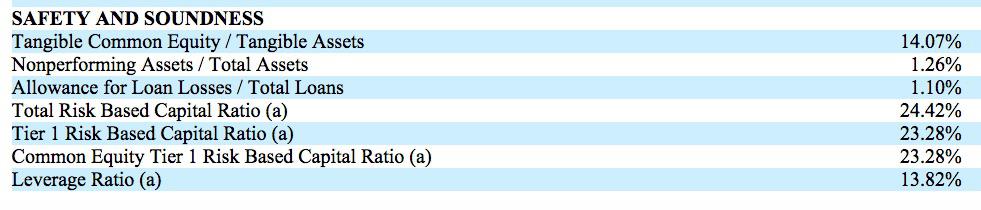
Sourced: Supplemental Information and SEC Filed Press Release
Tangible common share book value was $14.35 per share. Book value was reported at $15.33 per share.
The TTM P/E based on the $19.39 price was 14.18. The forward P/E based on the was 13.65: CZNC Key Statistics I view those multiples to be at the high end of a fair valuation range for this bank.
Only one analyst provides earnings estimates. That analyst has an E.P.S. estimate of $1.39 this year and $1.42 next year. The bank will need to do better than a 2.16% growth rate.
BBT has recently acquired one PA based bank, Susquehanna, and has offered to acquire another (National Penn). I owned both of those banks when BBT made the acquisition announcement. I still own NPBC shares.
Rationale: So far, I have been successful at harvesting CZNC's dividend and realizing trading gains. I view a 8% to 10% total annualized return to be a good one considering the likely total returns of the SPX over the next five to ten years. A good part of that annualized total return can be captured solely with the dividend yield.
Links to discussions of prior trades can be found in the Appendix section below.
2. Bought 50 UMPQ at $16.49:
Trade Snapshot ($1 Commission)

Closing Price Day of Trade (9/25/15): UMPQ: $16.45 -0.09 (-0.54%)(trading range $16.42 to $16.89; 52 week range $14.7 to $18.92)
Company Description:
Umpqua Holdings (UMPQ) is a bank holding company whose headquarters is located in Portland, Oregon and conducts its banking operations through its wholly owned subsidiary Umpqua Bank."Umpqua Bank has locations across Idaho, Washington, Oregon, California and Northern Nevada." Umpqua Bank Umpqua makes it extremely difficult to ascertain the exact number of branch locations. My best guess is 342 branches in 4 states based on this website's compilation: Umpqua Bank Locations
The bank has grown through a series of acquisitions over the years: Mergers and Acquisitions The last acquisition was Sterling Financial Corporation that cost $1.951 billion in stock and $137M in cash. Sterling had its headquarters in Spokane, Washington with branches in Washington, Oregon, and Idaho. Sterling had $10.32B in assets and 173 branches as of 12/31/13: 12-2013 10-K
Umpqua Holdings Corporation and Sterling Financial Corporation Complete Merger (4/19/14 Press Release)
Umpqua did participate in TARP. Early in 2010, the bank purchased all of the government's preferred stock and bought back the government's stock warrants. (page 154, Form 10-K). The bank raised the necessary funds by selling 8.625M shares at $11. The bank raised $258.7M through a public offering of shares priced at $9.75.
The company discusses risks incident to its operations starting at page 18 of its 2014 Annual Report: UMPQ-2014.12.31-10K
Market share by county can be found starting at page 8 of that Annual Report.
SEC Filed Second Quarter Presentation
UMPQUA BANK Review: 4 Stars from Bankrate.com
Chart: A long term chart reveals a good run from around $7.5 (11/2000) to a top near $31 (November/2006). The prices of many regional bank stocks started to decline in 2006-2007 after hitting peaks during 2005 or 2006, which in retrospect signaled troubled ahead.
As shown in a five year chart, the price has been meandering up and down in a relatively tight range, mostly in the $16 to $19 range.
Dividend: Umpqua is currently paying a quarterly dividend of $.16 per share or $.64 annually:
Umpqua Holdings Corporation (UMPQ) Dividend Date & HistoryAt that quarterly rate, the dividend yield is about 3.88% at a total cost per share of $16.49.
Like many banks during the go-go years for regional banks, UMPQ was raising its dividend from 1993 to 2008. The quarterly rate was $.013 in 1995 and had reached 19 cents during the 2007 third quarter, staying at 19 cents until the 2008 third quarter when it was slashed to 5 cents. The bank raised the five cent quarterly dividend to 7 cents in the 2011 third quarter. The next increase was to $.09 and then to 15 cents which remained in effect for 10 quarters.
Investor Relations: Dividend History
One reason for considering a purchase was that Umpqua recently broke that 10 quarter $.15 penny rate with a 1 cent raise. Umpqua Holdings Raises Quarterly Dividend (9/15/15 Press Release)
The stock went ex-dividend for its quarterly distribution on 9/28 and I will receive that dividend.
Prior Trade: I have had two prior trades and one of those was in my Lottery Ticket Basket Strategy which is no longer being updated anywhere.
LT Purchase: Item # 6 Bought 30 UMPQ as LT at $11.53 (5/4/11 Post)-Item # 2 Sold 30 UMPQ at $13.33 (snapshot of gain=$38.09)
Sold 50 UMPQ at $16.12 (7/23/13 Post)(profit snapshot=$187.58)-Item # 2 Bought 50 UMPQ at $12.05 (10/22/2012 Post)
Total To Date Trading Profit=$225.67
Recent Earnings Report: Another reasons for buying back some shares was that the second quarter earnings report was decent. Net income available to common shareholders was reported at $54.7M or $.25 per share, up from $.21 in the first quarter and $.09 in the 2014 second quarter.
The NIM is well above the average for U.S. banks, though the efficiency ratio is too high and the ROE is suboptimal as well (ROTE is fine however):
The company is buying back stock:
"During the second quarter of 2015, the Company repurchased 360,000 shares of common stock, for a total of $6.4 million. The Company may repurchase up to 11.7 million of additional shares under the current stock repurchase plan, which was recently extended to July 31, 2017 by the Company's Board of Directors."
The capital ratios are fine:
"Based on Basel III rules, as of June 30, 2015, the Company's estimated total risk-based capital ratio was 14.4% and its estimated Tier 1 common to risk weighted assets ratio was 11.0%, as compared to 14.6% and 11.1%, respectively, as of March 31, 2015. The Company remains well above current "well-capitalized" regulatory minimums."
The acquisition of Sterling is apparently yielding the anticipated cost synergies:
"The Company remains on track with the integration of Sterling, with cost synergies progressing towards the previously announced target of $87 million (annualized), which is expected to be realized over the next several months."
All of the following numbers are excellent:
| Loans and leases past due 31-89 days to total loans and leases=.16%
| |||||||||||||||||||
Sourced: Umpqua Reports Second Quarter 2015 Results
++++++++++++++++
Appendix:
Citizens & Northern (CZNC) Prior Trades and Discussions:
Satellite Taxable Account: 100 Shares +$517.61

Item # 1 Sold 100 CZNC at $16.53 (9/2/11 Post)-Item # 1 Added 50 CZNC at $10.46 (8/17/2010 Post) and Item # 1 Bought 50 CZNC at $11.77 (8/12/2010 Post)
Satellite Taxable Account: 100 Shares +$48.5

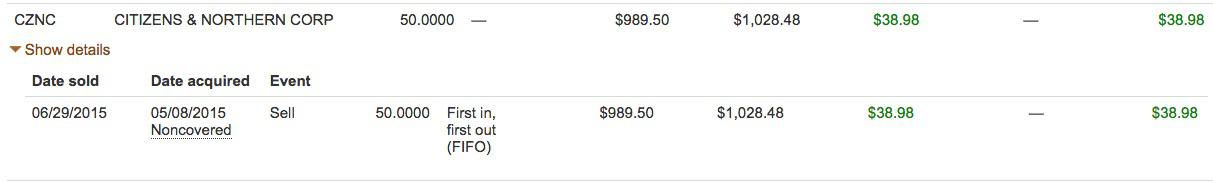
Sold 100 CZNE at $19.52 (8/25/14 Post)-Item # 3 Bought 50 CZNC at $19.15 (6/29/13 Post) and Item # 7 Bought 50 CZNC at $18.5 (5/17/14 Post)
I had one 50 share flip in a Roth IRA earlier this year=+$38.08
I also had a 100 share flip in a satellite taxable account: +$81.97

Both the 50 and 100 share lots were sold at $20.71, which is viewed as the upper end of a fair valuation for this stock:


CZNC Total Trading Profits = +$686.16
Disclaimer: I am not a financial advisor but simply an individual investor who has been managing my own money since I was a teenager. In this post, I am acting solely as a financial journalist focusing on my own investments. The information contained in this post is not intended to be a complete description or summary of all available data relevant to making an investment decision. Instead, I am merely expressing some of the reasons underlying the purchase or sell of securities. Nothing in this post is intended to constitute investment or legal advice or a recommendation to buy or to sell. All investors need to perform their own due diligence before making any financial decision which requires at a minimum reading original source material available at the SEC and elsewhere. A failure to perform due diligence only increases what I call "error creep". Stocks, Bonds & Politics:ERROR CREEP and the INVESTING PROCESS. Each investor needs to assess a potential investment taking into account their personal risk tolerances, goals and situational risks. I can only make that kind of assessment for myself and family members.