Fractality at work. Narrow ranges tend to contain narrow secondary reactions
This post is to be understood as an "addenda" to my yesterday's post.
I feel the following thoughts further strengthen my belief concerning the sturdiness of the Schannep's Dow Theory under narrow range conditions. Thus, the losses resulting from a prolonged ranging environment could be even smaller than I thought due to a very particular built-in feature of the Dow Theory. Now please be attentive.
While narrow range conditions are headwind for the Dow Theory, it is likely that the secondary reactions which lead to the buy and sell signals, will be closer to the respective bottom (buy) and top (sell) than the secondary reaction that develop under more trending markets. Narrow ranges tend to beget compressed secondary reactions. When markets are not range bound, not compressed, secondary reactions tend to be of a greater extent (i.e. 10-14%). On the other hand, narrow ranges tend to result in narrower secondary reactions, which imply that our entries and exits will tend to be closer to their respective bottoms and tops. In other words, my profiling of the likely profit or loss depending on the extent of the specific range which was based on the average percentage lost from the respective bottom and top when getting in and out could be kind of pessimist under narrow range conditions. This is good news, as this implies that under narrow range conditions, losses are likely to be somewhat smaller (and there even is the possibility of modest wins).
My original table was made under the assumption that the average entry was ca. 7-8% off the bottom and the average exit was ca. 7-8 off the top. Subtract from the percentage range the amounts lost when entering and exiting and you get the hypothetical profit or loss for the trade.
However, what would happen if the very narrow range condition would also make narrower the secondary reactions that setup stocks for the entry and exit signals? Then our entries and exits would be at a shorter distance from the bottom and the tops which would result in even more modest losses and even increases the possibility of modest wins.
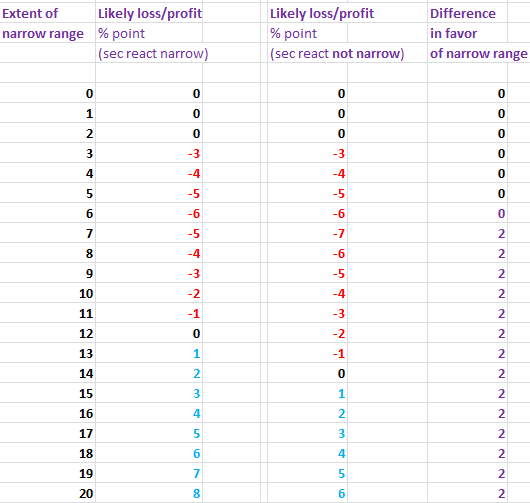
I have produced a new table, which assumes (quite accurately based on my chart observations) that under narrow ranges, the secondary reactions leading to the signals will also be "narrow". I have made the numbers assuming secondary reactions of just 6%, which would result in entries and exits at ca. 6% off the respective bottoms and tops. The new table contains in the first place the new calculations. Next to the narrow range calculations you will find the original calculations (exits/entries at ca. 7-8% from the top/bottom). Finally, on the right side, you can see the difference between the two assumptions (secondary reaction contraction versus no contraction). As you can see, in many instances, our losses are likely to be 2% points smaller when secondary reactions are of just 6% instead of the average 7-8%. When winning, we are likely to win ca. 2% points more.
Here you have the table
 | |
| Narrow range conditions are likely to result in narrower secondary reactions and hence entries and exits closer to their respective bottom and tops. As a consequences, losses (on average) are likely to be even more modest than those seen under normal market conditions |
Please mind that nothing is carved in stone. And in any given trade anything may and will happen. However, it could even be that if we were to experience a very long period of narrow ranges losses could be even smaller than those I estimated in my last post.
In any instance, this is a good thought exercise, necessary for those really intent on mastering the Dow Theory.
A real life example of my musings is the trade started on October 7, 2015 and was closed on December 11, 2015. It had a specific range from bottom to top of 12.7%. The secondary reaction that led to the entry had a magnitude of ca. 6.9%, which is below the average 7.4% determined by Schannep. This means that the entry of October 7 was at just 6.9% above the primary bear market lows of August 2015. The exit of December 11, 2015 was only 4.01% below the top, which is much less than the average 7.7% determined by Schannep. Hence we can do some math:
Total swing = 12.7%
Lost in entry = -6.9%
Lost in exit = -4.01 %
Total theoretical profit = 1.79%. The real profit was of only 1.23%, as the close of the day of entry and the close of the day of exit do not have to exactly match the relevant closing highs or lows.
(all figures have been calculated using the SPY)
Here you have the chart:
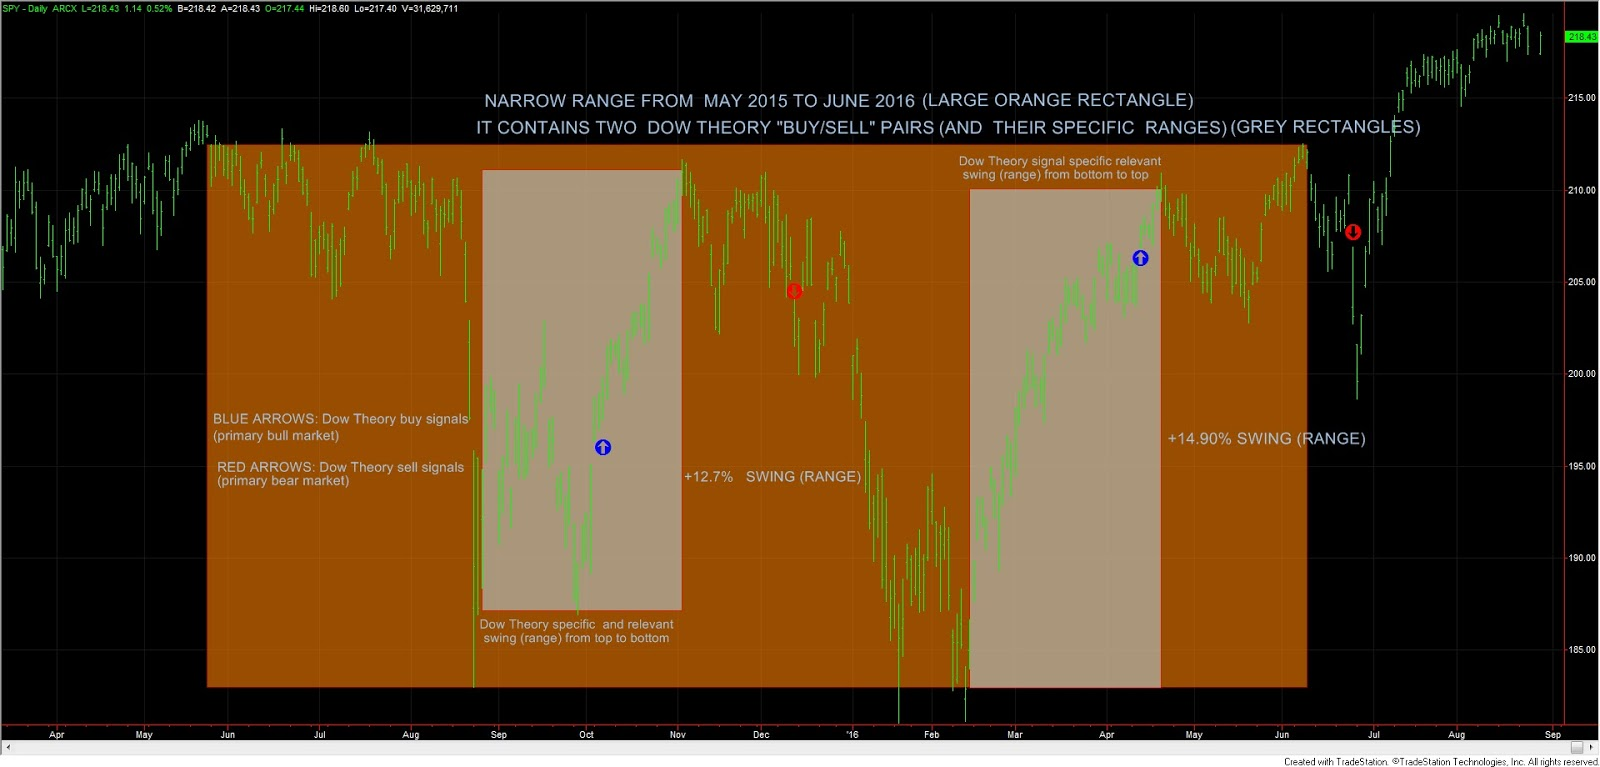 |
| Two trade-specific narrow ranges (grey) engulfed by an overall narrow range (orange) |
In other words, the narrow range condition implies a thrifty market which offers poor profit perspectives even if we were able to achieve the impossible: perfect timing of the bottom and the top (in this case, even armed with omniscience, we could only have made 12.7%). However, as a kind of "law of compensation", narrow ranges, which imply low volatility scenarios, also tend to result in secondary reactions of modest proportions. Thus, it looks as if the market were tellings us "look there are only 12.7% swing points to be made even by omniscient beings who perfectly time the bottom and the top; however, I will be kind to you, mere mortal, and not only ranges will be narrow but also the secondary reactions which set up your buy and sell signals so that you don't lose so much money and even could make some".
While this will not occur in all trading ranges, in many instances, there will be a partial (not total) trade off. What we cannot win due to a very short swing (normal swings are in the vicinity of 35% on average), is partially offset by less percentage points lost when entering and exiting the trade.
Here you see another outstanding feature of the Dow Theory, which, by the way is exclusive of Schannep's Dow Theory (a future post will explain why the "classical" as it is applied by most Dow Theorists requiring at least 1/3 retracement, is not so well protected under trading ranges. It would flash less signals, but in many cases entries and even exits would be signaled not so close from the respective bottoms and tops).
What about the trade started on April 13, 2016 and closed on June 24th, 2016? It had a range of 14.90% (please look the at grey rectangle on the right side of the chart above). The entry was 13.16% off the closing lows (a bad one), as the secondary reaction that emerged from the primary bear market lows of February 11, 2016 (for the SPY) was indeed powerful. However, once the top was made, the secondary reaction that followed was, once again of modest proportions. The SPY did only recede -2.81% from the top. By the way, it did qualify as a secondary reaction, as the "extent" requirement of minimum 3% was met by both the Transports and the Industrials, and as I explained in depth here, we got the setup that lead to the sell signal of June 24th, 2016.
By the way, this trade was a real life stress-test, as due to the Brexit, there was a huge gapping down, and the "sell" signal of June 24th has signaled at 199.6 whereas the SPY secondary reaction lows of May 9th, 2016 stood at 204.20. Thus the highly unusual gapping down action resulted in an additional "gap-caused" loss of -2.25%, which an odd occurence. The total percentage lost from top to bottom was 6.01% (unconfirmed top made by the SPY on June 8th, 2016 and exit signaled on June 24th at 199.6). Thus, even under a Brexit, big gap scenario, we can see that:
- The total percentage lost from top to bottom was less that the average 7.7%. More exactly 1.69% points less. Thus, even with Brexit gap included our exit was at a quite close distance from the top.
- Without gap our loss from top to exit would have been of ca. 6.01 - 2.25 = 3.76%, which would have been a very close distance from the top.
For those skeptical, please take a look at historical charts and you will see that more often than not, narrow ranges, imply narrow secondary reactions, and hence, less points lost when entering and exiting.
The takeaway is clear: In many narrow range instances, the secondary reactions leading to the buy and sell setups will be of a lesser magnitude than those seen when the market is trending and not ranging. I see some fractality (see Mandelbrot's "The Misbehavior of Markets"), a sense of proportion. An overall narrow range tends to be made of proportionally narrower secondary reactions. Thus, there is a tendency to compensate. Faced with the impossibility of making big profits due to a narrow range, the distance at which we enter and exit a trade will tend to be accordingly shortened. Losses (for each trade) and drawdowns (for a long string of trades) are thus likely to be even smaller than those analyzed in my previous post (of course, on average, after several trades; as in any specific trade anything can happen). In any instance, be it with compressed secondary reactions or with normal ones, Schannep's Dow Theory is likely to survive even long periods of narrow ranges and listless markets.
Sincerely,
The Dow Theorist