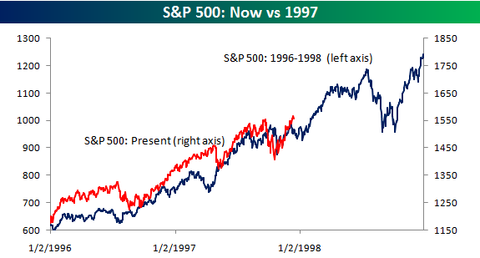
There seem to be endless comparisons between the current market environment and prior periods. Last year, there were several comparisons between now and 1995, a year that also followed an extended period of Fed rate hikes. A few weeks ago as the market seemed to be in a free fall, the two most popular comparisons were 1987 and 1998. Even today, CNBC had a story highlighting that Merrill Lynch compares the current period with 1989 because both periods followed a real estate boom and above average M&A activity.
One comparison we have not seen is now versus the period leading up to the Asia Crisis in 1997. One major similarity between both periods is that the S&P 500 went an extended time without a correction of 10%. Prior to the correction in October 1997, the S&P 500 had gone almost seven years without a decline of 10%. Using intraday prices, during the current period the S&P 500 went nearly five years without a 10% correction.
Below we have overlaid the S&P 500 in the current period on the 1996/1997 price chart using the peak closes prior to each period's 10% correction as the pivot point. As the chart shows, the patterns between the two are very similar. In fact, the correlation between both periods is 0.94.
