Only stocks that fulfilled most of the suggested criteria were included on this list. The criteria used can be accessed here: "Our suggested guidelines when searching for new investment ideas." These are not absolute rules but suggestions to get the novice investor started. The criteria can be adjusted to suit your own specific style of trading.
Reasons to be bullish on General Electric (NYSE:GE)
- It has extremely strong levered free cash flow of $43.3 billion
- A beta of 1.57 which makes it a good candidate for covered writes or for selling puts if one is bullish on the stock
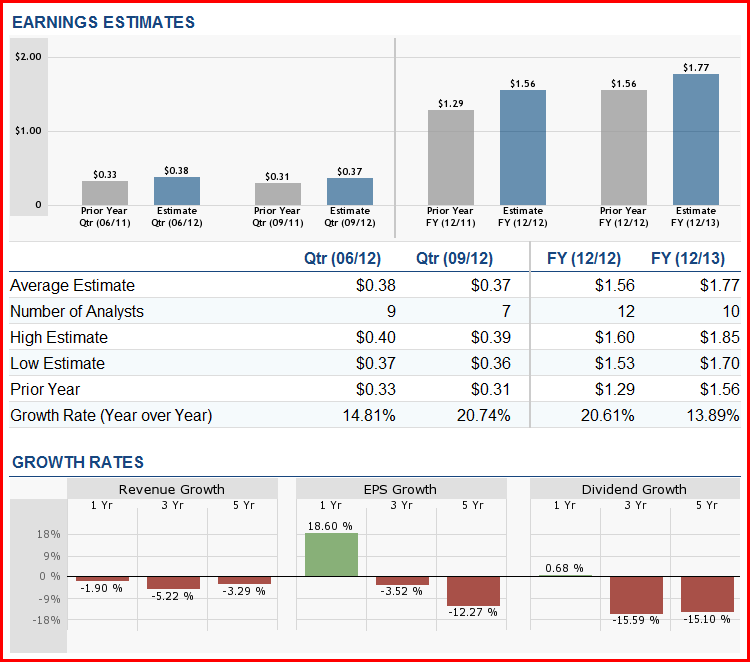
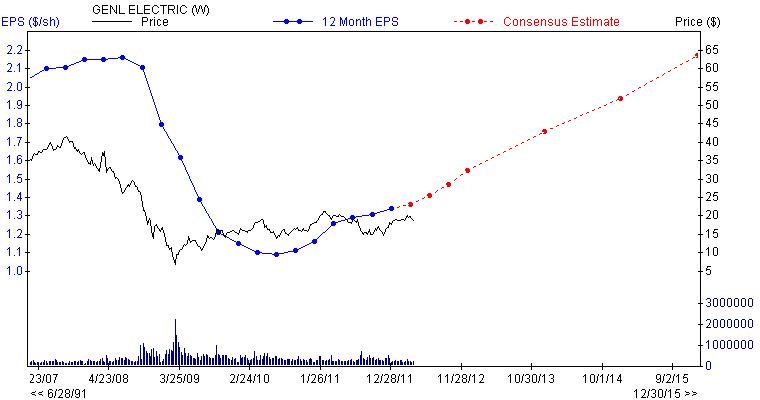
- Year over year projected growth rates of 20% and 13% for 2012 and 2013 respectively
- A decent yield of 3.7%
- A good current ratio of 2.5
- Net income increased from $11 billion in 2009 to $14 billion in 2011
- EBITDA increased from $38 billion in 2009 to $43 billion in 2011
- Cash flow per share increased from $2.18 in 2009 to $2.27 in 2011
- Annual EPS before NRI increased from $1.16 in 2009 to $1.29 in 2011
- A good payout ratio of 51%
- A 3-5 year projected EPS growth rate of 12.2%
- A good quick ratio of 2.43
- A decent interest coverage ratio of 2.41
- A decent return of 53% for the past three years
- It has been paying dividends since 1889.
Suggested strategy
We would divide the money into 2-3 lots and deploy one lot at a time. The first lot could be deployed on a test of 17.00, and another lot could be deployed if it trades down to 15.50. A better option would be to wait for it to test 17 and then one could sell puts at strikes one would not mind owning the stock at. For example, in the 15.00-16.00 ranges. If the stock trades below the strike price you be assigned shares in General Electric. If the stock does not trade below the strike price, you get to keep the premium, which could be applied toward your purchase price at some future date. General Electric is worth getting into if the above strategy is employed as the risk factor is lowered and to some degree the risk to reward ratio moves in favor of the investor.
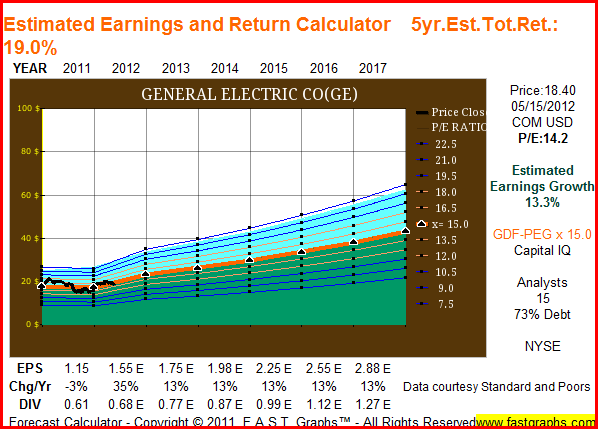
Company: General Electric
Levered free cash flow = $43.3 billion
Growth
- Net Income ($mil) 12/2011 = 14151
- Net Income ($mil) 12/2010 = 11644
- Net Income ($mil) 12/2009 = 11025
- EBITDA ($mil) 12/2011 = 43828
- EBITDA ($mil) 12/2010 = 39424
- EBITDA ($mil) 12/2009 = 38178
- Cash Flow ($/share) 12/2011 = 2.27
- Cash Flow ($/share) 12/2010 = 2.1
- Cash Flow ($/share) 12/2009 = 2.18
- Sales ($mil) 12/2011 = 147300
- Sales ($mil) 12/2010 = 150211
- Sales ($mil) 12/2009 = 156783
- Annual EPS before NRI 12/2009 = 1.16
- Annual EPS before NRI 12/2010 = 1.15
- Annual EPS before NRI 12/2011 = 1.29
Dividend history
- Dividend Yield = 3.6
- Dividend Yield 5 Year Average 12/2011 = 4.03
- Dividend 5 year Growth 12/2011 = -18.12
Dividend sustainability
- Payout Ratio 06/2011 = 0.51
- Payout Ratio 5 Year Average 12/2011 = 0.49
Performance
- Next 3-5 Year Estimate EPS Growth rate = 12.2
- EPS Growth Quarterly(1)/Q(-3) = -125.81
- ROE 5 Year Average 12/2011 = 13.92
- Current Ratio 06/2011 = 2.5
- Current Ratio 5 Year Average = 2.25
- Quick Ratio = 2.43
- Cash Ratio = 0.73
- Interest Coverage Quarterly = 2.41
Other interesting companies
For investors looking for other investment ideas, detailed data has been provided on four additional companies. Additionally, investors can draw some ideas from our latest article - Is It Worth Getting Aboard The Starbucks Train?
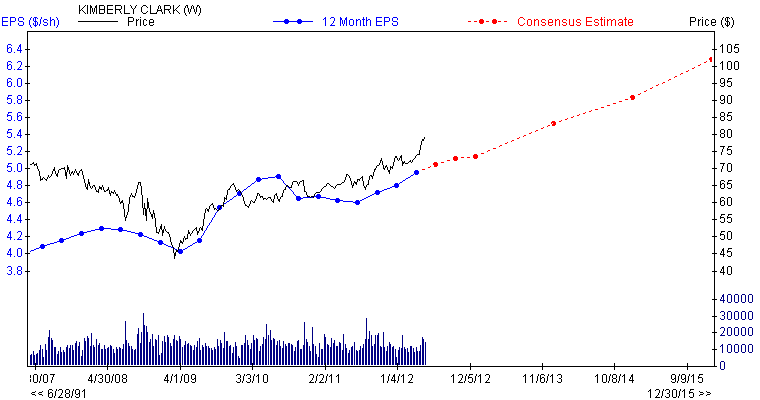
Company: Kimberly Clark (KMB)
Levered free cash flow = $1.95 billion.
Growth
- Net Income ($mil) 12/2011 = 1591
- Net Income ($mil) 12/2010 = 1843
- Net Income ($mil) 12/2009 = 1884
- EBITDA ($mil) 12/2011 = 3551
- EBITDA ($mil) 12/2010 = 3606
- EBITDA ($mil) 12/2009 = 3634
- Cash Flow ($/share) 12/2011 = 7.63
- Cash Flow ($/share) 12/2010 = 6.75
- Cash Flow ($/share) 12/2009 = 6.62
- Sales ($mil) 12/2011 = 20846
- Sales ($mil) 12/2010 = 19746
- Sales ($mil) 12/2009 = 19115
- Annual EPS before NRI 12/2007 = 4.24
- Annual EPS before NRI 12/2008 = 4.06
- Annual EPS before NRI 12/2009 = 4.72
- Annual EPS before NRI 12/2010 = 4.68
- Annual EPS before NRI 12/2011 = 4.8
Dividend history
- Dividend Yield = 3.7
- Dividend Yield 5 Year Average 12/2011 = 3.8
- Dividend 5 year Growth 12/2011 = 7.3
Dividend sustainability
- Payout Ratio 06/2011 = 0.58
- Payout Ratio 5 Year Average 12/2011 = 0.55
Performance
- Next 3-5 Year Estimate EPS Growth rate = 6.55
- EPS Growth Quarterly(1)/Q(-3) = -117.43
- ROE 5 Year Average 12/2011 = 34.66
- Current Ratio 06/2011 = 1.16
- Current Ratio 5 Year Average = 1.16
- Quick Ratio = 0.73
- Cash Ratio = 0.25
- Interest Coverage Quarterly = 8.56
Company: Noble Energy (NBL)
Growth
- Net Income ($mil) 12/2011 = 453
- Net Income ($mil) 12/2010 = 725
- Net Income ($mil) 12/2009 = -131
- EBITDA ($mil) 12/2011 = 1745
- EBITDA ($mil) 12/2010 = 1986
- 52
- Cash Flow ($/share) 12/2011 = 10.83
- Cash Flow ($/share) 12/2010 = 9.3
- Cash Flow ($/share) 12/2009 = 8.11
- Sales ($mil) 12/2011 = 3763
- Sales ($mil) 12/2010 = 3022
- Sales ($mil) 12/2009 = 2313
- Annual EPS before NRI 12/2009 = 3.37
- Annual EPS before NRI 12/2010 = 4.22
- Annual EPS before NRI 12/2011 = 5.31
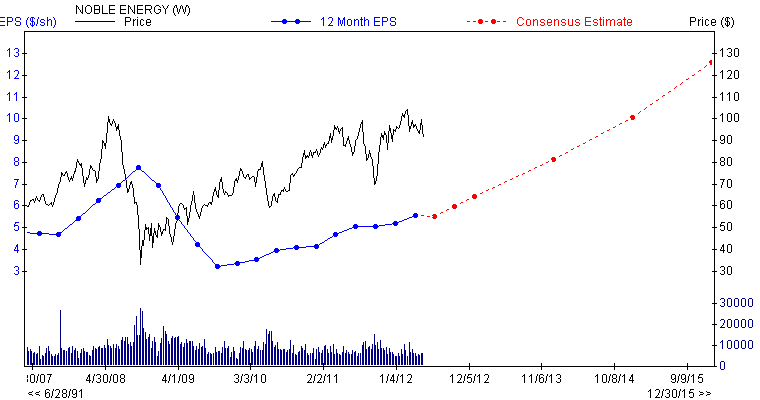
Dividend history
- Dividend Yield = 1.00
- Dividend Yield 5 Year Average 12/2011 = 0.96
- Dividend 5 year Growth 12/2011 = 11.5
Dividend sustainability
- Payout Ratio 09/2011 = 0.16
- Payout Ratio 5 Year Average 12/2011 = 0.15
- Change in Payout Ratio = 0.01
Performance
- Percentage Change Price 52 Weeks Relative to S&P 500 = 6.15
- Next 3-5 Year Estimate EPS Growth rate = 25.04
- EPS Growth Quarterly(1)/Q(-3) = -129.63
- 5 Year History EPS Growth 12/2011 = -4.36
- ROE 5 Year Average 12/2011 = 15.8
- Current Ratio 12/2011 = 0.99
- Current Ratio 5 Year Average = 1.39
- Quick Ratio = 1.07
- Cash Ratio = 0.72
- Interest Coverage Quarterly = 12.69
Company: Kodiak Oil and Gas (KOG)
Growth
- Net Income ($mil) 12/2011 = 4
- Net Income ($mil) 12/2010 = -2
- Net Income ($mil) 12/2009 = -3
- EBITDA ($mil) 12/2011 = 51
- EBITDA ($mil) 12/2010 = 6
- EBITDA ($mil) 12/2009 = 1
- Cash Flow ($/share) 12/2011 = 0.32
- Cash Flow ($/share) 12/2010 = 0.07
- Cash Flow ($/share) 12/2009 = 0.01
- Sales ($mil) 12/2011 = 120
- Sales ($mil) 12/2010 = 25
- Sales ($mil) 12/2009 = 11
- Annual EPS before NRI 12/2007 = -0.05
- Annual EPS before NRI 12/2008 = -0.1
- Annual EPS before NRI 12/2009 = -0.02
- Annual EPS before NRI 12/2010 = 0.03
- Annual EPS before NRI 12/2011 = 0.17
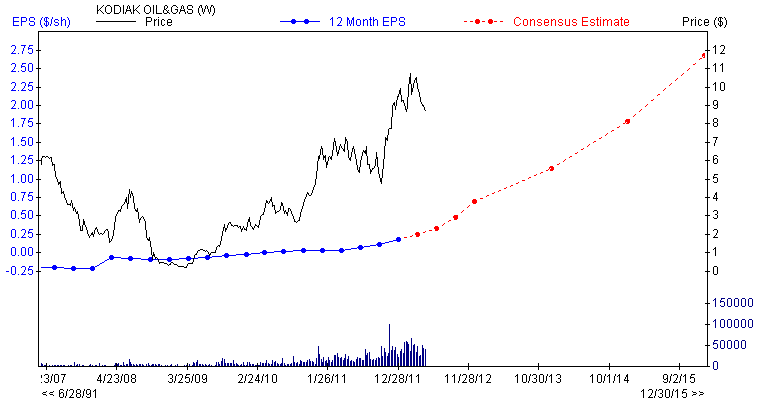
Performance
- Next 3-5 Year Estimate EPS Growth rate = 50
- EPS Growth Quarterly(1)/Q(-3) = 5-100.00
- ROE 5 Year Average 12/2011 = -7.06
- Current Ratio 06/2011 = 1.76
- Current Ratio 5 Year Average = 3.93
- Quick Ratio = 1.5
- Cash Ratio = 0.98
Company: Nexen Inc (NXY)
Levered Free Cash Flow = $641 million
Growth
- Net Income ($mil) 12/2011 = 705
- Net Income ($mil) 12/2010 = 1162
- Net Income ($mil) 12/2009 = 489
- Cash Flow ($/share) 12/2011 = 5.19
- Cash Flow ($/share) 12/2010 = 4.13
- Cash Flow ($/share) 12/2009 = 0.98
- Sales ($mil) 12/2011 = 6483
- Sales ($mil) 12/2010 = 5657
- Sales ($mil) 12/2009 = 5556
- Annual EPS before NRI 12/2009 = 0.97
- Annual EPS before NRI 12/2010 = 1.05
- Annual EPS before NRI 12/2011 = 1.47
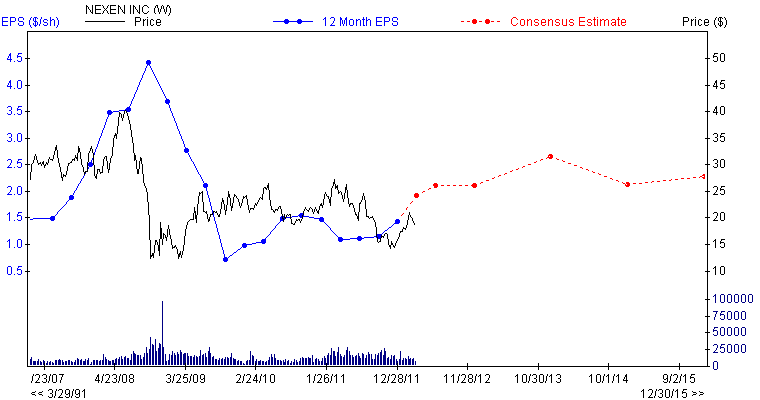
Dividend history
- Dividend Yield = 1.2
- Dividend Yield 5 Year Average =0.8%
- 5 year dividend growth rate= 21.7%
Dividend sustainability
- Payout Ratio 06/2011 = 0.14
- Payout Ratio 5 Year Average 06/2011 = 0.11
Performance
- Next 3-5 Year Estimate EPS Growth rate = 7
- EPS Growth Quarterly(1)/Q(-3) = -170
- ROE 5 Year Average 06/2011 = 17.26
- Current Ratio 06/2011 = 1.08
- Current Ratio 5 Year Average = 1.36
- Quick Ratio = 0.98
- Cash Ratio = 0.33
- Interest Coverage =7.9
Conclusion
The correction is not over and the charts are indicating that the second quarter is going to be volatile in nature. Long-term investors can use strong pullbacks to slowly start deploying money into long-term investments. A great way to get into a stock at a price of your choosing is to sell puts at strikes you would not mind owning the stock at. Investors looking for other investment ideas might find these two articles to be of interest - Is Citigroup A Good Long-Term Investment? and Is It Worth Getting Aboard The Starbucks Train?
Disclaimer
This list of stocks is meant to serve as a starting point. Please do not treat this as a buying list. It is imperative that you do your due diligence and then determine if any of the above plays meet with your risk tolerance levels. The Latin maxim caveat emptor applies let the buyer beware.
Disclosure: I have no positions in any stocks mentioned, and no plans to initiate any positions within the next 72 hours.
Additional disclosure: EPS and Price Vs industry charts obtained from zacks.com. A major portion of the historical data used in this article was obtained from zacks.com. Earnings and growth estimate data sourced from dailyfinance.com.