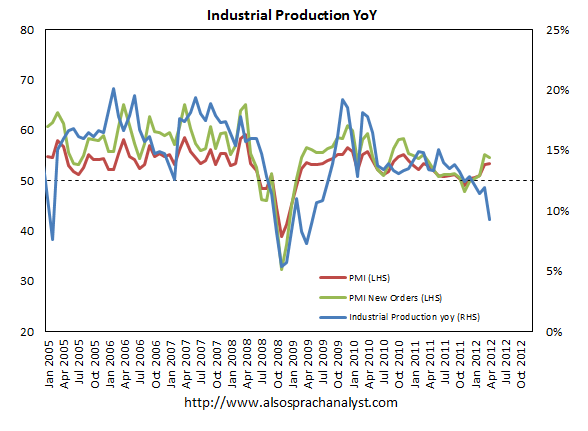
In the last week of August, Marc Faber gave a signal that all is not well in China. He points out that some of the Chinese statistics, like 7.7% GDP growth, are inflated to the upside. There is a big chance of a hard landing in China because many statistics point to a significant slowing of the Chinese economy. For example, in July, industrial production declined sharply (see Chart 1).
Click to enlarge images.
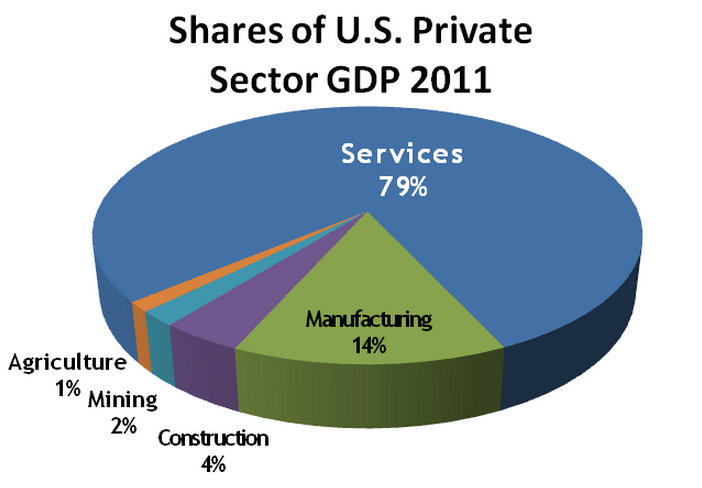
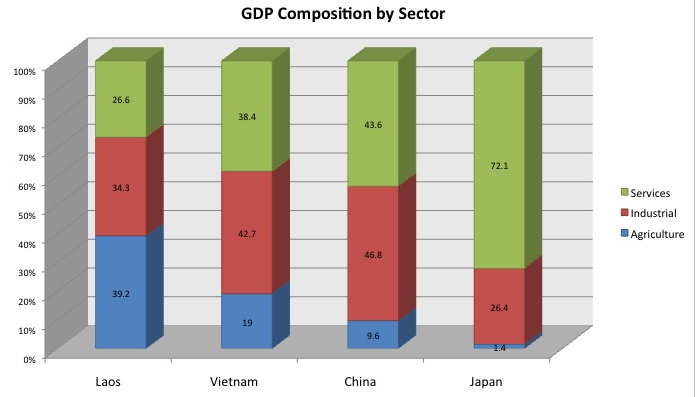
It is very important to know that commodity prices are completely dependent on the growth of China, as China is the biggest consumer of commodities in the world. If for example, the U.S. slows down 10%, it would be completely meaningless and wouldn't have any influence on the price of commodities. The reason is that the U.S. GDP is composed of about 80% services, which don't use any commodities (see Figure 1), while only 44% of China's GDP consists of services (see Figure 2). So all eyes should be on China for the commodity investor.
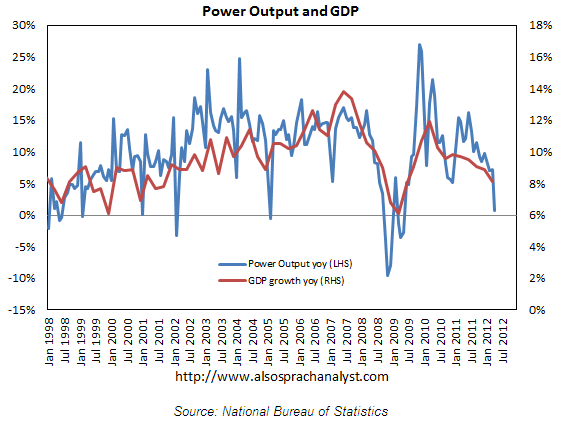
So what is the best way to find the real growth of China? We make use of historic correlations, and the best correlation is that between electricity consumption and year-over-year GDP growth.
Let me show that Chinese power consumption and Chinese power production go hand in hand with an almost 100% correlation (see Chart 2). If I talk about a decline in power production, it is a synonym for a decline in power consumption.
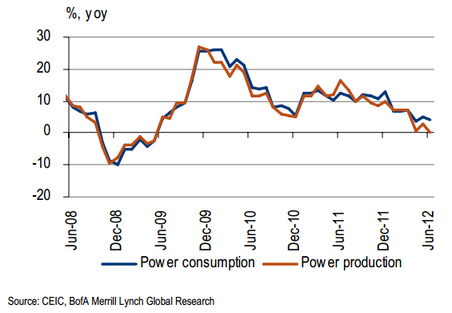 |
| Chart 2: China Power consumption/production |
Furthermore, as you can see in Chart 3, Chinese power output correlates very well with Chinese GDP growth.