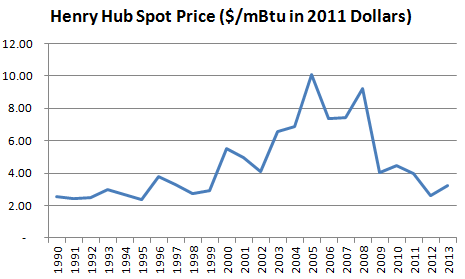
Natural gas was one of the best short trades over the past five years. Robust exploration and production by operators such as Chesapeake Energy (CHK) in Haynesville, and Range Resources (RRC) in Marcellus, drove natural gas spot prices from $10.07 per million BTU in 2005 to an average $2.62 in 2012.
But, the natural gas free lunch may have ended with spot prices recovering to $4.23 per million BTUs, up from $3.30 at the end of 2012.
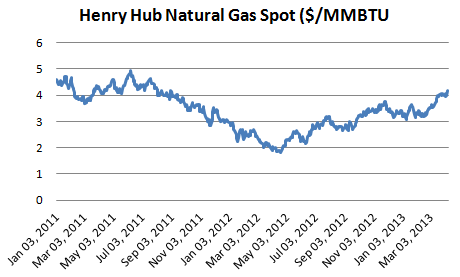
The price increase supports projections from the Energy Information Administration ("EIA") that natural gas (UNG) will average $3.25 this year before rising to as much as $4.05 by the end of the decade. This will come as welcome news to the largest natural gas producers, including Anadarko Petroleum (APC), Devon Energy (DVN) and Encana (ECA).
Evidence suggests the EIA's 2013 price assumptions may be light.
The main drivers of natural gas consumption are construction spending and industrial production. As more homes and buildings are built and widgets produced, demand for natural gas increases.
In February, U.S. construction spending increased 7.9% from the prior year, despite significant headwinds from falling public construction activity, which fell -1.5%.
Residential activity led, with private spending on new single family homes up 34.1% from last year. But, commercial activity picked up too as spending on office space, manufacturing and power increased by 10.5%, 9.5% and 6%, respectively.
And, U.S. industrial production climbed 3.5% from a year ago in March, with production climbing at an annualized rate of 5% in the first quarter. Important for natural gas investors, March industrial production at utilities rose 10.5% from a year ago.
The demand appears to have finally balanced the march higher in supply tied to spending in formations including Haynesville and Marcellus.
Natural gas inventories have normalized thanks to ramping consumption