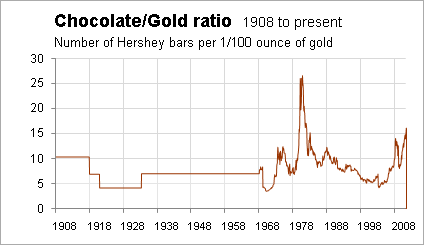
As some people who knock gold as an investment point out, "You can’t eat gold." But you can eat chocolate – so what’s the gold/chocolate ratio look like these days?
No, I’m not talking about chocolate as cocoa the commodity, but chocolate as an actual product – specifically a Hershey Bar.
You see, I found this set of data on food prices, with a list of prices for a Hershey (HSY) bar going back 100 years.
It’s interesting, not just because it gives us an idea of how gold may tend to track inflation, but also because it teaches us that adjusting prices for inflation isn’t so easy, especially when you go back many decades. This data is somewhat anecdotal, but I suspect it’s fairly valid over the long term.
So here’s the gold/chocolate ratio. It measures how many Hershey bars you could buy with 1/100 of an ounce of gold.
The problem with measuring prices is that the products themselves change. Hershey bars haven’t always been the same size. When the price of input commodities change, manufacturers might reduce the size of the product, or in some cases, increase the price and the size.
For example, here’s a chart showing both the price of the Hershey bar and the weight of the bar for that price.
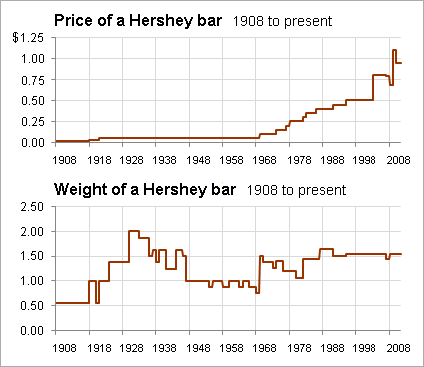
These days, it’s pretty easy to adjust product packaging for inflation, but in the olden days it wasn’t so easy. The 5-cent price for a Hershey bar was a standard from 1920 to 1968, but the notion of increasing the price to 6 cents probably seemed unthinkable, so the the weight of the bar fluctuated.
Now here’s a look at the gold/chocolate ratio based on the price of one ounce of Hershey bar chocolate, not the candy bar itself. (That’s troy ounces for gold and