The All-Cap-Blend investment style ranks second out of the 12 investment styles. It gets my Neutral rating, which is based on aggregation of fund ratings of all 661 funds in the style. Articles on all style and sector funds are here.
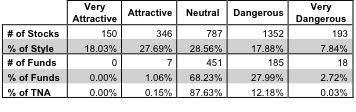
Per Figure 1, there are 496 out of the 2,828 stocks (over 26% of the market cap) held by large-cap-blend funds that get an Attractive-or-better rating. However, only 7 out of 661 funds (less than 0.2% of total net asses) in the style get an Attractive-or-better rating.
As detailed in "Cheap Funds Dupe Investors", the fund industry offers many cheap funds but very few funds with high-quality stocks, or what I call good portfolio management. Over 95% of all style funds get low portfolio management ratings and do not justify their costs.
Investors cannot assume that cheap funds are good investments. Research on the underlying holdings of a fund is necessary for an informed decision.
Figure 1: All Cap Blend Style Landscape For Funds & Stocks
Charts Source: New Constructs, LLC and company filings
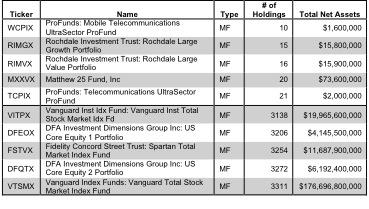
There are 661 funds to chose from within the All-Cap-Blend style, and they are all very different. Per Figure 2, the number of holding varies widely (from 10 to 3311), which creates drastically different investment implications and ratings.
How do investors pick the right fund out of the sea of choices that will deliver the best returns?
Figure 2: Funds with Most & Least Holdings - Top 5
To identify the best funds within a given category, investors need a predictive rating based on analysis of the underlying quality of stocks in each fund. See Figure 3.
My predictive fund ratings are based on aggregating (1) my stock ratings on each of the fund's holdings and (2) all of the fund's expenses. Investors should not rely on backward-looking research of